1 Introduction
As retirement schemes shift from defined benefit to defined contribution, many ordinary members are being compelled to choose investment portfolios for their accumulations. These choices depend both on personal financial competence and the menu of information offered by plan providers, advisers or financial institutions. Portfolio choices hinge on an appreciation of investment risk and have far reaching implications for the adequacy and security of retirement incomes.
Policy makers are rightly concerned with the effects of risk presentation, since plan members in the accumulation phase whose account choices are distorted by unclear risk information may be much worse off at the point of retirement. Under standard assumptions on risk preferences and distributions of returns, simulations (reported below) show that the reduction in certainty-equivalent retirement wealth due to investment choice mistakes may exceed 30% for members with typical risk preferences.
Financial regulators want to ensure effective communication between providers and clients through intelligible, standardized documentation.Footnote 1 However with growing evidence that many people lack even basic financial skills (Lusardi and Mitchell, Reference Lusardi and Mitchell2009),Footnote 2 focus is shifting from mandating minimum disclosures toward ensuring comparability, relevance, and comprehensibility to consumers.Footnote 3 Investment risk is key, and the financial services industry already uses many different formats to explain it in marketing and disclosure documents. Some steps toward regulated disclosures have been taken, but the relative merits of textual descriptions (used in the Securities and Exchange Commission Summary Prospectus), simple scales (stipulated by the European Commission), ranges or downside quantiles (stipulated by the Australian prudential regulator, APRA) are not yet clearly decided.Footnote 4
Recent studies of investment risk formats analyze dynamic and static illustrations of risk, including the combination of text and graphs (Vlaev et al. Reference Vlaev, Chater and Stewart2009), portfolio return distribution builders (Goldstein et al. Reference Goldstein, Johnson and Sharpe2008) and ‘experience sampling’, where decision makers receive feedback about outcomes (Kaufmann et al. Reference Kaufmann, Weber and Haisley2013). While distribution builders and ‘experience sampling’ are important additions to the financial advice tool kit, their role in retirement planning is usually restricted to professional advisers or proprietary interfaces, putting them out of reach of most ordinary retirement fund members.
Here we use a discrete choice experiment to show the effects on retirement plan account choice of different presentations of investment risk. However, unlike these earlier studies, the 1199 retirement plan members in the experiment reviewed versions of ‘mass-market’ risk presentations selected from current practice in the financial services industry or proposed by regulators. Because of the large differences in risk information actually conveyed by the current popular approaches, and given the range of formats being debated by regulators, we do not confine our study only to strict framing variations. In other words, the risk presentations analyzed here include some restatements of objectively equivalent information but also some where information sets do not completely overlap. Like Weber et al. (Reference Weber, Siebenmorgen and Weber2005), we aim to understand the way lay investors react to risk presentations to help inform policy choices, but we expand current research by implementing a within and between subjects design over a larger set of risk presentations.
Conditioning on subjective stockmarket expectations and individual demographics, we assess risk perception and presentation sensitivity at different levels of financial competence. Regardless of presentation style, respondents generally demonstrated a dislike of risk so that the likelihood of choosing riskier accounts fell as investment risk rose. However, respondents became less attentive to investment risk as their basic financial literacy worsened, so individuals with very poor scores did not pay attention to any changes in underlying investment risk. These respondents seemed incapable of making the risk-return trade-off that is critical to optimal investment choice. A respondent's age, retirement accumulation and the probability he or she assigned to the prospect of another stock market crisis in the near future significantly predict account choices. Older ages preferred diversified accounts; very wealthy subjects favored risky accounts and optimistic stock market expectations boosted risky account choice probabilities.
We identify risk presentations that tilt choices toward, or away from, high return/high risk accounts, and profile the groups of people most likely to choose safe or risky allocations. All formats are not equal and even minimal framing changes have significant effects on allocations. We find a marked contrast between graphical and textual presentations of investment risk and between formats that emphasize event frequencies rather than return ranges or values at risk.
Switching from a textual range presentation to a graphical range presentation elicited much riskier account choices, with the graphical presentation associated with the riskiest choices. If respondents viewed presentations that emphasized only the right or the left tail of the returns distribution, they appeared unable to deduce that a high probability of losses also often implies a high probability of gains. On the other hand, when risk was presented as the frequency of exceeding or falling short of a benchmark, portfolio choices overall were more conservative but also more variable, showing more sensitivity to reframing than when risk was presented as a likely range of outcomes. In other words, respondents appeared to have more trouble processing the frequency/benchmark formulations than the range formulations.
The next section explains the context and design of the discrete choice experiment, including the survey structure and alternative risk presentations. The following sections set out the underlying model for investment choice and estimation results. The final section discusses conclusions and implications for policy.
2 Background
The experiment is built around an investment decision for mandatory retirement savings where we ask each subject to allocate their current retirement accumulation and future contributions among a safe, risky and 50:50 account in 12 settings. All subjects (apart from the very few who have only ever been defined benefit (DB) fund members) would have made a similar decision in the past via their participation in the Australian retirement savings system. Consequently these hypothetical choices fall within the range of normal experience rather than unfamiliar scenarios that may be difficult to imagine.Footnote 5 Employers of all Australian workers who satisfy minimal conditions are required by law to contribute at least 9% of employees’ earnings to individual retirement savings (‘superannuation’) accounts that have many features in common with U.S. 401(k) plans. Most contributions are preserved in privately managed, defined contribution (DC) funds until a prescribed age. On joining a new DC fund, members (employees) are offered investment menus with upwards of ten (typically pre-mixed) options, differing by underlying asset mix, and usually including cash, fixed interest, local and overseas stocks, real estate and alternative asset classes such as private equity and infrastructure. These investment menus are set out in ‘product disclosure statements’ and accompanying documents that may run to several hundred pages.Footnote 6 Ordinary workers typically confront investment choices each time they change jobs, and are also able make ongoing changes after joining a fund, usually at zero or low cost. In reality, most members do not reallocate frequently and the majority of accounts are held in ‘balanced’ portfolios with 60–70% allocations to growth assets (Australian Prudential Regulation Authority, 2011).
2.1 Survey structure
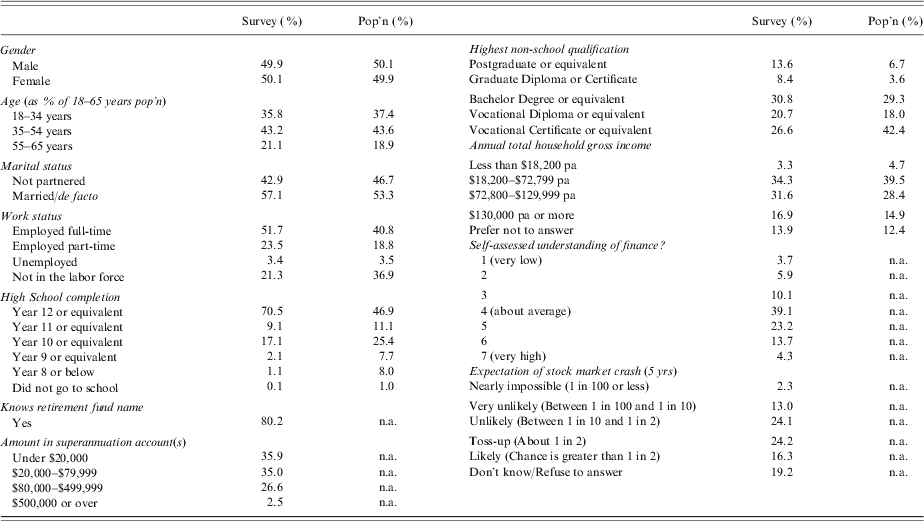
The experiment was conducted via the internet over 2 weeks in May 2010. We sampled 1,220 adults from the PureProfile online web panel of over 600,000 Australians and randomly assigned them to four treatments. PureProfile filtered the sample to ensure that all respondents currently held retirement savings (superannuation) accounts, that genders were equally represented and that the age distribution did not deviate far from population proportions. Of the 1,220 respondents, 1,199 (about 300 respondents per treatment) fully completed the survey over the internet, and were paid a flat rate of $3AUD ($3USD). The demographic characteristics of the survey sample is consistent with the general Australian population on most measures, with some oversampling of the employed and more educated, partly a consequence of selecting superannuation account holders (Table 1).
Table 1. Demographics 1
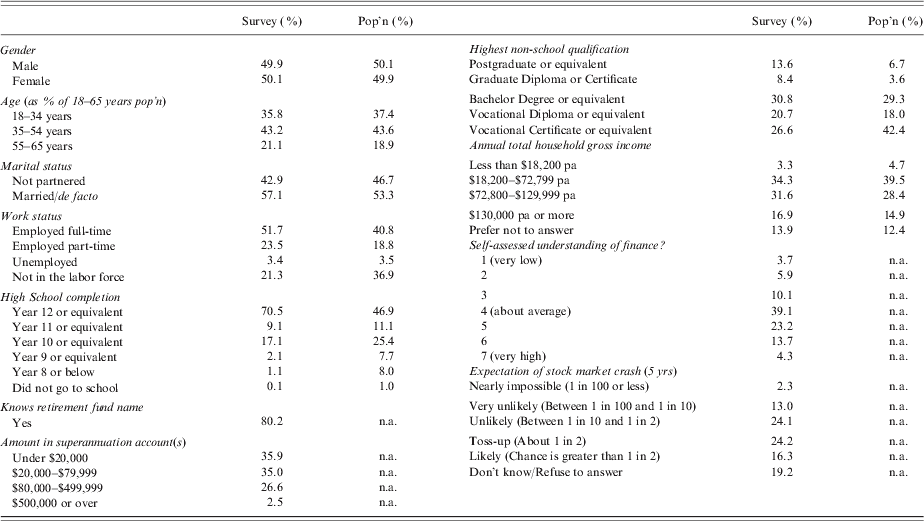
Notes: Table shows responses to survey questions compared with Australian census population data where possible. The survey sample of 1,220 is taken from the PureProfile web panel of 600,000 Australians and filtered to ensure that respondents were over 18 and current holders of a superannuation account. The entire survey is available at http://survey.confirmit.com/wix/p1250911674.aspx.
1 Source for population statistics: Australian Bureau of Statistics Census of Population and Housing and Household Wealth and Wealth Distribution, Australia, 2005–2006 .
Respondents completed a four-part questionnaire:
-
• Introductory questions about subjects' retirement savings, including the name of their superannuation fund (pension plan provider) and the aggregate amount in their accounts;
-
• 14 questions to measure financial competence as well as questions to elicit self-assessed knowledge of finance, access to financial education, use of financial advice and expectations of repeated stock market crises;
-
• A hypothetical asset allocation task for retirement savings; and
-
• Demographics.Footnote 7
2.2 Financial literacy, education and advice
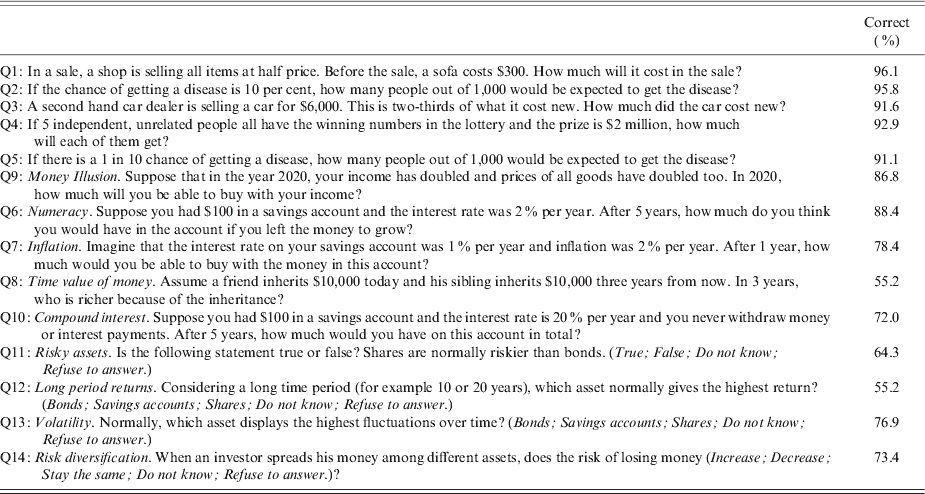
The survey assessed three dimensions of financial competence: numeracy, basic financial literacy and sophisticated financial literacy (Table 2). Higher financial capability is linked to retirement preparedness (Lusardi and Mitchell, Reference Lusardi and Mitchell2009; van Rooij et al. Reference van Rooij, Lusardi and Alessie2009) increased stock market participation (van Rooij et al. Reference van Rooij, Clemens and Prast2007; Yoong, Reference Yoong2010), higher private retirement saving (Bucher-Koenen, Reference Bucher-Koenen2010) and greater portfolio diversification (Guiso and Jappelli, Reference Guiso and Jappelli2008).
Table 2. Numeracy and financial literacy responses
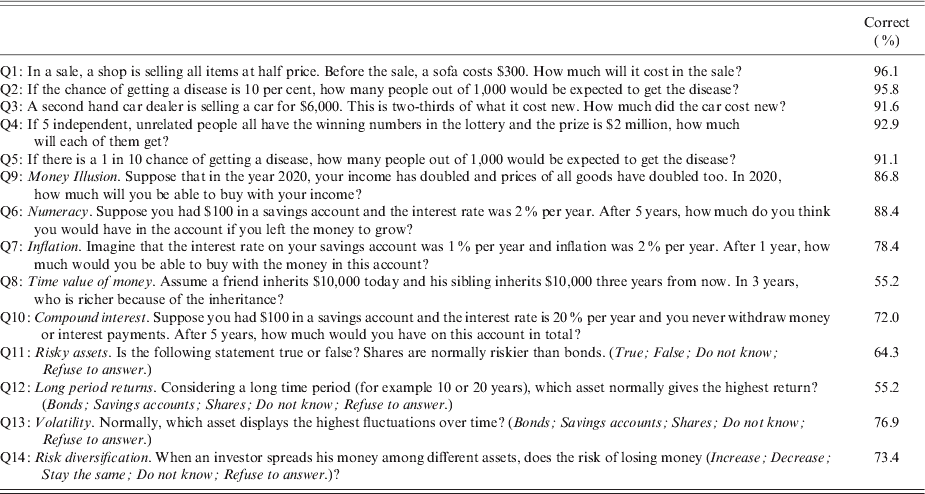
Note: Table shows proportion of correct responses in aggregate to numeracy and basic and sophisticated financial literacy questions. a. ‘Incorrect’ includes ‘don't know’ and ‘refuse to answer’. See notes to Table 1 for survey sample characteristics. Note that the factor analysis reassigns Q9 on money illusion to numeracy rather than basic financial literacy skills.
Numeracy is associated with general cognition, and poor numeracy has been shown to predict aspects of financial inefficiency such as low savings, mortgage defaults and mistakes using credit cards (Banks and Oldfield, Reference Banks and Oldfield2007; Gerardi et al. Reference Gerardi, Goette and Meier2010; Agarwal and Mazumder, Reference Agarwal and Mazumder2011). Numeracy questions test concepts such as fractions, percentages, division, multiplication and simple probability.
For other components of financial literacy, we follow the American Life Panel (ALP), the Health and Retirement Survey (HRS) and the Dutch Household Survey (DHS), dividing questions into ‘basic financial literacy’ covering compound interest, inflation, time value of money and money illusion, and ‘sophisticated financial literacy’ relating more closely to the asset allocation decisions frequently required for retirement saving, and covering knowledge of the differences between bonds and stocks and the impact of risk and diversification. For some questions we adapted the wording to Australian terminology and practices.
Respondents also gave a self-assessment of their understanding of finance on a scale of 1 (very low) to 7 (very high), reported current (and prior) access to financial education at school and in the workplace, and indicated if they had recently paid for financial advice. Further questions assessed respondents’ expectations of the prospect of another stock market crash within five years of the survey.Footnote 8
Self-assessed financial competence was high, (particularly for males) with more than 80% of respondents reporting at least an average understanding of finance. Views on the likelihood of another stock market crash in the near future were diffuse, and about 20% of respondents could not assign a probability to the prospect. The distribution of self-reported retirement savings account balances closely matched Australian Bureau of Statistics survey data (ABS, 2008), showing fairly modest accumulations, with 70% at $80,000 or less. Table 1 reports responses to key introductory survey questions.
Most respondents answered numeracy questions correctly, although 17% scored at least one incorrect response (Table 2). Results for the financial literacy questions were more variable, with only 36.5% of respondents correctly answering all basic financial literacy questions. Similarly, subjects had trouble with the sophisticated financial literacy questions, although disaggregated data not reported here showed higher scores for older respondents with large superannuation accounts. Only 35.5% of respondents correctly answered all sophisticated financial literacy questions.
To simplify econometric modeling of account choices, we constructed numeracy and financial literacy indices, along the lines of Lusardi and Mitchell (Reference Lusardi and Mitchell2009) and van Rooij et al. (Reference van Rooij, Lusardi and Alessie2009). We began by assigning a value of one to correct answers and zero to incorrect (which included ‘incorrect’, ‘do not know’ and ‘refuse to answer’) and then conducted an exploratory principal components analysis of the correlation matrix of the 14 recoded responses. Next, we retained the (three) factors with eigenvalues larger than one and applied a varimax rotation to obtain factor loadings that closely aligned with the original classification of the questions as numeracy, basic and sophisticated financial literacy. With the exception of question nine, the factor analysis preserved the original groupings. We then split the 14 instruments, into six numeracy questions, four basic literacy questions and four sophisticated literacy questions and conducted another principal component analysis. The result was three indices which could be used to describe the numeracy and financial literacy of each respondent in the modeling discussed below.
2.3 Allocation task
The discrete choice task reflects the fact that retirement portfolio decisions involve a substantial fraction of lifetime wealth, where risk preferences shape choices. We asked subjects to choose an investment option for their entire current mandatory retirement accumulation and all future contributions under a (hypothetical) simplification of retirement savings arrangements by the Government. Such regulatory simplifications have been enacted in the recent past and made a plausible context for the survey (Super System Review, 2010).
The instructions for the experiment are reproduced in Appendix 1 and present a simplified retirement savings scheme in which the only investment options are a 100% bank account (‘bank’) with a guaranteed real rate of return, 50% bank account and 50% growth assets (‘50:50’) and 100% growth assets (‘growth’) comprised of risky financial assets such as ‘shares and property’. The experiment instructions did not specify the exact composition of the growth account for two reasons: first, growth options in Australian superannuation investment menus often include a wide range of conventional and alternative asset classes and respondents may be distracted by descriptions of relatively unfamiliar alternative assets such as private equity and infrastructure. Secondly, as far as possible, we wanted to deflect attention away from current conditions in a particular financial market and encourage respondents to focus on the information given in the choice sets. Although we anchored the experimental settings of risk and returns in historical data, we did not say that they were past rates of return or risk levels to avoid, as far as possible, confounding the experimental information with personal views on the predictability of returns or parameter uncertainty.
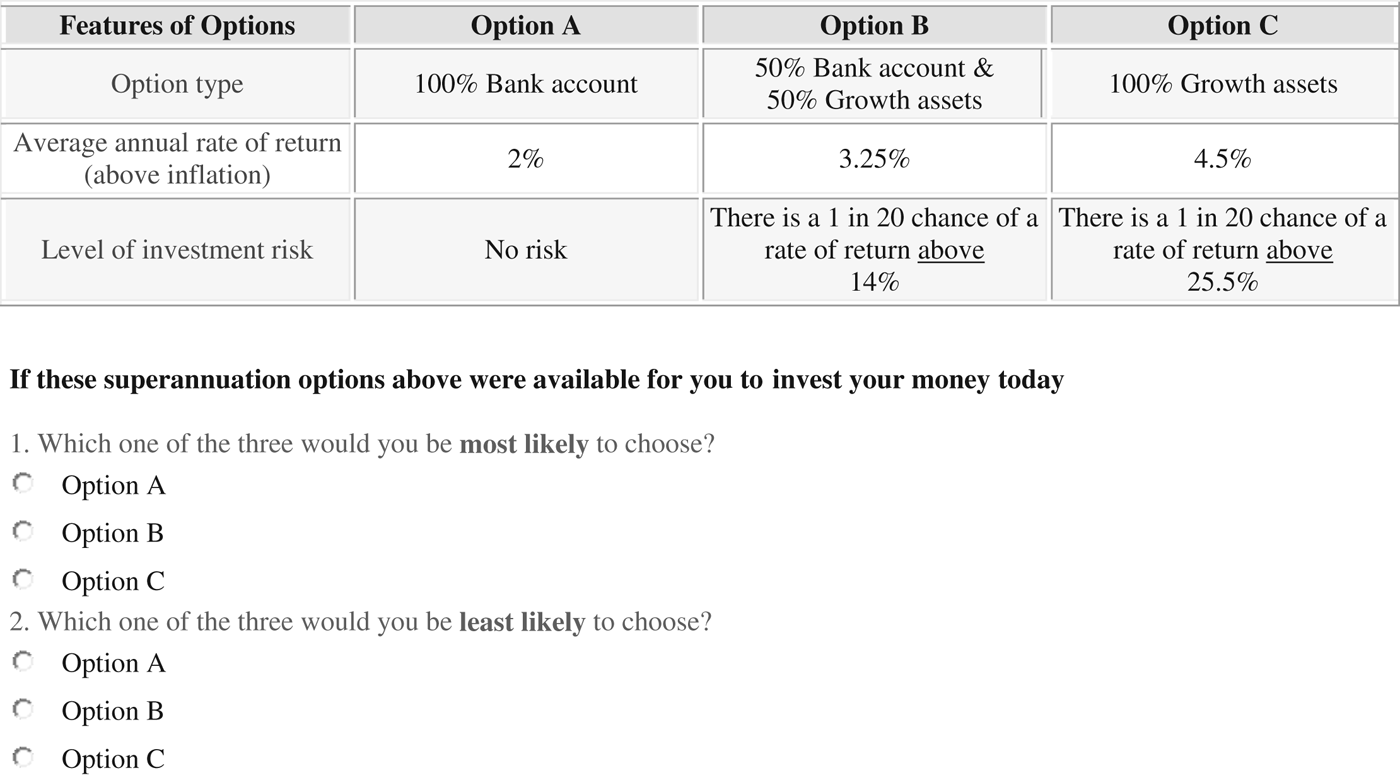
We asked respondents to select which option he or she would be most likely to choose, and which option he or she would be least likely to choose, in a series of settings in which average real returns remain the same but levels of risk and presentation of risk vary. There are 36 settings in total in the experiment, of which each respondent sees 12. Each setting presents the annual returns net of inflation (2% for the bank account, 3.25% for the 50:50 account, and 4.5% for the growth account) together with a presentation of risk for the 50:50 and growth accounts. (Figure 1 shows an example choice set.) The 12 settings are the product of four risk levels (common to all respondents) and three of the nine risk presentations, which we now describe.
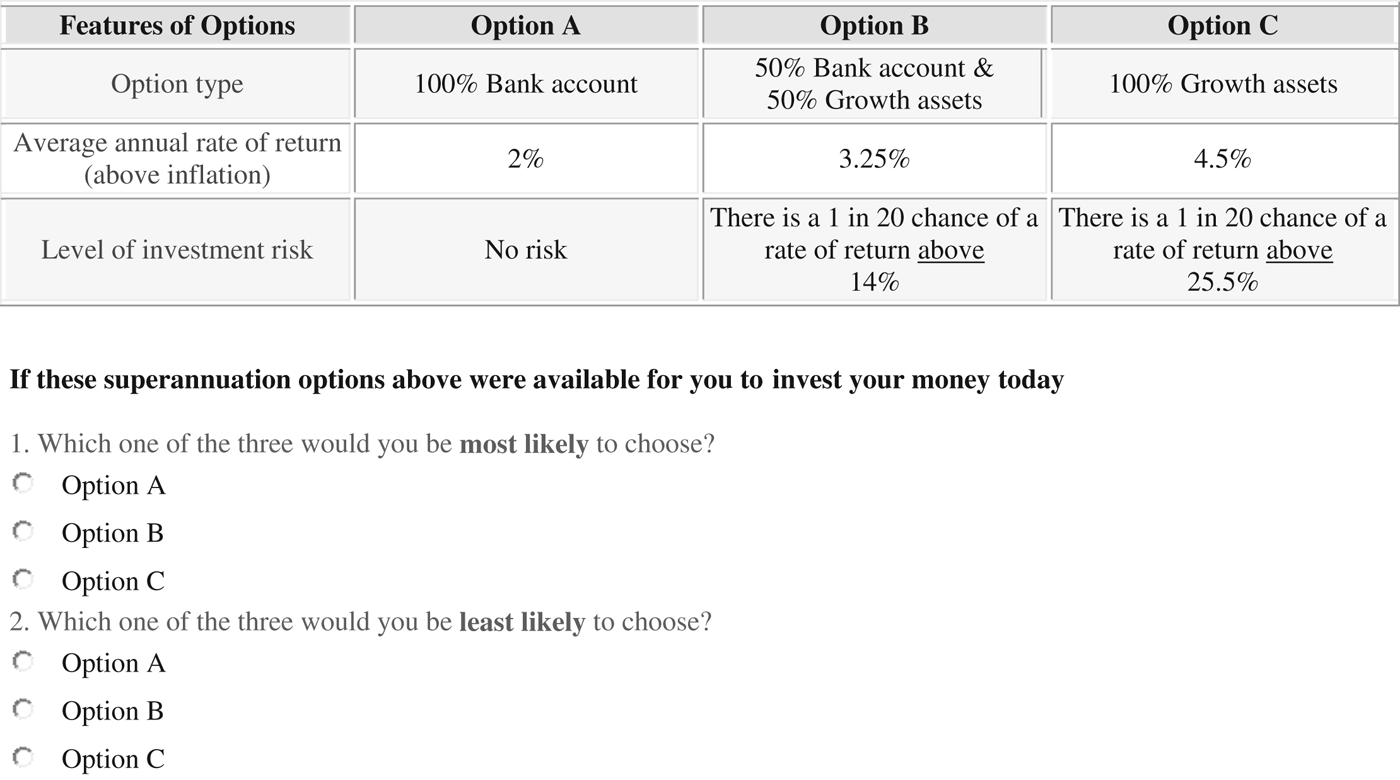
Figure 1. Example investment choice task. Note: Figure shows example investment choice task using presentation 3 (P3 as defined in Table 3) at risk level 1. There are 36 such settings in total. Each of 1,199 survey respondents answered 12 such tasks where rates of returns stayed constant and risk level (×4) and risk presentation (×3) varied.
2.4 Risk presentations
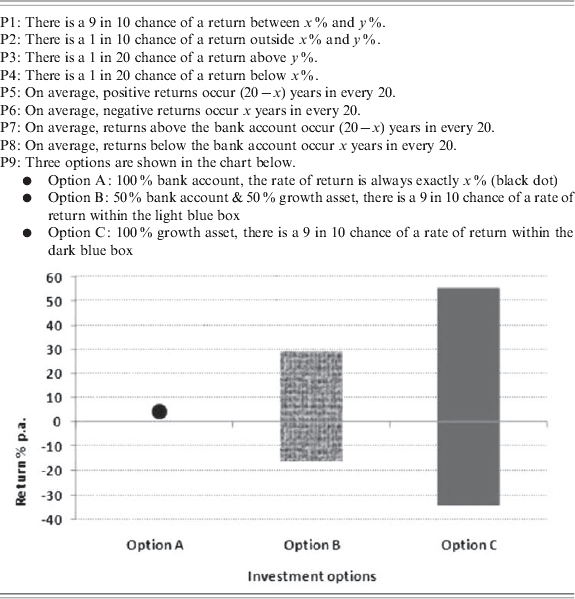
Presentations: We utilized modified versions of standard risk formats, drawn from retail financial documents in Australia and the United States, as well as from related studies (Vlaev et al. Reference Vlaev, Chater and Stewart2009). Table 3 sets out the nine formats. Presentations 1, 2 and 9 give returns ranges expressed as annual percentages with the probability of falling outside or within the range expressed as a frequency (‘1 in 10’, ‘9 in 10’) via text (P1 and P2) and as a graph (P9). Graphical presentation of returns ranges were proposed as a preferred risk disclosure format in the recent public review of the Australian retirement system (Super System Review, 2010, Chapter 4, p. 118) and ranges of returns for investment asset classes appear in typical retirement fund prospectuses, such as AustralianSuper, one of the largest general membership retirement funds in Australia.Footnote 9 Similarly, The Vanguard Group (US) use a risk description in mutual fund disclosures where the minimum and maximum quarterly returns over a 10-year period are reported via text, the implicit frequency of these events being around 1 in 20.Footnote 10 Following Vlaev et al. (Reference Vlaev, Chater and Stewart2009), to test sensitivity to range information, we break it down into right and left tail quantiles in presentations 3 and 4. The left tail quantile corresponds to Value at Risk measures more commonly used in institutional risk management and banking regulation (Jorion, Reference Jorion2007) and but which appears in some pension fund documentation.Footnote 11
Table 3. Alternative presentations for investment risk

Notes: Table shows nine alternative formats for investment risk information as inserted into retirement savings choice sets (see Figure 1). Each respondent answered 12 choice sets (3 out of the 9 presentations×4 risk levels). The nine investment risk presentations were arranged into four presentation groups then randomly assigned to one quarter of the sample of respondents: group A, 1, 2 and 9; group B, 3, 4 and 9; group C, 5, 6 and 9; and group D, 7, 8 and 9. Values of x and y depend on quantities derived from four log normal growth account returns densities with mean equal to 1.045 and standard deviation taking four values from the 0.12 to 0.28. Table 3 reports all x and y values that entered the risk presentations.
Presentations 5 and 6 convey risk as the average number of years in 20 that returns will be positive or negative. The negative frame of this presentation was recommended as good practice for investment risk descriptions by the Australian prudential regulator and is now mandatory in short form product disclosure statements.Footnote 12 The positive frame of this format has also been used by retirement funds.Footnote 13 We also introduce presentations 7 and 8, which benchmark against the bank account, the risk-free rate. For P7 and P8, the average number of years below benchmark sometimes includes a half-year (e.g., 9.5 years in 20) because of different underlying risk levels implied the same number of whole years with rounding in several cases.
Framing effects occur where changing the statement of an objectively equivalent scenario tilts preferences in different directions (Tversky and Kahneman, Reference Tversky and Kahneman1981). Numerous studies have demonstrated the sensitivity of preferences to lottery outcomes framed as gains or losses but investigation of framing effects have widened to include many additional modes of presentation and different contexts, including retirement savings choices returns. (Levin et al. (Reference Levin, Schneider and Gaeth1998) gives a survey and typology of framing studies. See Maule and Villejoubert (Reference Maule and Villejoubert2007) for a more recent review.) The presentations utilized here are not always objectively equivalent scenarios: presentations 1 through 4 and presentation 9 convey risk through the cumulative distribution function of annual returns whereas presentations 5 through 8 convey risk through the frequency of returns exceeding or falling below simple reference points or benchmarks. Presentations 3 and 4 inform respondents about either the left or right tail of the returns distribution, whereas presentations 1, 2 and 9 give information about both tails. We include these information differences in the experiment because financial service providers and regulators do not confine themselves to presentations that are strict reframings of equivalent content when comparing disclosure formats.
Some subsets of the nine presentations do convey equivalent information and allow conventional framing tests. Presentation 1 emphasizes the likelihood of returns within the range, presentation 2 emphasizes the complementary likelihood of returns outside the range, and presentation 9 shows the range in a graph. These three create a test of sensitivity to wording that emphasize the center or the tails of the returns distribution (P1 versus P2) and also of changing from text to graphs (P1 and P2 versus P9). Similarly, presentations 5 and 6 (7 and 8) convey equivalent information on gains or losses around a benchmark.
We arranged the nine investment risk presentations into four groups (denoted ‘presentation groups’), each made up of three risk presentations with the visual range graph (P9) common to each group. For one group of respondents, A, the presentations are 1, 2 and 9; for group B, 3, 4 and 9; C, 5, 6 and 9; and for group D, 7, 8 and 9.
Investment risk levels: The standard deviation of returns to the growth asset enters the choice sets at four levels ranging from 12% to 28% p.a. Every subject made choices across all four risk levels in each of three of the nine presentations. Table 4 reports the simulated values that entered the risk presentations. By holding the expected return constant and allowing the risk of the 50:50 and growth accounts to vary, we created mean-preserving spreads of the returns distributions. Bateman et al. (Reference Bateman, Ebling, Geweke, Louviere, Satchell and Thorp2010) gives a description of the theoretical model and underlying returns densities used to calibrate the choice sets.
Table 4. Investment risk levels and presentation parameters


Notes: Top panel shows net rates of return entered into retirement account choice sets (see Figure 1 for example choice set), and four volatility levels of the distributions of mixed and growth account returns. Lower panel shows numerical values entered into choice sets for presentations 1–8 at four risk levels (Table 2).
The experimental design provided nearly 14,400 rankings of the three accounts: around 1,200 per format for P1–P8, and nearly 4,800 for P9. In the econometric analysis below, we concentrate on explaining ‘most preferred’ choices using investment risk, risk presentation, financial competence and demographics. This allows us to estimate presentation effects on stated preferences for retirement investments in a general framework.Footnote 14
3 Model
We assume individuals maximize a general linear random utility function in choosing their most preferred retirement savings (superannuation) accounts. We estimate a conditional mixed logit, as described in Revelt and Train (Reference Revelt and Train1998), where the mixing is due to random individual error components (random intercepts) rather than random coefficients on attributes. The alternative-specific intercept varies with investment risk presentation, and observed and unobserved respondent characteristics. Predicted choices also depend on taste for investment risk adjusted by interactions between the variable risk level and each respondent's financial competence factor scores.
We write the nth individual's random utility (Unktj ) from investment option (alternative) j (j=1, …,3), for risk presentation k (k=1, …,9), at risk level t (t=1, …,4) as
where α j is a (1×13) vector of alternative-specific coefficients on a constant and observed respondent characteristics including age and age squared, reported retirement savings (superannuation) accumulation, six indicator variables for equity market expectations, numeracy and financial literacy factor scores (z); γ jk is a (1×4) vector of presentation and alternative-specific coefficients on a constant and the interactions between the presentation risk indicator and three numeracy and financial literacy scores of individual n (ln ); β j is a (1×4) vector of alternative-specific coefficients on the risk level of investment alternative j and interactions between the risk of alternative j and three numeracy and financial literacy scores for individual n, (xnjt ); and η njkt is a random error comprised of two components such that η njkt =μ nj +∊ njkt . The first error component is assumed normally distributed and captures unobserved heterogeneity among individual respondents that may create serial correlation in the errors. These alternative-specific random effects μ n =(μ n 1, μ n 2)’ are multivariate normally distributed μ n ∼N(0,\Ω), with Ω=diag(ω1 2, ω2 2). (The error component of the third alternative is μ n 3=−(μ n 1+μ n 2).) In other words, the random effects, μ nj , are draws from a scaled standard normal distribution, where the unit standard deviation is scaled by the alternative-specific parameter ω j . The second error component ∊ njkt is assumed iid extreme value with zero mean and variance π2/6 and is independent of μ nj .
Given the assumption regarding the error term ∊ njkt , the choice probability for alternative j can be expressed as
and the unconditional choice probability is given by the integral over all possible values of μ n
 $$P_{njkt} = \mathop \int \limits_\mu \displaystyle{{{\rm e}^{\alpha _j^{\prime} z_n + \gamma _{jk}^{\prime} l_n + \beta _j^{\prime} x_{jt} + \mu _{nj} } } \over {\mathop \sum \nolimits_i {\rm e}^{\alpha _i^{\prime} z_n + \gamma _{ik}^{\prime} l_n + \beta _i^{\prime} x_{it} + \mu _{ni} } }}f(\mu )d\mu .$$
We augment standard maximum-likelihood methods for the conditional logit component with Gauss–Hermite quadrature for the (normal) integral over the random effects. Estimation of the parameters of this probability is implemented in Latent GOLD software (Magidson and Vermunt, Reference Magidson and Vermunt2005). We restricted the set of covariates to those found to be relevant after pre-testing more general models.
4 Estimated choice probabilities
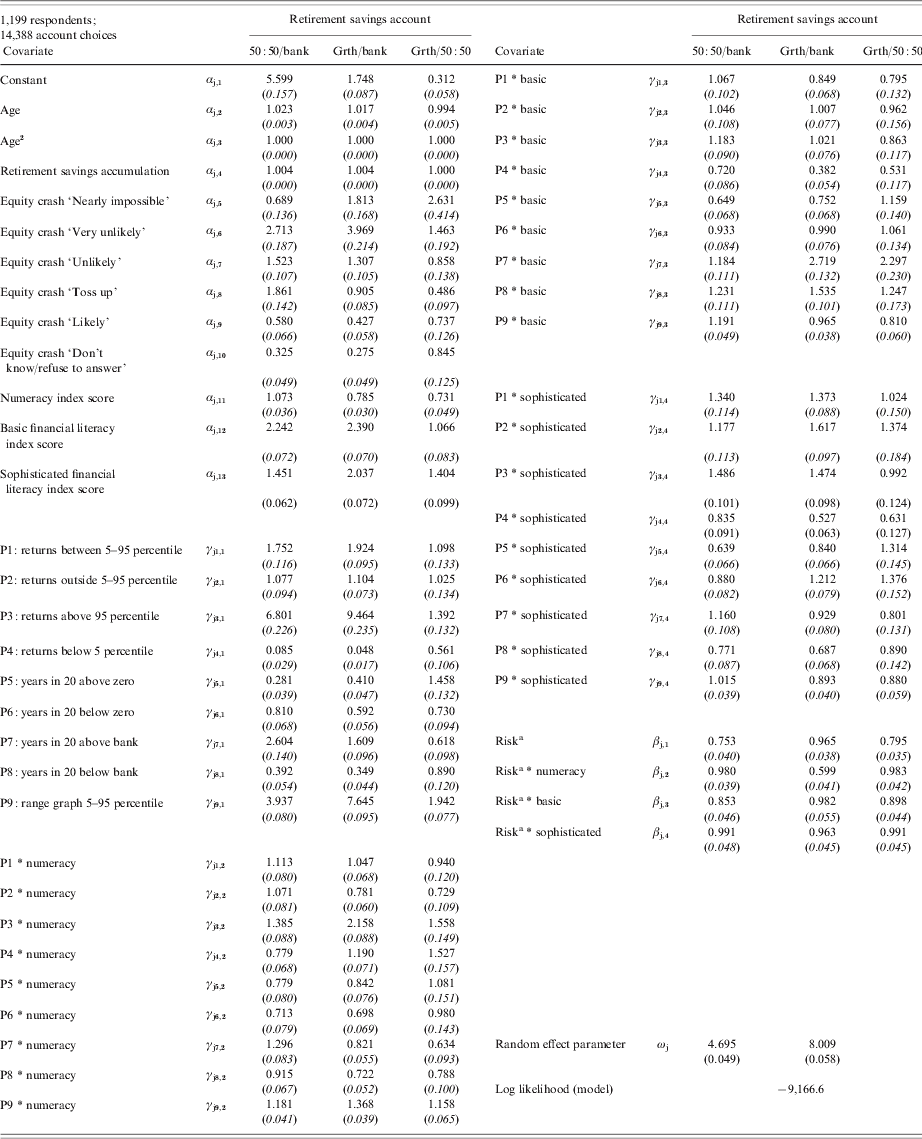
Estimated odds ratios from the maximum-likelihood estimation of the model in equation (1) and standard errors are reported in Table 5. The ratios show the change in the odds of choosing one account over another when the relevant covariate increases by one. For example, the odds ratio 1.023 in the second cell of column one indicates that when age rises by one, the odds of choosing the 50:50 account over the bank account increase by 2.3%, holding other things equal. On the other hand, the odds ratio of 0.994 in the second cell of column three indicates that when age rises by one, the odds of choosing the growth account over the 50:50 account decrease by 0.6%. Odds ratios of one mean that the covariate leaves the odds of choosing one account over another unchanged. For risk, and interactions between risk and financial competence index scores, the table reports the scaling of odds caused by an 8% p.a. increase in growth asset volatility, which implies at 4% p.a. increase in 50:50 account volatility.
Table 5. Odds ratios for mixed logit choice model
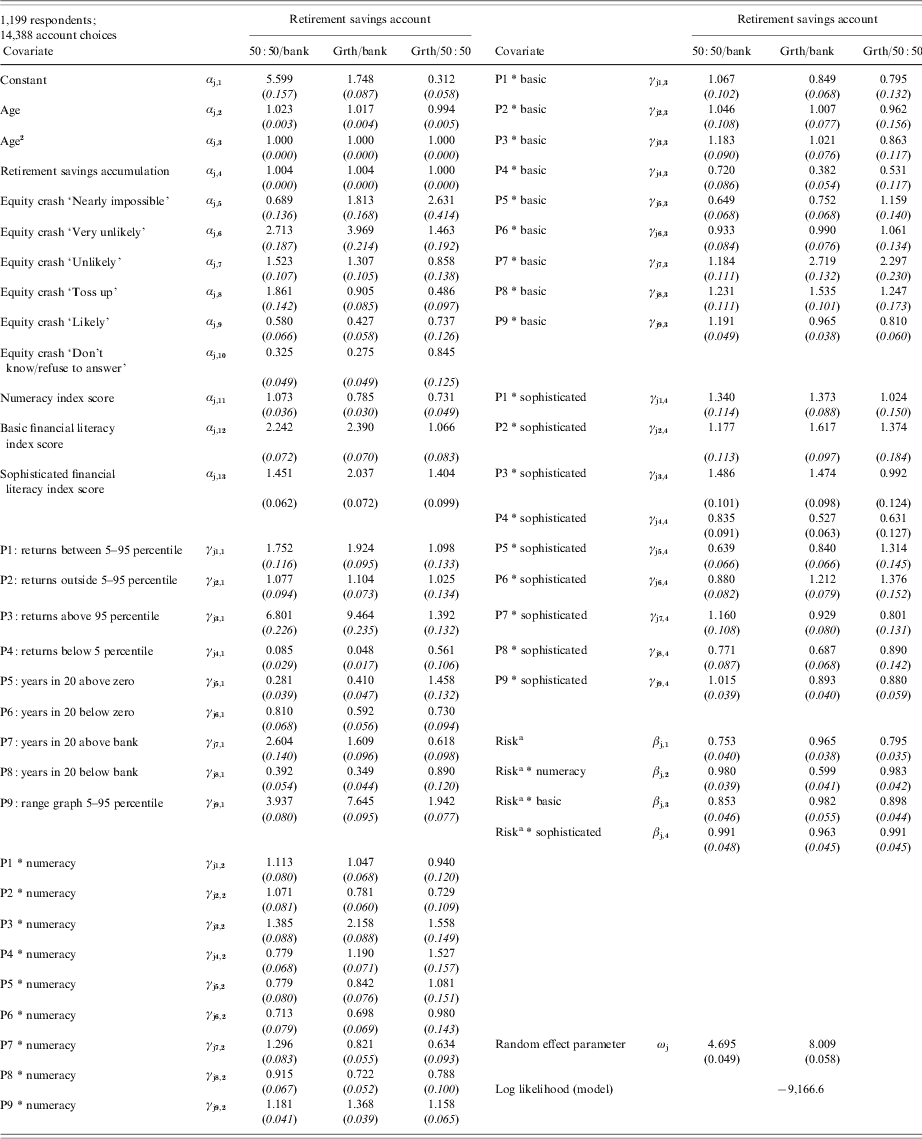
Notes: Table shows estimated odds ratios for model of retirement savings account choices. Odds ratios show the change in the odds of selecting the 50:50 or growth accounts over the bank account, or the growth account over the 50:50 account, when the relevant covariate rises by one. For example, a ratio of 1.5 indicates a 50% increase in the probability of choosing the numerator account over the denominator account.
a For risk and risk interactions, we compute the change in odds associated with an 8% p.a. increase in growth asset volatility (a 4% increase in 50:50 volatility). Approximate standard errors, computed using the delta method, are in brackets.
The odds ratios show that increasing age, retirement wealth, and stock market optimism all have positive and statistically significant effects on the likelihood of riskier account choices. Increasing age leads to a stronger preference for the 50:50 account at the expense of both bank and growth accounts. Retirement account balances affect choice probabilities only at very high levels (toward $1 million or more) where preferences for the growth account increase sharply. A greater amount of choice variation is due to optimistic or pessimistic views on the stock market. A respondent who rated the probability of another large stock market crash in the next five years as ‘nearly impossible’ increased the odds of choosing the growth account over the bank account by more than 80% (odds ratio of 1.810 in row 5, column 2) compared with people who thought the chance of another crash was as likely as not (‘a toss-up’) where the odds of growth over bank were reduced by 10% (odds ratio of 0.905 in row 8, column 2). More pessimistic or uncertain respondents (who chose ‘don't know’) exhibited much more conservatism.
The changes in choice probabilities due to these covariates can be large compared with the impact of changes in investment risk itself. For example, the increase in the odds of selecting the growth over the 50:50 account is much greater (146%) when a respondent thinks another stock market crash is ‘very unlikely’ (row 6, column 3) than if growth account risk falls by 8 percentage points (125% – the inverse of 0.795, in panel 2, row 3, column 10). Results indicate that people mix the risk information offered in the survey, and by implication, in commercial prospectuses, with their own priors and uncertainty. We cannot test this proposition here and leave it to future research.
Improvements in basic and sophisticated financial literacy increase the odds of choosing the growth account over the 50:50 account, whereas improvements in numeracy reduce those odds. Increasing risk levels significantly reduce the odds of choosing the 50:50 and growth accounts over the bank account, indicating that the average respondent is risk averse. Further, coefficients on indicators for risk presentations and their interactions with financial competence scores are significant. A precise interpretation of the marginal effects depends on the levels of all covariates so we turn now to consider these effects on the choice probabilities of the median respondent.
4.1 Investment risk
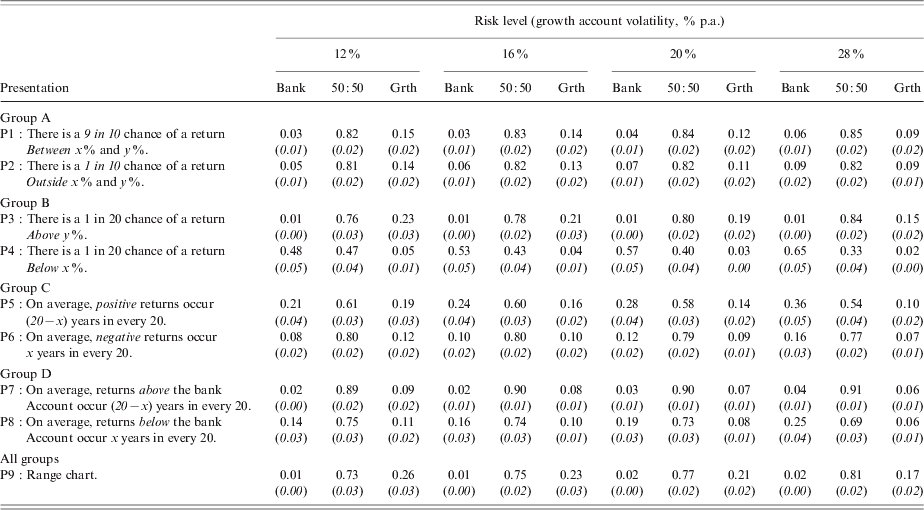
The benchmark (median) respondent is 35–44 years of age and has a retirement savings account balance of $20,000–39,900, considers the prospect of another large stock market crash within the next 5 years to be as likely as not (a ‘toss-up’) and has numeracy and basic and sophisticated financial literacy scores above the (zero) mean at 0.466, 0.227 and 0.272, respectively. Along with all other respondents, this individual evaluated the graphical risk presentation (P9). If the underlying risk level of the growth account is set at 20% p.a., a respondent with this median profile chooses the bank account with a 1.9% probability, the 50:50 account with a 76.9% probability and the growth account with a probability of 21.2% (Table 6, last row, third column) showing a preference for the middle choice among three of increasing risk, consistent with Benartzi and Thaler (Reference Benartzi and Thaler2002).
Table 6. Predicted account choice probabilities for median respondent

Notes: Table shows estimated choice probabilities for retirement savings account choices for median respondent by risk level and risk presentation. The median respondent is 35–44 years of age and has a retirement savings account balance of $20,000–$39,900, considers the prospect of another large stock market crash within the next five years to be as likely as not (a ‘toss-up’) and has numeracy and basic and sophisticated financial literacy scores of 0.466, 0.227 and 0.272, respectively. Approximate standard errors, computed using the delta method, are in brackets.
Moving along the last row of Table 6, holding risk presentation fixed but allowing the risk level to increase, we see that the probability of choosing the growth account declines by 9 percentage points (standard error of 3%) as volatility rises by 16 percentage points, while the bank account gains 1 percentage point and the 50:50 account, 8 percentage points. This pattern of risk aversion holds for all presentations. The largest change in choice probability due to increasing volatility is estimated for P4, when only the chance of left tail returns are reported. (Note that P4 does not give information about possibly high returns, just as P3 does not give information about possible low returns, so we anticipate more extreme responses.) In this case, the probability of the median respondent choosing the bank account increases from 48% to 65% for a 16 percentage point increase in risk. Overall, however, the effect of increasing returns volatility on stated preferences is modest.
4.2 Presentation effects
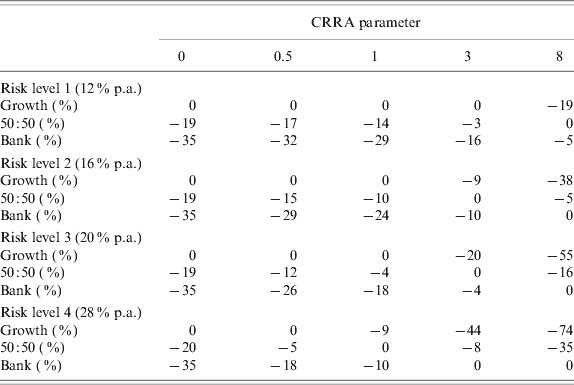
To give some context to presentation and framing effects described here, we can compare account choices using a certainty equivalent wealth measure. Differences in preferences, work history and background wealth make measuring individual welfare losses due to misperception of risk very difficult. As a rough guide to the potential impact of choosing the ‘wrong’ account, Table 7 shows certainty equivalent wealth reductions at retirement for a representative plan member with CRRA preferences who chooses the wrong account. Take a worker who earns a constant real wage close to the current median (around $50,000 p.a.) for a 30 year working life and who contributes a fixed $4500 p.a. (9%) to a retirement savings account that is invested in either the growth, 50:50 or bank accounts. (When investing in the growth account, this strategy results in accumulations of around $290,000, in the 50:50 account of close to $230,000 and over $190,000 in the bank account). Assuming that returns are net of fees and taxes and allowing growth account risk to take one of four values from 12% to 28% p.a., we simulate the expected utility of 10,000 retirement wealth values for relative risk aversion levels from 0 to 8 then compare the certainty equivalent wealth levels at retirement.
Table 7. Variations in certainty equivalent retirement wealth (percent reduction in optimal wealth)

Notes: Table reports percentage reduction in certainty equivalent wealth at retirement due to suboptimal allocation of retirement savings to growth, 50:50 or bank account for CRRA investor. Optimal choices are indicated by 0%. Certainty equivalent wealth is computed as the inverse of expected utility of 10,000 simulated values of retirement wealth for a worker contributing $4,500 p.a. into an account over a 30 year working life. Agents annuitize wealth at retirement. Growth account returns are computed as 30 draws from a lognormal distribution with mean 1.045 and standard deviation of 0.12, 0.16, 0.20 or 0.28. Bank account returns accumulate at a constant gross return of 1.02 p.a.; 50:50 account returns are the sum of half the growth account return and half of the bank account return.
Welfare comparisons for retirement depend on mortality, future investment and spending patterns, so to simplify here, we assume that members purchase a lifetime annuity with their accumulation.Footnote 15 On this basis, the cost of mistakes range from as little as 3% to as much as 74%. At the lowest risk level, a plan member with risk aversion at or below unity would be 30% worse off if they chose the bank account instead of the risky account. The opposite extreme is a very risk averse member who mistakenly chooses the risky account at the highest risk level and is 74% worse off in utility terms. For members with relative risk aversion in the more conventional range of 0.5–3, losses range from 3% to 44%. So if presentation and framing distort choices, mild to moderate losses for plan members are likely.
Compared with the effect of higher risk, the changes in account choices due to switching risk presentation are dramatic: we see much greater variation down the columns than along the rows of the Table 6. Switching from text to graphs for example, has a large impact. Visual displays of risk are popular in documentation and may help understanding of numerical risks by effective depiction of proportions, by evoking automatic mathematical operations and facilitating better comparisons (Lipkus, Reference Lipkus2007). Here, the range graph (P9) is associated with the least probability of choosing the bank account and highest probability of 50:50 and growth account choice probabilities. Under P1, for instance, the growth account choice probability declines by 6 percentage points as risk rises from 12% to 28%, but keeping risk constant and reframing from text to graph (switching from P1 to P9) causes an increase in growth account probability of nearly twice that amount, 11 percentage points.
The largest switch in choice probabilities within the same treatment group is for Group B, when respondents see the upper (P3) and then the lower (P4) tail values at risk. It appears that this group does not infer that a high probability of losses also implies a high probability of gains when evaluating accounts, and exhibit more caution than recklessness. Their flight-to-safety when presented with the lower tail risk is much larger (57% probability of choosing the bank account and 3% of choosing the growth account) than the switch to growth when seeing the upper tail risk (23% probability of choosing the growth account). For investors with relative risk aversion of one or less, if hearing only about lower tail risk leads to a mistaken choice of the bank account rather than the risky account, welfare losses as high as 30% may follow (Table 7).
The least variation in probabilities is for changes in the range presentations (Group A) where choices are largely constant despite P1 emphasizing the center of the returns distribution and P2 emphasizing the tails. The stability of choices under range presentations confirms results of Vlaev et al. (Reference Vlaev, Chater and Stewart2009) .
Benchmark presentations (P5–P8) induce generally more conservative choices and show more variation than range presentations (P1, P2 and P9). Just changing the benchmark from a zero return to the bank account return creates a 30 percentage point variation in the probabilities of choosing the 50:50 account and close to 20 percentage point variation in probabilities of choosing the bank account. These mistakes are also potentially costly: wrongly choosing 50:50 over bank or vice versa can penalize utility of wealth at retirement by between 5% and 35% (Table 7). Within-group variations for Group A, and for the first two presentations in Groups C and D, are strict framing effects and we consider these next.
4.3 Framing effects
Beginning with Tversky and Kahneman's (Reference Tversky and Kahneman1981, Reference Tversky and Kahneman1986) Asian Disease problem, most framing experiments find that people accept more risk under loss frames and less risk under gain frames (Levin et al. Reference Levin, Schneider and Gaeth1998). However, when we give subjects a choice among three accounts of increasing risk, the impact of loss and gain framing on risk aversion is not monotonic. Here we find that loss versus gain framing causes people to choose the 50:50 account more, and both the bank and growth accounts, less. The effects of loss and gain framing contrast in group C and D choices, where respondents see the average frequency in a 20-year period of experiencing returns above or below a benchmark. For example, when shown the gain frame P5 (average number years out of 20 when returns will be positive at 20% risk, Table 6), the median respondent chooses the bank account with 28% probability, and when shown the same information reframed as a loss (P6), this probability falls to 12%, consistent with the standard result. However, the growth account probability is higher (14%) for the gain frame than for the loss frame (9%) indicating that the gain frame leads to more risk tolerant behavior. Clearly, if the probability of bank and growth both go up, the probability of choosing the 50:50 account must be much lower under the gain frame (58%) than under the loss frame (79%). (All these effects are large relative to the estimated standard errors.) In other words, rather than uniformly inducing risk aversion, information about frequencies of positive returns shifts choices away from the 50:50 account toward both the safe and risky extremes, whereas emphasizing negative returns does the reverse.
Moreover, when respondents are told the average number of years out of 20 when returns will be above (P7) or below (P8) the bank account, we find the same pattern of choices shifting away from the extremes, but now reversed for gains and losses. Here, the median respondent chooses the bank account and the growth account with a significantly higher probability, and the 50:50 account with significantly lower probability, when the frame emphasizes losses (P8). So in one reframing (P5 and P6) ‘gains’ induce extreme account choices and in the other reframing (P7 and P8), ‘losses’ do.
At this point we need to distinguish between using ‘framing’ as the label for internal representation of a choice by the decision maker and ‘framing’ as the way the problem is formulated by the experimenter (Maule and Villejoubert, Reference Maule and Villejoubert2007). It seems likely that either our classification of P5 as a ‘gain’, or P8 as a ‘loss’, does not fit the internal representations of the survey respondents but we cannot infer which classification might be wrong. What is clear is that reframing losses as gains does not change risk preferences monotonically, as often concluded in past studies, but shows up as a movement toward the middle from the extremes. Further, these reframings may be important: the 50:50 account is optimal at several risk levels for investors with CRRA parameters of 1–3, and shifting to the extremes can result in losses of 4%–20% of certainty equivalent wealth.
Finally, presentations 1 and 2 are textual reframings of the range graph and this reframing is associated with a substantial change in choice probabilities. Switching to the graphs from P1 or P2 raises the probability of the median respondent choosing the growth account by around 10 percentage points (standard errors about 2%), whereas switching emphasis from the center of the distribution (‘9 in 10 chance of a return between’) in P1 to same information emphasizing the tails (‘1 in 10 chance of a return outside’) has no significant effect. By constrast, some psychological studies show that graphical representations of risk reduction induce a greater willingness to pay to avoid risk than numerical information (see, for example, Schirillo and Stone, Reference Schirillo and Stone2005).
4.4 Variations in numeracy
Figures 2–4 show an array of graphs that capture the effects of risk level and risk presentation on choice probabilities at varying levels of financial competence, and we turn to those results now. Each graph shows the probabilities of choosing the bank, 50:50 and growth accounts as either numeracy (Figure 2), basic (Figure 3) or sophisticated (Figure 4) financial literacy index scores move from the 1st to the 99th percentile. Standard errors for each choice probability computed using the delta method are summarized in the figure notes. Each row of the figures corresponds to one of the nine risk presentations (P1–P9) and the four panels along each row correspond to the risk level for the growth account indicated near the head of the figure (12% to 28%).

Figure 2. Probabilities of account choice as a function of numeracy. Notes: Each panel indicates the predicted probability that a respondent chooses the bank account (black), 50:50 account (pale gray) and the growth account (dark gray) as a function of the quantile of the respondent's numeracy score (horizontal axis). The panels in each row correspond to a given risk presentation, indicated at the left end of the row and defined in Table 3. In each row, each of the four panels corresponds to the risk level indicated near the head of the table. All other respondent characteristics are set to median values. 90% of the standard errors fell between 0.0032 and 0.0502.

Figure 3. Probabilities of account choice as a function of basic financial literary. Notes: Each panel indicates the predicted probability that a respondent chooses the bank account (black), 50:50 account (pale gray) and the growth account (dark gray) as a function of the quantile of the respondent's basic financial literacy score (horizontal axis). The panels in each row correspond to a given risk presentation, indicated at the left end of the row and defined in Table 3. In each row, each of the four panels corresponds to the risk level indicated near the head of the table. All other respondent characteristics are set to median values. 90% of the standard errors fell between 0.0028 and 0.0570.

Figure 4. Probabilities of account choice as a function of sophisticated financial literacy. Notes: Each panel indicates the predicted probability that a respondent chooses the bank account (black), 50:50 account (pale gray) and the growth account (dark gray) as a function of the quantile of the respondent's sophisticated financial literacy score (horizontal axis). The panels in each row correspond to a given risk presentation, indicated at the left end of the row and defined in Table 3. In each row, each of the four panels corresponds to the risk level indicated near the head of the table. All other respondent characteristics are set to median values. 90% of the standard errors fell between 0.0034 and 0.0509.
Numeracy scores depend on correct answers to questions testing general arithmetic skills with no stronger link to retirement savings decisions than to other financial decisions, but changes in numeracy have some surprising effects on account choices. At very low levels of numeracy, the model predicts high probabilities of choosing the growth or bank accounts that decline in favor of the 50:50 account as numeracy improves. For example, the bottom right panel shows the least numerate have choice probabilities for bank, 50:50 and growth of 7%, 57% and 36%, whereas the most numerate have probabilities of 2%, 81% and 17% (standard errors below 2%). This pattern can be seen for all risk presentations except P3 and P4, suggesting that very innumerate respondents may tend to choose concentrated portfolios in preference to mixtures.
Further, changes in choice probabilities due to presentation switches are larger as numeracy declines. For example, moving from P2 to P9 (reframing range information from text to graph) at the highest risk level, changes the choice probabilities for bank, 50:50 and growth by an average of 20 percentage points for the least numerate but by an average of 5 percentage points for the most numerate.
Our results confirm Peters and Levin's (Reference Peters and Levin2008) finding that numeracy moderates framing effects. They attribute this to a tendency of innumerate subjects to integrate fewer items of information and to respond more to non-numeric information sources. In addition, several existing studies show that higher cognitive scores are correlated with lower risk aversion and lower error rates in complex decisions (see, among others, Burks et al. Reference Burks, Carpenter, Goette and Rustichini2009), although Dave et al. (Reference Dave, Eckel, Johnson and Rojas2010) demonstrate that risk aversion measures from innumerate subjects are sensitive to elicitation method. Our results do not necessarily connect low numeracy with low risk aversion rather a tendency to choose at the extremes. This can be costly to moderately risk averse investors, as we observe in Table 7.
4.5 Variations in basic financial literacy
Unlike innumerate subjects, respondents with poor basic financial literacy prefer the bank and 50:50 accounts over the growth account but as basic financial literacy improves, subjects begin to accept more risk (Figure 3) overall. In terms of the estimated model, the main source of this increasing preference for riskier accounts is shifting intercepts. The positive estimates of alternative-specific constants for basic financial literacy scores, αj, 12, cause the odds of the risky account choices to rise as the basic scores rise. However, the coefficient on the interaction between basic literacy and the underlying risk level of the growth account, β j, 3, is negative and works to reduce the demand for risky accounts as risk and basic literacy rises. In other words, respondents who score well in the key components of basic financial literacy (time value of money, compounding and inflation) have a mean tendency to accept riskier investments, but at the same time are more sensitive to changes in risk than respondents who score poorly on the basic literacy score.
A close examination along the rows of Figure 3 shows that choice probabilities change more at the right-hand side than at the left-hand side of each graph. For example, shifting from the first panel to the fourth panel in the bottom row (P9) covers an increase in growth account volatility of 16 percentage points. This large rise in risk causes no significant change in choice probabilities by subjects with low basic literacy, whereas for subjects with high basic literacy, the same increase in volatility means a significant decrease in choices of growth (from 25% to 15% with standard errors below 2%). In other words, respondents with basic literacy scores two or more standard deviations below the mean become insensitive to rising risk, whereas at the same time choosing more conservative accounts overall than their more literate peers. Consequently, individuals with poor basic financial literacy are unlikely to switch to higher yielding growth portfolios even if investment risk declines sharply. If the tendency of those with poor financial literacy to choose safe accounts is due to misunderstanding the risk-return trade offs, rather than because of risk aversion per se, they can end up much worse off. Growth and 50:50 account choices are likely to be optimal for moderately risk averse investors at historically average volatilities, and certainty equivalent wealth penalties of 4%–30% could apply for failing to make the risk-return trade off (Table 7).
Presentation effects are reduced by better basic literacy but not removed. For example, moving from P2 to P9 at 28% risk changes the choice probabilities for bank, 50:50 and growth by an average of 17 percentage points for the lowest basic literacy percentile, but by 5 percentage points for the highest percentile. The changes exceed two standard errors at both the lowest and highest percentiles of basic literacy.
4.6 Variations in sophisticated financial literacy
Figure 4 shows the same analysis holding numeracy and basic financial literacy constant at median scores and allowing sophisticated financial literacy to vary. Improvements in sophisticated financial literacy – knowledge of diversification and the risk and return features of financial assets – is associated with a greater probability of choosing growth and 50:50 accounts. However, unlike the previous two measures of financial competence, risk sensitivity and preference for mixed accounts is relatively constant across different sophisticated financial literacy levels.
We continue to observe many large presentation effects even at high levels of sophisticated financial knowledge although some effects are reduced. In particular, reframing from text to graph creates a significant change in choices at the lowest sophisticated literacy quantile, but not for the highest. Moving from P2 to P9 (reframing range information from text to graph) at 28% risk changes the choice probabilities for bank, 50:50 and growth by an average of 12 percentage points for the lowest sophisticated literacy percentile but only by 4 percentage points for the highest percentile. Changes at the highest sophisticated literacy percentile are smaller than two standard errors.
4.7 Profiles of respondents by investment account choice
Finally, we profile the respondent most likely to select the growth or bank accounts. Setting aside the effects of risk presentation, the probability of choosing the growth account is maximized at 94.4% for a respondent of any age but of maximum wealth, who considers the prospect of another stock market crash within the next 5 years as ‘very unlikely’, who has relatively poor numeracy, but high sophisticated and basic financial literacy and who is making choices at the lowest volatility level for the risky asset. (We count 87 respondents who score below the median for numeracy but above the median for other financial literacy measures, and 150 respondents who score above median for numeracy and below median for the other financial literacy scores.) This respondent has a 5.5% chance of selecting the 50:50 account and his or her probability of choosing the bank account approaches zero. The respondent most likely to choose the bank account is among the 18–24 years age group, the lowest wealth level, is uncertain about the probability of a future stock market crash, and has relatively high numeracy skills but low basic and sophisticated financial literacy. For this profile, the probability of choosing the bank account is 93.2%, with a 6% probability of choosing the 50:50 account and a 0.9% probability of choosing the growth account.
5 Conclusion
This paper presents evidence that retirement savings portfolio decisions in a discrete choice experiment are sensitive to the format used to describe risk. Sensitivity to format changes is most evident when different information about the returns distribution is conveyed but is still substantial even when equivalent information is reframed as a visual image or by textual emphasis on losses or gains. If framing or presentation changes, or financial illiteracy, results in mistakes in investment allocation, simulation experiments indicate that welfare losses at retirement can be very large in certainty equivalent terms, so choice of presentation matters. We summarize the main results in the following points:
-
1. Consistent with expected utility theory, choice probabilities for the risky accounts decrease when investment risk rises: the median subject pays attention to risk information and exhibits risk aversion. However, risk responsiveness declines with basic financial literacy, approaching zero for people with very poor scores. Individuals with poor basic financial literacy are unlikely to switch to higher yielding portfolios even if investment risk declines sharply.
-
2. Choice variation due to risk presentation changes is large compared with underlying investment risk. Switching from a textual range presentation to a graphical range presentation has twice the impact on growth account choices than a 16 percentage points risk reduction. When shown the right and left tail of the returns distribution, most subjects do not infer that a high probability of losses also implies a high probability of gains and they exhibit more caution when shown the lower tail, than recklessness when shown the upper tail. When risk is presented with respect to a benchmark, for example ‘On average, negative returns occur 7 years in every 20,’ portfolio choices are more conservative and sensitive to reframing than when risk is described as the chance of returns falling within a specified range.
-
3. Reframing benchmark presentations as losses or gains does not change risk preferences monotonically to more risk tolerance or avoidance, as often concluded in past studies, but shows up here as a movement toward the 50:50 account from the safe and risky extremes. Reframing from text to graph encourages riskier account choices, but emphasizing the center or tails of the returns range does not change preferences significantly.
-
4. Presentation effects are moderated but not completely removed as numeracy, basic and sophisticated financial literacy improves. Moreover, innumerate respondents choose concentrated portfolios in preference to mixtures. Investment in improved literacy may result in net welfare gains at retirement.
-
5. Age, retirement accumulation and the probability assigned to the prospect of another stock market crisis in the near future significantly predict account choices. Older ages prefer diversified accounts; very wealthy subjects favor risky accounts and optimistic stock market expectations boost risky account choice probabilities at least as much as large underlying risk reductions.
We conclude that retirement fund providers and regulators cannot assume that members digest the risk information provided in standard formats independently of template, background knowledge, expectations and skills. Fund members read investment information in a personal context, interpret textual and graphical information differently and integrate provider information with their own pre-existing opinions. For some people, the provided information is difficult to interpret, incomplete, or relatively unimportant, so they are guided by other factors almost entirely. For the majority, the risk information is significant and influential, but large changes in underlying risk do not change choice probabilities as much as changes in the way that risk is communicated.
Our findings indicate that as governments divest themselves of the responsibility to finance and pay public pensions, they need to pay attention to financial product disclosure requirements and the information provision practices of industry. The results here support the use of ranges of returns with related ‘frequency’ probabilities (e.g., ‘1 in 10’) to describe investment risk. Presenting probable ranges of both losses and gains, while giving investors information about the sizes of likely losses and gains appears to help decision making. This stands against the standard risk measure adopted by the Australian superannuation industry, which uses the frequency/benchmark approach. Although this study did not test the 1–7 scale of risk/return adopted by the European Commission for KIID documents, our findings suggest that the scale may not give enough information about size of possible gains and losses to be really useful to investors. Moreover, while the SEC Summary Prospectus includes text describing types of risk, a past performance graph that gives a visual display of returns and also supplies information about performance against a benchmark, reading and integrating these separate pieces of the risk puzzle is likely to be hard for retail investors.
This choice experiment also identified groups of vulnerable individuals who will probably have trouble understanding risk information in any form. People who are young and/or have poor financial competence may choose investments too conservatively and with too little eye on the rewards to risk-bearing over the long term. For this group, more information is unlikely to help and either advice or good defaults are necessary. Continuing initiatives to improve financial competence alongside ongoing testing of how plan members actually use disclosure information are needed.
Appendix A: Instructions to survey subjects
The Australian Government is concerned about the complexity of superannuation arrangements and is looking for ways of simplifying superannuation investment choices. One possibility is to offer only three investment options for all superannuation accounts. Each investment option has a different expected rate of return (the average rate at which your investment will grow each year), and a different amount of investment risk (year-to-year UPSIDE and DOWNSIDE variation in the return to your investment).
The options are
-
Option A: All (100%) of your superannuation account is invested in a guaranteed bank deposit with a fixed rate of interest paid each year.
-
Option B: Your superannuation account will be divided half and half (50%/50%) between the bank account and growth assets. You can anticipate that savings in this option will grow faster than the bank deposit (Option A), but will grow more slowly and be less risky than only choosing growth assets (Option C).
-
Option C: All (100%) of your superannuation account is invested in assets like shares and property. On average, you can anticipate that savings in this option will grow at a faster rate than in the bank deposit (Option A) but without a guarantee. There is some risk that your account will grow faster or slower than average if you choose this option.
We are going to show you 12 sets of these options for investing your superannuation. Each set includes three investment options like the ones described above. Each investment option has a average rate of return and investment risk. The average rates of return stay the same in each of the twelve sets; only the risk will change. Remember that more risk of high returns also means more risk of low returns.
What we want you to do is simple. There are two questions to ask about each set of options:
-
1. If these superannuation options were available for you to invest your money today, which one of the three would you be most likely to choose?
-
2. If these superannuation options were available for you to invest your money today, which of the three would you be least likely to choose?
Your choices will inform government and industry about better ways to simplify superannuation arrangements.
Appendix B: Variable definitions for mixed logit estimation
-
• Age – mean centerd mid points of response ranges 18–24 years; 25–34 years; 35–44 years; 45–54 years; 55–64 years; 65–74 years; and 75 years and over. Mid point for respondents age 75 and over was set at 79.5.
-
• Retirement savings accumulation – mean centerd and divided by 1000 mid points of response ranges to the question ‘Which of the following ranges best describes the total amount you currently have in all your superannuation accounts in Australia?’; Ranges where: Under $10,000; $10,000–$19,999; $20,000–$39,999; $40,000–$59,999; $60,000–$79,999; $80,000–$99,999; $100,000–$149,999; $150,000–$199,999; $200,000–$299,999; $300,000–$499,999; $500,000–$999,999; $1,000,000–$4,999,999; and $5,000,000 or over. No respondents selected the highest category.
-
• Stockmarket crash ‘Nearly impossible’ – indicator variable for share market recovery question S1 taking value 1 if response was ‘Nearly impossible’, 0 otherwise
-
• Stockmarket crash ‘Very unlikely’ – indicator variable for share market recovery question S1 taking value 1 if response was ‘Very unlikely’, 0 otherwise
-
• Stockmarket crash ‘Unlikely’ – indicator variable for share market recovery question S1 taking value 1 if response was ‘Unlikely’, 0 otherwise
-
• Stockmarket crash ‘Toss up’ – indicator variable for share market recovery question S1 taking value 1 if response was ‘Toss up’, 0 otherwise
-
• Stockmarket crash ‘Likely’ – indicator variable for share market recovery question S1 taking value 1 if response was ‘Likely’, 0 otherwise
-
• Stockmarket crash ‘Don't know/refuse to answer’ – indicator variable for share market recovery question S1 taking value 1 if response was ‘Don't know’ or ‘Refuse to answer’, 0 otherwise; this category served as base category in the estimation with effects-coding of all equity crash indicator variables.
-
• Numeracy index score – mean centred factor weighted responses to answers on numeracy skills questions; coded 1 for correct and 0 for incorrect/‘don't know'/‘refuse to answer’.
-
• Basic financial literacy index score – mean centred factor weighted responses to answers on basic financial literacy skills questions; coded 1 for correct and 0 for incorrect/‘don't know'/‘refuse to answer’.
-
• Sophisticated financial literacy skills index score – mean centred factor weighted responses to answers on sophisticated financial literacy skills questions; coded 1 for correct and 0 for incorrect/‘don't know'/‘refuse to answer’.
-
• P1 – indicator variable taking value 1 if risk presentation format showed returns between 5 and 95 percentiles.
-
• P2 – indicator variable taking value 1 if risk presentation format showed returns outside 5 and 95 percentiles.
-
• P3 – indicator variable taking value 1 if risk presentation format showed returns above 95 percentile.
-
• P4 – indicator variable taking value 1 if risk presentation format showed returns below 5 percentile.
-
• P5 – indicator variable taking value 1 if risk presentation format showed expected years in 20 with returns above 0.
-
• P6 – indicator variable taking value 1 if risk presentation format showed expected years in 20 with returns below 0.
-
• P7 – indicator variable taking value 1 if risk presentation format showed expected years in 20 with returns above bank.
-
• P8 – indicator variable taking value 1 if risk presentation format showed expected years in 20 with returns below bank.
-
• P9 – indicator variable taking value 1 if risk presentation format showed range graph of 5 and 95 percentiles; this category served as base category in the estimation with effects-coding of all frame indicator variables.
-
• Investment risk – mean-centered risk levels of alternatives.


