1 Introduction
The aging process we are witnessing in most developed countries poses an important challenge for the future pension systems, especially in those countries with unfunded systems. On the one hand, aging implies a future increase of the expenditure on pension and on the other hand, a slowing down in the future growth of the labor supply and, consequently, of the future revenues of the system. The final result, if the appropriate reforms are not taken, will be a financial imbalance difficult to be withstood.
The different European countries have already started, with varied intensities, some reforms oriented toward the restraint of the increasing expenditure level on pensions. One of these reforms is the change of the legal retirement age. So far, only Germany, Denmark and the United Kingdom have modified that age. In Germany and Denmark, the legal age has been risen from the current 65 to 67 and in the United Kingdom up to 68. Ireland has also made a slight change from 65 to 66.
The second line of reforms is addressed to modify the parameters used to compute the pension with the aim of reducing the replacement rateFootnote 1 at given retirement ages. This decrease can be obtained, for example, by computing all the working life in the calculation of pensions or introducing demographic adjustment factors that take into account the increase of life expectancy. Germany, Sweden and Portugal have already introduced both measures, whereas countries such as Austria, France or Finland have only introduced, at present, the demographic adjustment factor.
One of the problems of the parametric-like reforms is the calculation of their intensity. The intensity of reforms can be related, on the one hand, to the final objective that they aim at, that is to say, the elimination of financial imbalances of pension systems. But it must also be kept in mind the effects they may have on the welfare of retired population. Pension systems have been a powerful instrument to eliminate poverty situations among the elderly (Sainsbury and Morissens, Reference Sainsbury and Morissens2002; Engelhardt and Grubert, Reference Engelhardt and Gruber2004; Nelson, Reference Nelson2004; Dang et al. Reference Dang, Immervoll, Mantovani, Orsini and Sutherland2006). In most European countries, these systems have offered further benefit, providing this group of population with access to some consumption levels that are well over the standards corresponding to their poverty threshold. Therefore, the different parametric reforms should go along with predictions about the impact they may have on the welfare of the retired population. These predictions would provide the policy-maker with relevant information to select the most suitable combination of reform measures to, on the one hand, ensure the financial balance of the future system and, on the other hand, keep on providing retired people with access to socially acceptable consumption levels.
Nevertheless, there is not much research studying the effects of pension reforms on the welfare of retired people. Butrica et al. (Reference Butrica, Smith and Steuerle2006) reveal, taking United States as a case study, that the working life extension would be the most suitable reform, since it would increase the welfare of population at older ages, measured in terms of annual consumption increase. However, Lachance (Reference Lachance2008), by using a life-cycle model, states that this welfare improvement could be lower than estimated if we take into account the cost induced by the working life extension, in terms of less leisure. Gonand and Legros (Reference Gonand and Legros2009), by using a dynamic general equilibrium model, present different simulations with different combinations of parametric reforms, oriented to balance the pension system in France. In the first scenario, the replacement rate is kept constant and the effective retirement age is delayed. The conclusion is that welfare, measured as a variation of poverty rates, would not be affected. In the second scenario, where retirement age is constant and the computed years for pension calculation are raised, which is equivalent to a reduction in the replacement rate, poverty rate among this population group increases considerably. Other researches (Pfau, Reference Pfau2006; Sutherland et al. Reference Sutherland, Hancock, Hills and Zantomio2008) show the effects different indexes of pension updating have on welfare, also measured as a change in the poverty rate of retired population.
The objective of this paper is to go more deeply into the knowledge of these effects taking the Spanish Social Security system as a case study. The need to reform the system is relatively urgent, since the aging process that the Spanish population will go through in the following years is one of the most intense of the European UnionFootnote 2. So it seems appropriate to try to predict the effects some of the reforms that are being considered at the moment may have on the individual welfare of the future retired citizens. More specifically, we are interested in estimating the effects that an increase in the retirement age and an increase in the number of years included for the computation of pension may have on such welfare. These are the two measures recently announced by the Spanish government to correct the future imbalances of the system.
We estimate these effects assuming that the reforms are implemented at present. The financial problems of the system, however, will not take place in the immediate future. The last estimates about the financial imbalance of the social security system consider that the deficit could take place, depending on the assumptions made, at the beginning of the 2030s or in the second half of the 2020s (de la Fuente and Doménech, Reference De la Fuente and Doménech2009; Herce et al. Reference Herce San Miguel2009; Serrano et al. Reference Serrano, Eguía and Ferreiro2011). The social problems related to the reform of the social security system could delay the reform until the moment the financial imbalances break out. In this scenario, the intensity of the reforms would be higher than if they were implemented at the present time. Herce et al. (Reference Herce San Miguel2009) consider that for the year 2050 the equilibrium average pension would be 41.77 points lower than the current one. De la Fuente and Doménech (Reference De la Fuente and Doménech2009), in their most optimistic scenario, consider that for the period 2007–60, the equilibrium average replacement rate should be equal to 49.51%, 30 points lower than the current one. In Serrano et al. (Reference Serrano, Eguía and Ferreiro2011) it is estimated that the generosity of the system (measured as the taxable average earnings over the average pension) should diminish from the current 0.64 to 0.369 for the year 2050. In this paper we also estimate the welfare effects of these changes.
In order to make some progress in these objectives, we estimate two duration models. The first model is a non-parametric estimate that evaluates the welfare the current Spanish pension system provides to retired population. The second model is a parametric estimate with which we will measure the effects of such mentioned reforms, as well as the effects of their delay, have on the individual welfare of retired population.
The methodology we propose complements, from a dynamic perspective, the information provided by the traditional indicator that is used to measure the generosity of a social security system: replacement rate. This is a static indicator that does not gather information about the future individual welfare of retired citizens. With the duration model we propose, we can research on the evolution of this welfare, for a given replacement rate.
This paper shows some methodological novelties regarding the researches mentioned above, which improve the understanding of the effects of reforms.
A first novelty is it is an empirical research. We used micro data to research on the effects of reforms. The results we obtained, thus, can be used as inputs to design models where there are other variables (different from pensions) that also have an influence on the retired population welfare. A second novelty is the welfare measurement we made is not static. Our methodology allows observing the evolution of that welfare over time, since the moment the individual enters the system as a pensioner. A third novelty is that we consider all variables determining the pension as a whole, which allows us to realize the causal impact each of them has on the individual welfare of pensioners.
The paper is structured as follows. In the following epigraph, we introduce the database that we have worked with, as well as the methodology. Later, we present the results of the different estimates carried out and finally, we include a discussion and state the main conclusions obtained.
2 Data and methodology
2.1 Data source
The results shown in the following part have been obtained from the Muestra Continua de Vidas Laborales (MCVL) drawn up each year by the Spanish Ministry of Immigration and Social Security.
This sample, which has been put together each year since 2004, provides information about the working life of 1,170,000 pensioners and employed workersFootnote 3. This statistical source enables two analyses to be carried out from a methodological standpoint. On the one hand, and by comparing the results obtained in each of the reference years, a global overview may be obtained of the evolution of the system in its different components. On the other hand, the data it provides for each year reflect a panel for each pensioner that appears in the sample in that year, as we have records at our disposal about the nature of their relationship with Social Security since 1996.
The analysis has been implemented using the information of the year 2007 for the standard pensionersFootnote 4. To capture the time dimension of the pension evolution, these data have been expanded according to the pension formula used by the Spanish Social Security System up to the year in which the pension was recognized, this is the year in which the pensioner entered the system. As a consequence, we have worked with an unbalanced, right censored panel data which starts in the year 1996 and finishes in the year 2007, but in the survey there are pensioners whose first relation with the system was in 1986. The panel, thus, covers the period 1986–2007. Each pensioner enters the panel the year when the corresponding pension is recognized and continues until the end of the period, 2007. After debugging the database the total amount of individuals included in the study is 40,842.
2.2 Welfare definition
We define welfare of a pensioner as that situation where he/she is not poor. As an indicator of poverty situations we use the standard criterion proposed by the European Union, that is to say, 60% of the median equivalised incomeFootnote 5. Therefore, the social security system ensures a positive individual welfare as long as it provides an income flow (pension) that allows different individuals to keep their standards above the level of the poverty thresholdFootnote 6.
2.3 The determinants of welfare
In a pay-as-you-go system the income individuals receive is a function of the regulations that govern the right to a pension and of the working life of each individual. In Spanish's Social Security model, the pension is the result of applying a coefficient related to the number of years worked by each pensioner to the personal Regulatory Base.
The Regulatory Base is obtained in accordance with the following expression (1). TAEi refers to the taxable average earnings of the ith month prior to becoming retired and CPIi is the consumer price index. From the ith month to the beginning of retirement:
The coefficient varies between 0.5 and 1 depending on the years the pensioner has contributed to the Social Security System. The minimum value (0.5) is applied to the people with a 15-year record. This coefficient rises until it reaches its maximum for those who have contributed 35 years.
Additionally, with the ultimate goal of maintaining the purchasing power provided by the initial pension, every year pensions are brought up to date according to the evolution of the consumer price index (CPI).
Although the legal retirement age is 65, Spanish legislation permits the population to retire from the age of 61. These early retirements are, though, penalized. For each year between 61 and 65, people who opt to retire are penalized with a yearly reduction of 8% above the pension that would correspond to them. The law also permits extending the working age above the legal retirement age for those people who have not been contributing for 35 years when they reach the age of 65. In any case, the limit age for this time extension is 70. As a consequence of this legislation, the effective retirement age varies between 61 and 70 inclusive, though the average effective retirement age in the Spanish system is 64.
Therefore, the total pension received is a function of the ‘regulatory base’, the ‘contribution spell’, the ‘effective retirement age’ and of the ‘reassessment’ associated with the pension each year. These are the variables of our model.
2.4 The model
We implement a duration analysis with which we estimate the welfare of the retired population during the time they are members of the system as pension recipientsFootnote 7. We have opted for an analysis of these characteristics so that we can see the changes that take place in such welfare as the pension ‘gets older’. For example, a person may not be poor with the income provided by the system for a certain number of years. Yet, this individual may later fall into poverty due to the ‘aging of his or her pensions’. ‘The pension aging’ occurs because pensions are updated depending on the evolution of the CPI, whereas the poverty threshold we used to make reference to the welfare also evolves depending on the changes of productivity. This model, thus, permits us to understand the evolution of the probability of pensioners to fall below the poverty line. In other words, it allows us to observe the evolution of pensioners' welfare from the very moment they start to receive their pension.
The empirical analysis is implemented in two steps.
For the first of the objectives pointed out in the introduction, that is, to have an overview of the welfare provided by the system to retired population, we implement non-parametric estimates of the hazard rate in terms of the Nelson–AalenFootnote 8 cumulative hazard function. The cumulative hazard function measures the total amount of risk that has been accumulated up to time t. The estimator proposed by Nelson and Aalen can be described as in expression (2). Where nj is the number at risk at time tj, dj is the number of failures at time tj, and the sum is over all distinct failure times less than or equal to t.
The function is estimated upon the whole universe of individuals, without considering the personal characteristics of each of them.
So as to estimate the effect that different parametric reforms might have on retired population welfare, though, it is necessary to know how the different personal characteristics reflected on the variable that determines the pension influence on this welfare. In order to understand the hazard rate conditioned to the specific pension determinants, we secondly implement a proportional hazard parametric maximum likelihood estimateFootnote 9. The estimate is made in discrete time and it is assumed that a complementary log–logistic functional shapeFootnote 10 of the hazard, as proposed by Jenkins (Reference Jenkins2009) . The attractive feature of this distribution is that the hazard function is non-monotonic, as happens with other distributions such as exponential, Weibull or Gompertz, commonly used in the literature.
Assuming a Gaussian error component, estimates are controlled by the presence of individual unobserved heterogeneity, which could arise from the absence of some other important information regarding the pensioner, such as personal characteristics, which has not been gathered by pension's determinants. This control is particularly important since it prevents estimates from being biased (Lancaster, Reference Lancaster1990). The time-varying covariates included are external in the sense of Kalbfleisch and Prentice (Reference Kalbleisch and Prentice2002) since the complete path of pensioner's pension components are determined for the whole period analyzed regardless of whether the pensioner has entered poverty or not. Such covariates enable us to answer how differences in pension components alter the probabilities of entering poverty. This hazard function can be written as in expression (3):
where h[t;X(t)] is the hazard function, D(t) represents the theoretical baseline hazard functionFootnote 11 as the logarithm of time, X(t) is a matrix that includes the covariates plus an intercept and u is the error term with zero meanFootnote 12. In Table 1 we provide details on all variables.
Table 1. Covariates’ description

Finally, from the results obtained in the parametric estimates, we can calculate the effect that several policy reformsFootnote 13 would generate on the individual welfare of the retired population. In order to advance in this aim, we will differentiate five different scenarios. The first of the scenarios, which we will call baseline, will serve as a reference to measure the effect that each reform measure might have on the pensioner's individual welfare. In the second scenario, we will call Case I, we evaluate the impact of 2 years’ increase in the effective retirement age upon this welfare. In the third scenario (Case II), we assess the impact of a 4% decrease on the regulatory baseFootnote 14. In the fourth scenario, we will call Case III, we show the combined effect of the two measures before: an increase in the effective retirement age and a decrease of the regulatory base. Finally, in Case IV, we show the welfare effects that would take place if the reforms were delayed. We have estimated the welfare effect for the future generations of two alternative reductions (40 and 50%) of the average pensionFootnote 15.
We will measure the change of the individual welfare (resulting from the different studied reforms) as the increase or decrease that the selected variable generates with regard to the individual welfare existing in the baseline case. In econometric terms, this change is measured as the percentage variation on the cumulative hazard function generated by the variation in the selected variable. The estimates of the cumulative hazard function have been computed as 1 minus the corresponding estimates of the Survivor function where the survivor function estimates ![]() have been implemented according to the expression (4) as proposed by Jenkins (Reference Jenkins2009) :
have been implemented according to the expression (4) as proposed by Jenkins (Reference Jenkins2009) :
As this percentage variation depends on the effect of the reforms on the hazard we will also present the value of the associated hazards ratios. Since we are working in a time-varying framework (some covariates change each time period) the hazard ratios concerning such type of covariates change each time the time-varying covariate changes. For this reason, and to make interpretation easier, the reported results show the average hazard ratio for the whole period analyzed; this is the average over the hazard ratios of the period as in expression (5). hrj refers to the hazard ratio corresponding to covariate, j, ![]() refers to the hazard estimates value corresponding to the covariate,
refers to the hazard estimates value corresponding to the covariate, ![]() represents the baseline hazardFootnote 16 estimates and T is the total number of periods studied:
represents the baseline hazardFootnote 16 estimates and T is the total number of periods studied:
Changes in welfare, though, will be measured from the information provided by the cumulative hazard function.
3 Results
3.1 Non-parametric model
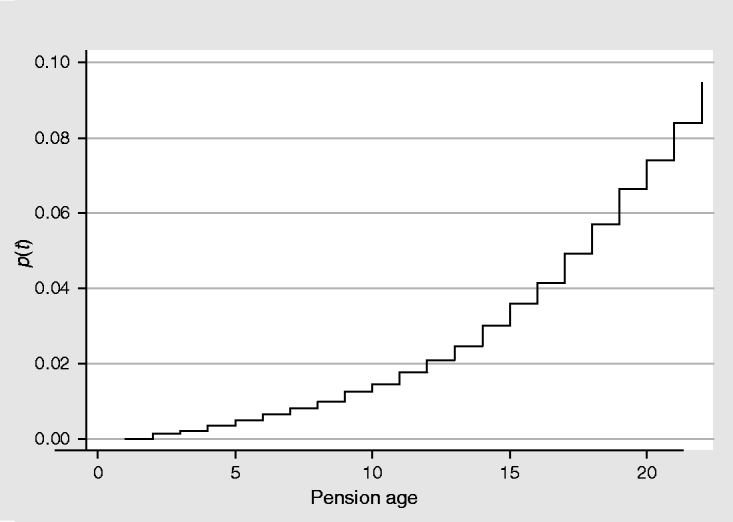
In Figure 1, we show the Nelson–Aalen cumulative hazard function estimates for the current system. Initially, that is, the year individuals enter the system as pensioners, the likelihood associated with the system of leaving people in poverty situations is lower than 1% (0.0035). From that moment on, as the function reflects it, the likelihood increases as times goes by, though it keeps on presenting low values. Thus, the likelihood takes value 0.01 in the eighth year. After 22 years, this likelihood rises up to 9.46% (0.0946). After 15 years, the estimated average time to draw the pension for the median pensioner (see note 17 for the characteristics of this pensioner), this likelihood reaches a 3.6% (0.036).
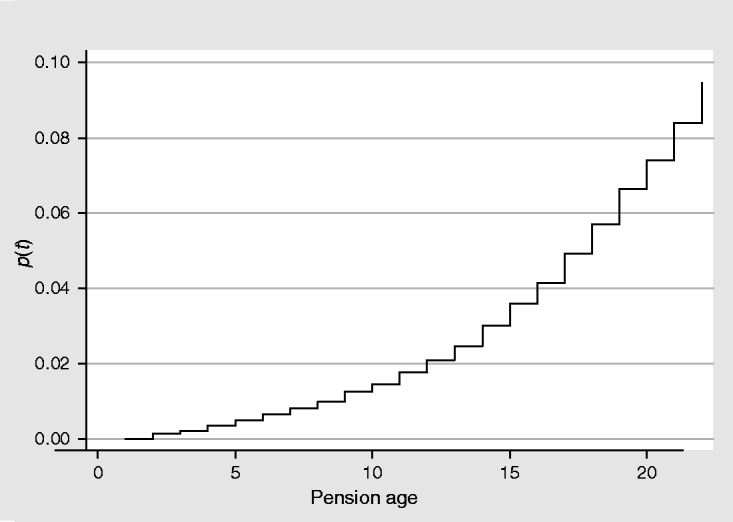
Figure 1. Nelson–Aalen cumulative hazard estimates.
In the light of these results, it seems logical to conclude that the Spanish retirement pension system ensures a level of life above the poverty threshold for most pensioners during all those years they have received that pension.
3.2 Parametric model
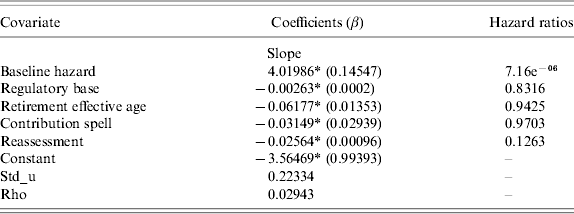
The results from the parametric estimates are reported in Table 2. The first column reports the estimates of the coefficients and the second column the hazard ratios with respect to the baseline hazard. At the bottom of Table 2, we provide the values for the standard deviation of the heterogeneity variance (Std_u) and the ratio of the heterogeneity variance to one plus the heterogeneity variance (rho). As it can be derived, the likelihood ratio test suggests statistically significant frailty.
Table 2. Results from parametric estimates

* Significant at 1%.
As it can be observed from the estimates of the coefficients, the positive sign of the slope of the baseline hazard reveals the existence of positive duration dependence; this is, the likelihood to enter a poverty situation grows as times goes by. Regarding the covariates included in the model, all of them reduce the hazard (all of them affect negatively in the probability that the pensioner falls below the poverty line). As a consequence, an increase in the ‘regulatory base’ would induce a decrease of the hazard and, inversely, a decrease in the ‘regulatory base’ would generate an increase of the hazard. Similarly, an increase in the ‘retirement effective age’ of the pensioner would reduce the hazard. An increase in the number of years the pensioner has been contributing to the system (‘contribution spell’) would also reduce the hazard faced. ‘Reassessment’ variable, which contains the pension updating, works in the same direction.
Coefficients, though, only provide partial information on the magnitude with which each covariate affects the probability of entering poverty, that is, the measurement of the effect that each covariate has on hazard estimates. The measurement of the effect on the hazard of the different covariates must be done in terms of hazard ratios; that is, in terms of the increase or decrease caused by a variation of the covariate on the baseline hazard.
The baseline hazard estimates are reported in the second column first row of Table 2. The hazard ratios related to each variable are also reported in the second column of Table 2. A covariate that does not change the baseline hazard at all would present a value equal to 1. This value would be higher than 1 for those covariates that increase the hazard and lower than 1 for those which decrease it. As it can be observed, and as it was inferred from the sign of coefficients, all variables show a hazard ratio lower than 1. A 1% increase in the ‘regulatory base’ generates a 17% diminution of the hazard, as the value 0.83 reveals. When the pensioner retires being one year older, the hazard decreases by 6%, as it is revealed by the hazard value for the variable ‘retirement effective age’. One more year of contribution to the social security (‘contribution spell’ variable) reduces the hazard by 3%. Finally, a 1% increase in the reassessment applied each year induces a diminution of the hazard equal to 87%.
3.3 Policy reforms
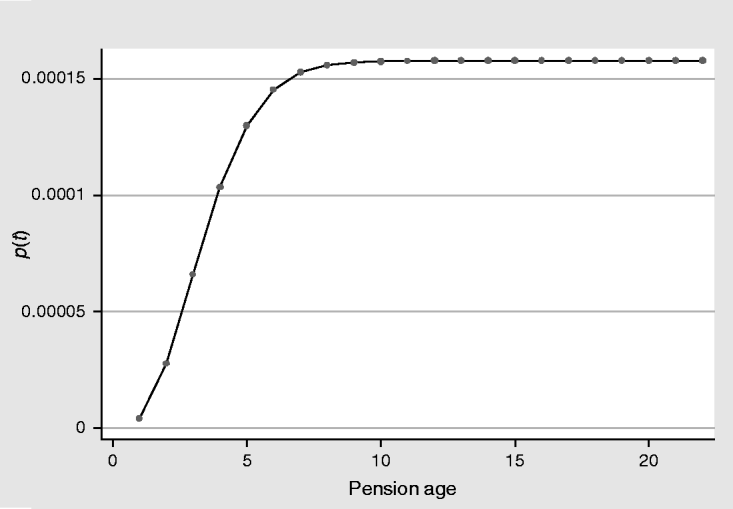
Figure 2 shows the predicted cumulative baseline hazard. From the baseline case we must conclude that the probability to be poor is very close to zero for the whole period. However, as Figure 2 shows, this likelihood gradually increases from year zero to year nine, and, after the year 10, it stabilizes at 0.015%.
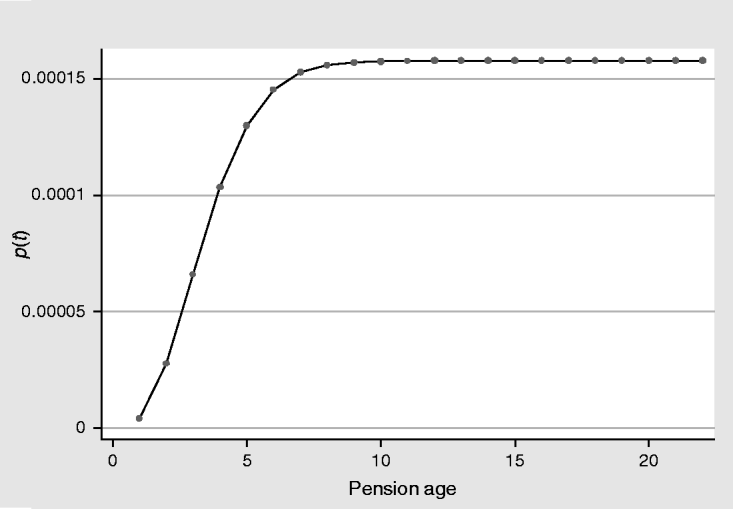
Figure 2. Baseline.
Table 3 reports the hazard ratios estimates for the different policy reforms. The corresponding cumulative hazard functions are represented in Figures 3–5.

Figure 3. Case I.
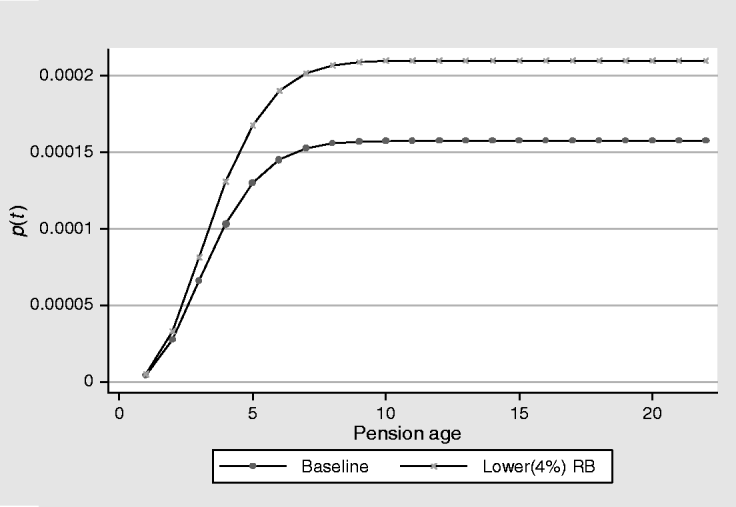
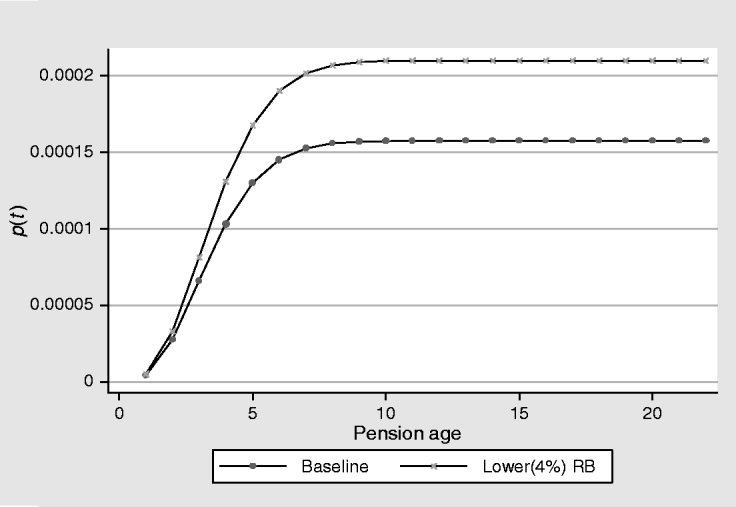
Figure 4. Case II.

Figure 5. Case III.
Table 3. Effects of the policy reforms on the hazard rate

Note: The hazard ratio is defined as the ratio between the corresponding hazard rate and the baseline hazard rate. The hazard ratios in the table have been computed as the mean of the corresponding hazard ratios of the whole period.
* This value corresponds to a 40% reduction.
** This value corresponds to a 50% reduction.
3.4 Case I: Effective retirement age delay
A two-year increase on the ‘retirement effective age’ at which the pensioner starts drawing a pension benefit decreases the hazard ratio by about 12%Footnote 17, as it can be seen in Table 3. As Figure 3 shows, this reduction in the hazard ratio generates a reduction of the cumulative hazard function equal to 12%. The rise in the welfare (measured as the difference between the two functions) keeps on increasing up to the 10th year and then, as it happens to the baseline case, it remains constant. In conclusion, a policy reform concerning a two-year delay of the ‘effective retirement age’ would induce a 12% increase of the welfare.
3.5 Case II: Regulatory base reduction
As Table 3 shows, a 4% reduction of the ‘regulatory base’ generates an increase of the hazard equal to 134%Footnote 18 (as the hazard ratio value 2.34 reveals). Figure 4 shows what this effect implies in terms of the cumulative hazard function.
At the beginning of the period, when the pension has been newly recognized, the difference of the cumulative hazard function with respect to the baseline case is almost imperceptible. As time passes, this difference increases up to year nine when it becomes stable at 33%. In other words, the system would increase at 33% (9 years after receiving the pension) the likelihood to be poor with regard to the present situation. In terms of welfare, after nine years drawing a pension, the welfare would be reduced by 33% with respect to the baseline case's welfare and this welfare reduction would prevail until the end of the period.
3.6 Case III: Effective retirement age delay and regulatory base reduction
A policy reform consisting of a simultaneous two-year increase in the ‘effective retirement age’ and 4% reduction in the ‘regulatory base’ raises the hazard ratio up to 2.08 (see Table 3). As Figure 5 shows, this 108% increase in the hazard is materialized in an initial 1% increase in the cumulative hazard the first year the pension is drawn which increases up to 9% the third year and finally, up to 18% for the ninth year. After the year 10, the difference stabilizes at 18%.
3.7 Case IV: Delay on the reforms
If the reforms required to balance the system were not implemented at the present time, the near-future generations of pensioners would not withstood any welfare lost. However, for the generations of the pensioners who enter the system once financial imbalance appears the welfare lost would be higher than the welfare lost shown in the previous cases. This delay raises the hazard ratio up to values between 4.29e05 and 1.92e07 (see Table 3). As Figure 6 shows a 40% reduction of the average pension multiplies the cumulative hazard (in the first year) by 3.69 times. This difference increases during the whole life of the pension as time passes. In the last period the cumulative hazard is equal to 23.65 times the baseline one. For a 50% reduction, these values are, respectively, equal to 5.29 and 66.49 times. In terms of welfare, the welfare of the pensioners affected by the delay of the reforms would be between 3.69 and 66.49 times lower than the welfare they enjoy at the present time.

Figure 6. Case IV.
In conclusion, a policy reform consisting of increasing the ‘effective retirement age’ in two years and reducing the ‘regulatory base’ a 4% would cause, after nine years drawing a pension, an 18% increase of the probability of being poor. In other words, after drawing a pension for nine years, the welfare would be reduced by 18% as a consequence of the policy combination implemented, and this welfare reduction would be maintained until the end of the pensioner's lifeFootnote 19. From the result obtained, we can conclude that an extension of the effective retirement age would be the most suitable reform to be implemented to harmonize the financial imbalance with the maintenance of the welfare of retired population. This conclusion is similar to the one drawn by Butrica et al. (Reference Butrica, Smith and Steuerle2006) and Gonand and Legros (Reference Gonand and Legros2009) . A reform exclusively focused on the increase of years computed for the pension calculation, that is to say, a decrease in the replacement rate, would bring about the most harmful effects in terms of welfare of retired population. This result is also similar to the one presented by Gonand and Legros (Reference Gonand and Legros2009) .
The measures put forward by the Spanish administration (a 2-year increase in the retirement age and an increase of 5 computed years for the pension calculation) have a final negative effect on the individual welfare of retired population. This is due to the fact that the negative effect on the welfare generated by the reduction in the replacement rate is higher than the positive effect associated with the increase of the effective retirement age.
A delay on the reforms will induce more intense reductions in the average pension and, consequently, for the affected generations of pensioners raises the probability to be poor relatively to both, the baseline and the different estimated scenarios of reform.
4 Discussion
In order to correctly interpret the results obtained, we must point out the limits of our analysis. Our starting point is that the Spanish pension system, in a relatively short future, will face a problem of financial imbalance if the necessary policy reform measures are not taken. The estimation approach followed in this paper, which differs from the simulation approaches more commonly used in the literature, allows to reach our final goal, this is to estimate the intensity of the effects that the parametric-like reforms proposed by the Spanish government would have on the welfare of the future cohorts of retired people and no reform in the present time.
The results obtained rest under the assumption that all the adjustment needed to reestablish the financial balance of the system is withstood by the retired population. This is the central idea over which the proposal of the government rests and, in general, over which the related existing literature rests. An alternative reform could displace part of the welfare cost to the active population by means of an increase of their contribution rate to the system. In this case, the effect of the reforms on the welfare of the retired population would be lower since part of the welfare lost would be withstood by the contributors. A reform scenario of these characteristics should also include, apart from the estimates of the effects on the welfare of the retired population, the estimates of the effects on the welfare of this active population.
The model proposed in the paper has not been designed to simulate the conditions that would warrantee the financial equilibrium of the system. We accept that the reforms proposed by the government are sufficient to warrantee such equilibrium. If, finally, these strategies prove not to be sufficient and an additional reform would be needed, the welfare lost of the population would be assumingly higher than the one predicted in the analysis. The scenario in which the reforms are delayed over time shows the potential welfare lost if more restrictive reforms were needed.
Finally, it is convenient to remark that the welfare lost estimated does not necessarily mean that the poverty rates among the retired population increase. The analysis implemented in this paper uses the poverty line as a mean to identify welfare; this is a threshold to measure the effects of the reforms. As a matter of fact, in Spain, according to the Spanish Survey of Household Finances (EFF) 2005, the pension benefit represents 64% of the total income of the retired people. Additionally, 80.6% of the pensioners own a household. The household represent 73% of the real assets (57% of the total assets) for this population groupFootnote 20. As this data proves, a research aimed at analyzing the implications of the reforms on the poverty situation of the elderly people should also consider, apart from the retirement income provided by the system, other factors such as the additional sources of wealth enjoyed by the population group studied.
5 Conclusions
The aim of this paper is to analyze the effects of the different parametric reforms, oriented to reach the financial balance of public pension systems, on the individual retired population welfare. The study has been carried out by implementing two duration analyses. These analyses allow to study the evolution of this welfare over time and, consequently, to measure the dynamic effect of the different parametric reforms. Taking the Spanish pension system and the reforms announced by the Spanish government as a case study, the results obtained allow us to conclude: (i) currently, the system has a 3.6% probability of leading retired population to a poverty situation, 15 years after they begin to receive their pension; (ii) a 2-year extension of the effective retirement age has positive effects on the individual welfare of retired population; (iii) an increase in the number of years computed for the pension calculation decreases the welfare, since it would increase (after nine years drawing the pension) the probability to be poor with regard to the present situation by 33%; (iv) a combination of these two measures also decreases the welfare (although at a lower rate), increasing (after nine years drawing the pension) the probability to be poor with respect to the current situation by 18%; (v) a delay on the reforms do not affect the welfare of the near-future generation of pensioners, but would imply the highest welfare losses for the future pensioners who withstood all the reform. The poverty dynamics for these losers would vary (in the most optimistic scenario) from being between 2.69 (for the initial period) to 23.65 times higher (for the final period) than the one at the present time.


