


1. Introduction
The preference for the dominated alternative between two types of personal pension plans (PPPs) is a decade-long puzzle in the Italian private pension system, which includes also occupational schemes (Fondi pensioni chiusi or FPNs); for a recent overview see Ricci and Caratelli (Reference Ricci and Caratelli2017).
‘New’ Personal Investment Plans (PIPs), a type of PPPs introduced in 2007 and sold only by insurance companies, are much more widely subscribed than the alternative open pension funds (FPAs), offered by insurance companies as well as by banks and bank controlled management saving companies. The increase of PIPs between 2007 and 2018 was times the corresponding value for FPAs; the ratio was 4.3 times between 2010 and 2014, the period of our econometric investigation (Table 1)Footnote 1.
Table 1. Subscriptionsa and subscribersb (in italics, years 2016 and 2017) to the Private Pension System (end-year data, thousands)c

Source: COVIP (2018).
a Data on subscriptions may include double counting referred to members enrolled in more than one pension fund.
b Data on subscribers in only one pension scheme available only since 2016 (see Online Appendix).
c Data including also subscriptions with no contributions in the reference year.
d Source: Poste Italiane (various years).
e ‘Old’ PIPs and other types of pension funds included.
The share of individual subscriptions accounted for about 85% of FPAs at end-2017; the share was equal to 72% among dependent workers (COVIP, 2018). Subscriptions (only individually allowed) for PIPs were over three fifths for dependent workers, about one fifth each for self-employed and for others.
PIPs' averaged annual net returns were however consistently lower (Table 2). Moreover, PIPs' Synthetic Cost Indicator (SCI), estimated by the Supervisory Pension Authority (COVIP) as a percent of the accrued capital, was also consistently higher (Table 3)Footnote 2.
Table 2. PPPs and sub-funds by investment – compound net annual return rates (end-year percentages)

Source: COVIP (2015, 2018). Return rates are net of management fees and of the substitute tax.
Table 3. Personal Pension Plans

Source: COVIP (2018). SCI computed as simple average for each sub-fund.
SCI by investment sub-funds over different investment periods (annual average percent of the accrued capital)
In an international comparison of costs for PPPs carried out by the International Organization of Securities Commissions, PIPs' costs (as a per cent of assets), already the highest in 2014, rose further in 2017; the differential between PIPs and FPAs increased as well (Han and Stańko, Reference Han and Stańko2018, Table 2). PPPs' costs increased between 2014 and 2017 only in three other countries – Hungary, Poland and RomaniaFootnote 3.
The preference for dominated PIPs is an example of investment mistakes of households paying in excess for some services. The topic of investment mistakes is central to the field of household finance (Campbell, Reference Campbell2006). Interestingly, however, they are detected mostly among poorer and less educated households. The case investigated in this study refers instead to wealthier households, who voluntarily supplement their public pension entitlements. My suggested explanation for such an investment mistake is that it is at least partly a structural supply factor, namely the PPPs' geographical market structure skewed towards PIPs. This paper contributes therefore to the smaller but increasing literature on investment mistakes tied to supply side factors (Foà et al., Reference Foà, Gambacorta, Guiso and Mistrulli2015 for Italy; Gurun et al., Reference Gurun, Matvos and Seru2016 for the US; Argyle et al., Reference Argyle, Nadauld and Palmer2017 for the US; Hastings et al., Reference Hastings, Madrian and Skimmyhorn2017 for Mexico; Iscenko, Reference Iscenko2018 for the UK).
PIPs are an insurance-based product, with individual subscriptions, marketed only by insurance companies, though possibly controlled by banking groups, and by their financial agents. In a highly concentrated market (95% of subscriptions' share for the top 10 providers as of 2017) Poste Vita, a subsidiary of the state-controlled Post Office, with 943,000 PIPs (more than 2.6 times the 2010 figure) and a market share of about 30%, ranks second after the 38% share of the Generali group (Itinerari Previdenziali 2018). The proprietary products are marketed through a countrywide network of post offices. The coverage rate of municipalities of 13,000 (14,000 in 2010) post offices in 2017 ranges from 93% to 100% in different regions. A state-controlled Post Office has a cross-selling strength compared to private providers when competing with similar financial products, as in the case of PIPs. Bank deposits are guaranteed up to 100,000 euro per depositor by a private national deposit insurance fund; postal deposits are instead fully guaranteed by the State, as advertised in all ATMs outside the post offices. The (moral hazard based) subliminal message on being Post Office state-controlled is likely to be extended to other financial products.
The market structure for FPAs, with both individual and collective subscriptions for private employees and access that can be linked to employment and professional activities, is instead open to the competition among various financial providers: private insurance companies (with a market share larger than a half), bank controlled management saving companies (about two fifths of the market) and banks (only Intesa San Paolo, in fact, as of 2017). Among the top 10 players (with a subscriptions' share of about 80%), Intesa San Paolo is first (37.2%) and the bank-controlled asset management group ARCA is second (27.4%), whereas Generali is fourth (5.6%). Five financial groups appear in the top 10 in both rankings (Generali, Axa, Intesa San Paolo, Allianz, Unipol).
As a way of comparison with the stable municipality coverage rate of post offices, bank-served municipalities shrank between 2010 and 2014 from 5,905 in 2010 to 5,750 in 2014 (compared to a grand total of 7,900 municipalities, with a coverage rate of 75%); bank branches decreased by almost 9%. Understandably, municipalities without a bank are the smaller ones. To provide a simple indicator, the ratio between the shares of bank branches and of inhabitants in the six largest cities (more than 500,000 inhabitants) rose from 1.3 to 1.5 between 2010 and 2014.
Insurance agents reduction to 25,550 as of 2014 (3,300 less than in 2009) was only partially offset by an increase from 3,000 to 4,000 for brokers, with a geographical distribution skewed toward the two regions with the largest cities, Milan and Rome.
The geographical market structure for PIPs and FPAs matters especially when investment choices cannot be delegated to employers or bodies able to vet financial providers and to negotiate better contractual terms.
The cost differential between PIPs and FPAs incorporates in fact a fee differential that is likely to induce financial promoters to nudge investors towards higher fee-generating PIPs. A study on life insurance agents in India, who are largely commission motivated, finds that agents recommend products with higher commissions even if the product is suboptimal for the customer (Anagol et al., Reference Anagol, Cole and Sarkar2012).
This study aims to provide empirical content to COVIP's hints on the role of aggressive selling policies as possible explanations for the preference for PIPs over FPAs (COVIP Reference Disney, Gatherhood and Weber2011, 55; 2015, 23; 2016, 43). Unfortunately, there is only anecdotal evidence on potential conflicts of interest, except for the implications of aggregate SCI statistics. The main focus in the econometric investigation is therefore on the geographical market structure for PPPs, under the assumption that it allows implementing selling practices skewed toward PIPs. Given the data constraints in the Bank of Italy's Survey of Household Income and Wealth (SHIW), I proxy the geographical market structure for PPPs with the size of the cities where households reside. However, in interpreting the findings relative to the force sales factor, I take into account also the fee-related incentives pertaining to private financial providers.
Financially literate individuals should be able to gather information on realised net returns and perspective costs of the two alternative PPPs and look through the advisers' and sellers' incentives. The sales force factor should therefore be countervailed to some extent, the more so if the investors' attention is heightened by a salient event, such as an unexpected public pension reform, hurriedly legislated in December 2011 to defuse a confidence crisis in sovereign debt.
In the empirical investigation I rely on the three biennial SHIW waves between 2010 and 2014. The waves from the balanced panel are used to explore the role of financial literacy (FL) levels computed from the answers to a module available only in the 2010 SHIW.
To anticipate the results, the main findings are three.
First, there is evidence of a strong and persistent explanatory power of the sales force factor, whereby the probability of preferring PIPs to FPAs, conditional on the participation to the PPP market, is negatively correlated with the size of the city where respondent household heads (HHs) reside.
Second, the salience effect on the awareness of the benefits of supplementing lower perspective public pensions strengthened between 2012 and 2014 the role of financial strength indicators, self-reported saving capability and ownership of the risky asset, as explanatory variables of the probability of subscribing PPPs.
Third, a higher FL level is surprisingly associated with a reduced probability to subscribe PPPs in the 2014 SHIW reduced wave of the balanced panel 2014.
The remainder of the paper is organised as follows. Section 2 reviews related literature and develops testable hypotheses. Section 3 describes the SHIW data. Section 4 presents the econometric framework. Section 5 reports and interprets the empirical findings. Section 6 concludes and discusses policy implications, limitations of the study and directions for future research.
2. Literature review and testable hypotheses
This paper relates to two strands of literature on household finance.
Investment mistakes, because of the discrepancy between observed and ideal behaviour, are central to the field (Campbell, Reference Campbell2006) and an increasingly investigated topic in empirical household finance (Mullainathan et al., Reference Mullainathan, Noeth and Schoar2012; Guiso and Sodini, Reference Guiso, Sodini, Constantinides, Harris and Stulz2013; Hastings et al., Reference Hastings, Madrian and Skimmyhorn2013; Iscenko, Reference Iscenko2018 and the references therein for a supervisory perspective).
With reference to the focus in this paper, recent studies examine how features of the market structure can affect individual choices. Gurun et al. (Reference Gurun, Matvos and Seru2016) show for the US how the market structure can affect individual choices for the case of expensive mortgages linked to the intensity of local advertising. Argyle et al. (Reference Argyle, Nadauld and Palmer2017) find for the US that borrowers are more likely to engage in searching for a better provider the higher the number of financial institutions within a 20-mile radius. Hastings et al. (Reference Hastings, Madrian and Skimmyhorn2017), for the case of social security privatisation in Mexico, document that many participants invest their account balances in financial products with high fees not offset by higher returns. The motivation offered is that their providers invest heavily in sales force and advertising, non-price attributes that substitute for competition on price.
The FL literature has increasingly probed into how, from the supply side, providers' incentives can hinder, leaving aside behavioural biases, investors' exploitation of FL competencies, geared prevalently to the demand side. Various principal-agent or conflict of interest arguments motivate mixed findings of complementarity or substitutability between FL and financial advice when considering the outcomes of investors' choices (complement in Hackethal et al., Reference Hackethal, Haliassos and Jappelli2012, Bucher-Koenen et al., Reference Bucher-Koenen, Hackethal, Koenen and Laudenbach2019, Calcagno and Monticone, Reference Calcagno and Monticone2015; substitute in Disney et al., Reference Disney, Gatherhood and Weber2015). These results lend support, from a policy point of view, to the idea that the option of a higher FL may be not an efficient use of public resources compared to the alternative of better structural and conduct regulation (Hastings et al., Reference Hastings, Madrian and Skimmyhorn2013).
This paper relates also to literature on the relevance of different definitions of FL on retirement planning in the Italian case, though using different FL definitions: preference for an annuity rather than a lump sum (Cappelletti et al., Reference Cappelletti, Guazzarotti and Tommasino2011, using 2008 SHIW); private pension system participation (Fornero and Monticone, Reference Fornero and Monticone2011a, Reference Fornero and Monticone2011b, using 2006 and 2008 SHIW). A related paper is Luciano et al. (Reference Luciano, Rossi and Sansone2016), which focuses mainly on life insurance subscriptions but includes also pension fund subscriptions in one robustness exercise, using selectively SHIW waves from 2004 to 2012.
This paper contributes to these literatures by focusing on the role of a structural sales force factor as at least a partial explanation for the investment mistake of preferring the dominated PPP. I take the view that such a factor combines various market structure features. First, an almost universal coverage of municipalities by the state controlled Post Office that provides its own insurance company's PIPs. Second, a comparatively reduced, and shrinking, coverage rate of municipalities by bank branches that compete, on their own and through the bank controlled management saving companies, with private insurance companies in offering FPAs. Third, in the background, fee-related compensations for advisers in banking groups controlling insurance companies bound to push investors toward higher-fee generating PIPs.
The econometric framework for the empirical investigation is organised around four testable hypotheses.
The first, and key for the purposes of this study, hypothesis tested with a cross-section multivariate analysis for full samples of the three SHIW waves is:
H1
conditional on being subscribed to any PPP, and controlling for households' financial strength, namely positive saving self-reported capability and risky asset ownership, the probability of dominated PIPs being preferred to FPAs decreases the higher municipal coverage rate of PPP providers.
Positive savings should first of all enhance the feasibility of investments of wealthier customers to supplement public pensions with personal voluntary subscriptions to PPPs. Moreover, financial providers should aim at these customers to sell expensive PIPs. In both cases the expected sign as an explanatory variable is positive. Being acquainted with risky assets, namely bonds, shares and mutual funds, should help ease households' participation to the PPP market. The expected sign as explanatory variable for the share of PIPs to PPPs is uncertain, because investors familiar with market risk should be better at assessing costs and returns of different plans.
A new Government's reform, hurriedly legislated in December 2011 to defuse a sovereign debt crisis and implemented in 2012, sharply raised the statutory retirement age and ended the slow phasing in toward a generalised notional contribution system. Wealthier households are likely to react to offset risks on the adequacy of public pension increasing their subscriptions to PPPs, because able to save in the first place and/or to exploit the tax breaks they were entitled toFootnote 4.
Hence, the second testable hypothesis, that follows from H1, on the expected variation of key estimates, especially between 2012 and post-reform 2014:
H2
when comparing the 2012 SHIW wave to the 2014 one, the stability of estimates for the sales force factor across waves should be associated with an increased explanatory power for households' financial strength indicators.
In contrast with the various theoretical predictions of complementarity/substitution relations between FL and financial advice, a higher FL should unambiguously thwart the preference for PIPs induced by the exogenous geographical distribution of PPP providers.
Accordingly, a third testable hypothesis in the cross-section multivariate analysis for the reduced samples of the three SHIW waves drawn from the balanced panel, assuming that respondent HHs have the identical FL level computed in 2010, is:
H3
conditional on being subscribed to any PPP, with a probability increasing with the level of FL, the probability of an increasing share of PIPs to PPPs decreases with the level of FL. The coefficient estimate for the FL indicator should be more statistically significant in the post-reform 2014 SHIW wave, owing to the reaction of wealthier households.
The indicator of the highest level of FL computed when all three questions are answered correctly in the 2010 SHIW wave, is likely not to fit adequately the decision process for pension investments. Lower FL levels could in fact be enough (Lusardi and Mitchell Reference Lusardi and Mitchell2014 and references therein; Hastings et al., Reference Hastings, Madrian and Skimmyhorn2013, Reference Hastings, Madrian and Skimmyhorn2017). Hence the fourth testable hypothesis, sort of robustness check on H3:
H4
lower FL indicators could yield estimation results similar to the one for the highest FL level.
3. The 2010–2014 SHIWs
The Section is organised as follows: (a) an overview of SHIW and an assessment of the representativeness of HHs' self-reported subscription rates; (b) an exploratory analysis of the association between FL levels computed for the 2010 SHIW wave and subscription rates to the private pension system.
3.1 Overview of SHIWs
The Bank of Italy's SHIW is a biennial survey on income and wealth with about 8,000 households as sampling units; the HH is the respondent who takes the main decisions on household finances. As in previous studies using SHIW on private pension participation, in the econometric investigation the estimation sample is restricted to 25–65 years old HHs, excluding those unemployed or out of the labour force.
Each survey, besides a fixed template, has modules that may or may not be replicated in the next wave. Only the three waves from 2010 to 2014 have an identical module on the participation to the private pension system (Banca d'Italia 2012, 2014, 2015). A module on FL is present only in the 2010 SHIW, and this is the reason for using a balanced panel of 2,320 HHs when testing H3 and H4.
The 2010–2014 interval, against the backdrop of a prolonged recession and of almost no inflation, allows to investigating the possible effects of one major, unexpected but widely discussed and resented reform. The only change for the private pension system was in fact a minor rise in the substitute tax rate on financial returnsFootnote 5.
Wealthier HHs, who are likely to be more interested in – and financially capable of – subscribing PPPs, are also the ones more affected by under- and mis-reporting on (net of taxes) income and current value of wealth, real and financial (including pension funds and life insurance), as exhaustively documented by Baffigi et al. (Reference Baffigi, Cannari and D'Alessio2016, Section 4). I deal with these data issues as follows. First, I adjust household incomeFootnote 6 for the number of its components, using the OECD equivalence weights; second, I split the resulting equivalised income and financial assets by deciles; third, I use a binary variable owner/no owner of the main home as an indicator of housing wealthFootnote 7 and fourth, I take into account the main household debt with a binary variable on whether a HH is/is not a mortgagee. The drawback of these choices, with all binary explanatory variables, except for age, is to shrink the variation in micro data, already low over a time span of five years, and to have high correlation among the indicators of equivalised income and financial assets. With respect to this last issue, to reduce collinearity, I drop financial assets as an explanatory variable.
In order to take into account the fact that financial constraints could inhibit proper investment choices, I exploit the question, present in all three waves, of whether the HH has been able to save in the reference yearFootnote 8. As expected, positive savings are associated with higher subscription rates in the private pension system (Table A.2 in the Online Appendix).
Caution is warranted in drawing policy implications from the results of an empirical investigation based on SHIW individual data, unadjusted for sample sizes.
The sum of the averaged subscription rates to any private pension plan in each SHIW wave (24.8%, 26.5% and 23.6%) is roughly similar to the self-reported grand total only assuming that the HHs acknowledging employers' matching contributions subscribe only to FPNs. SHIW data on employers' matching contributions include however also the voluntary ones for FPAs and PIPs. The ratio of PIPs to FPAs is also much higher than in COVIP data (Tables 1 and A.1).
It is worth noticing some differences in the cross section data when using full, rather than reduced samples drawn from the balanced panel, under the assumption that the surviving 25–65 years old HHs in the successive waves do not change their self-reported FL in the 2010 wave. By construction, the samples in the successive waves are modified because HHs aged 65+ exit but there are no entries. The changed composition yields an increasing average age and consequently, as suggested by a life-cycle framework, higher average equivalised incomes; the subscription rates to any private pension plans remain almost unchanged, in contrast with the downward trend in the full samples (Tables A.3–4).
3.2 Financial literacy and personal pension plan subscriptions
FL requirements vary in relation to different instruments for retirement savings. As underlined in OECD (2016, 128), decision-making about retirement is likely to be more difficult and calls for better FL when making choices on PPPs. Indeed, a more diversified portfolio of investment alternatives needs greater financial skills when compared to the occupational plans, which have a narrower range of options as for the choices of the provider and of the plan.
The questions operationalising the enquiries on the FL that have come to be known as the ‘Big Three’ – interest compounding, inflation and real interest rate, risk diversification – (e.g., Lusardi and Mitchell Reference Lusardi, Mitchell, Mitchell and Lusardi2011a, Klapper et al., Reference Klapper, Lusardi and van Oudheusden2016) are unlikely to fit the required competencies for retirement investment choices. In addition, how to map into a meaningful ranking score the number of correct answers to fairly different questions is an open issue (Hung et al., Reference Hung, Parker and Yoong2009). Finally, a necessary condition for financially literate potential subscribers to implement ‘optimal’ choices is that they earn enough to save.
Against this backdrop I exploit the 2010 SHIW, which has a module with three questions closely resembling the Big Three (see Online Appendix for the wording). The first question combines concepts of fixed and variable interest rate mortgages and of variable or constant mortgage instalments; a second question is centred on a nominal interest rate and inflation; a third one is on risk diversification. As is common in international comparisons on FL (Lusardi and Mitchell, Reference Lusardi and Mitchell2014), around one third of HHs answer correctly to all three questions; the risk diversification issue is the least understood one.
As expected, the distribution of correct answers among subscribers of private pension plans is tilted towards a higher score, though no strong association is detected with different levels of FL (Table 4).
Table 4. Correct answers on FL for subscribers to the private pension system: full sample and HHs in the 2010 sample out of the 2010–2014 balanced panel (%)
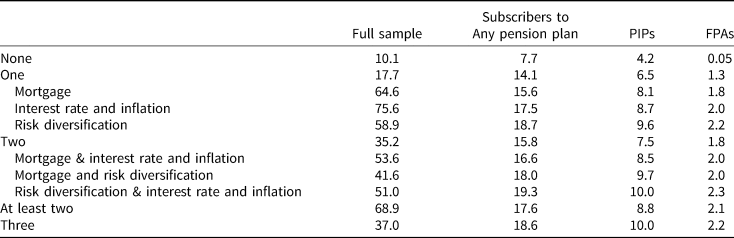
Source: Author's calculations from 2010 SHIW.
4. The econometric framework
The multivariate analysis relies on single wave cross-sections estimates in order to cope with the reduced variation of the binary variables in the short time span.
To test H1 and H2 I use a reduced form specification to explain the revealed preference for PIPs, conditional on participating to the PPP market. I deal with this sample selection problem using a standard two step Heckman probit procedure, whereby the second step requires exclusion restrictions on the explanatory variables included in the first step specification.
The choice of the dependent variable in the first step is motivated by the quality of the data retrieved from the SHIW, besides the issues mentioned in Section 3.1. PPP subscriptions are self-reported by respondents when answering a precise question on being subscribed to PIPs or FPAs. The answer to an overall question on the participation to the private pension system (see Appendix for the wording) encompasses the cases of being a subscriber to FPNs, FPAs or PIPs as well as to ‘pre-existing occupational plans’, namely occupational plans existing before the general pension system reform of early ’90s that created FPNs, FPAs and “old” PIPs (PIPs analysed in the study are new PIPs, started in 2007).
The probit specification in the first step (subscripts for the respondents omitted for simplicity) aims at explaining the probability of HHs' participating to the PPP market, and to this aim includes three categories of variables: the usual controls for household income, demographic characteristics and home ownership, two indicators of financial strength and a categorical variable to proxy the local availability of PPP providers. More specifically:
 $${\rm Pr} (PPP = {\rm} 1 \vert {\bi D,FS,GS})\; = {\rm} F\lpar {\alpha {\bi D} + {\rm} \beta {\bi FS} + {\rm} \gamma {\bi GS}} \rpar + {\rm} \varepsilon $$
where:
PPP = binary variable equal to 1 if a HH subscribed to any PPP, 0 otherwise;
D = vector of binary controls, except for the continuous variables age and age squared, describing the socio-demographic profile: second to tenth equivalised income decile, female, upper secondary degree, university degree, single, widowed, private employee, public employee, employed in a small firm (5–49 workers), medium firm (50–99), big firm (100 and over), household location in the North, household location in the Centre, home owner and mortgagee;
FS = vector of binary variables for financial strength: positive saving, risky asset owner, both expected to be positively signed, as discussed in Section 2;
GS = vector of binary variables proxying the sales force factor with the size of the city households reside in: medium city (20,000 to 40,000 inhabitants); large city (40,000 to 500,000); big city (500,000 and over);
ε = error term;
F = cumulative distribution function of the standard normal distribution.
The reference characteristics of the omitted HH are male, up to lower secondary degree, married, self-employed, employed in a micro firm (1–4 workers), household location in the South, first decile of equivalised income, no home owner, no mortgagee, no saving, no risky asset owner, small city (less than 20,000 inhabitants).
To investigate on the success of PIPs in the PPP market the exclusion restrictions are motivated by interest in assessing the explanatory power of the financial strength indicators and of the proxies for the sales force factor behind the revealed choice of the dominated PIPs, controlling for the collective subscription option open only for FPAs. The second step probit specification is therefore:
 $${\rm Pr} (PIP/PPP = {\rm} 1 \vert {\bi D^{\prime},FS,GS})\; = {\rm} F\lpar {\alpha^{\prime}{\bi D}^{\prime} + {\rm} \beta^{\prime}{\bi FS} + {\rm} \gamma^{\prime}{\bi GS}} \rpar + \eta $$
where:
PIP/PPP = binary variable equal to 1 if the subscribed PPP is a PIP and 0 if it is a FPAFootnote 9;
D’ = vector of binary controls for the employment status (private employee, public employee), to control for the option of collective FPA subscriptions for private employees;
FS, GS = as in the first step specification; η = error term.
The expected sign for positive saving is positive, if financial providers aim successfully at selling PIPs to wealthier customers. It is uncertain for the ownership of risky assets: investors familiar with market risk could be better at looking through supply side inducements, and therefore being less prone to subscribe PIPs; from a supply side perspective, it could be a signal to attract financial providers toward wealthier HHs. Under the maintained hypothesis on the sales force factor, the higher municipality coverage rate of financial providers (most especially the Post Office) pushing for PIPs should yield negatively signed estimates for larger city size indicators.
In order to test H3 and H4 I augment (1) and (2) for a two-step Heckman procedure with a binary indicator, equal to 1 when all three FL answers are correct:
 $${\rm Pr} (PPP = {\rm} 1 \vert {\bi D,FS,GS},{\rm} FL_{2010}) = {\rm} F(\alpha {\bi D} + {\rm} \beta {\bi FS} + {\rm} \gamma {\bi GS} + \delta FL_{2010}) + \varepsilon $$
 $${\rm Pr} (PIP/PPP = {\rm} 1 \vert {\bi D^{\prime},FS,GS},{\rm} FL_{2010}) = {\rm} F(\alpha ^{\prime}{\bi D}^{\prime} + {\rm} \beta ^{\prime}{\bi FS} + {\rm} \gamma ^{\prime}{\bi GS} + \delta ^{\prime}FL_{2010}) + \eta $$
where the dated FL indicator reminds that it is assumed invariant also for the 2012 and 2014 cross sections drawn out of the 2010–2014 balanced panel.
The expected sign for FL, as discussed in Section 2, is positive in the first step estimates and negative in the second step ones.
Finally, to assess whether different definitions of FL levels matter I run (3) and (4) substituting the indicator of top FL with each of the seven alternatives (indicator = 1 for correct answers to, respectively, one, two or at least two questions; 0 otherwise; for descriptive statistics see Table A.4), under the assumption that a HH subscribed to a PPP should be able to answer correctly at least to one FL question.
5. Empirical findings and discussion
5.1 Full sample cross sections
The overall χ 2 test significantly rejects the null of equations independence in two step Heckman probit procedure (Tables 5 and 6).
Table 5. PIPs' share of PPPs, conditional on being subscribed to any PPP

Source: Author's calculations from SHIW (various waves). t-Statistics out of robust SEs within brackets;
Heckman two step probit estimates (full samples) (25 to 65 years old employed household heads. Reference categories: first decile of equivalised household income, male, up to lower secondary degree, married, self-employed, micro firm (1–4 workers), location in the South, small city (up to 20,000 inhabitants), no home ownership, no mortgage, no saving, no risky asset ownership).
+p < 0.10, *p < 0.05, ** p < 0.01, *** p < 0.001.
Table 6. Average marginal effects for PIPs' share of PPPs for 45 years old HHs

Source: Author's calculations from SHIW (various waves); margins STATA 14 routine. t-Statistics out of robust SEs within brackets;
Heckman second step probit estimates; cross-section samples out of 2010–2014 balanced panel in italic; only statistically significant effects (see Table 5; estimates for samples out of 2010–2014 balanced panel available upon request).
*p < 0.05, ** p < 0.01.
The estimates in both steps broadly provide support to H1 and H2, with some interesting differences when comparing the three SHIW waves.
(i) The estimated coefficients for the larger municipality indicators are highly significant and negatively signed in all waves the second step estimates. This result, providing empirical support to the hypothesis on the role of the sales of force factor, is remarkable given that the coefficients for the same variable are always negatively signed and highly significant also in the first step estimates.
(ii) To better interpret these findings, I compute the average marginal effects for HHs aged 45 years (a typical worker's prime age peak), to be interpreted as the change in probability of preferring PIPs when binary variables take a value of one, instead of zero (Table 6). Compared to the reference case of small city, the probability is always lower: 13.7% for medium cities and 12.9 for large ones in 2010; 12.6 for medium cities in 2012; 11.4 for large cities and a peak of 20.2 for the big cities in 2014. The broadly similar average marginal effects when using the reduced samples out of the 2010–2014 balanced panel (Table 6, in italics), in spite of the different composition compared to the full samples, provide a robustness check supporting the empirical evidence for H1.
(iii) The first step estimates for the probability of being subscribed to any PPP provide highly significant and positively signed coefficients for both FS indicators. As expected, the second step estimates are poorly significant.
(iv) The expected increasing role of financial strength indicators between 2012 and 2014 as explanatory variables for the personal pension investments of wealthier households after the reform does seem empirically supported only for the probability of participating to the PPP market. The coefficient estimates of FS indicators show in fact increasing values and statistical significance between 2012 and 2014. In addition, housing wealth, proxied by home ownership, is (strongly) significant only in 2014. I surmise that these results provide adequate supporting evidence for H2.
5.2 Financial literacy in cross sections out of the balanced panel
The addition of the FL indicator for three correct answers in both estimation steps yields only a weak support to H3. FL2010, though negatively signed as expected in 2010 and 2014, is not significant as an explanatory variable in the second step; the variable enters negatively also in the first step, and is statistically significant only in 2014.
The average marginal effect computed out of the first step probit estimates yields a change in the probability of subscribing to any PPP when FL2010 takes a value of one, instead of zero, of −3,8%, at a % significance level.
When investigating for H4, substituting the indicator for the three correct answers with each of the seven alternatives, only the indicator of correct answers to the two questions on risk diversification and mortgages results significant, with an almost identical average marginal effect (−3.6%). This result fits the literature according to which, though risk diversification is the least understood concept in FL (Hastings et al., Reference Hastings, Madrian and Skimmyhorn2013; Klapper et al., Reference Klapper, Lusardi and van Oudheusden2016), it is the one that matters most in retirement planning and precautionary savings (Lusardi and Mitchell, Reference Lusardi and Mitchell2011b; on US data, Lusardi, Reference Lusardi2015) (Table 7).
Table 7. PIPs' share of PPPs, conditional on being subscribed to any PPP

Source: Author's calculations from SHIW (various waves). t-Statistics out of robust SEs within brackets;
Heckman two step probit estimates (cross-sections out of 2010–2014 balanced panel) (25 to 65 years old employed household heads. Reference categories (for selected results): small city (up to 20,000 inhabitants), no home ownership, no saving, no risky asset ownership).
+p < 0.10, *p < 0.05, ** p < 0.01, *** p < 0.001.
a Complete results, with all variables as in Table 5, available upon request.
Though the negative, albeit small, average marginal effect of FL for the subscription rate to PPPs is puzzling, it is worth noticing that a very recent paper finds no association between FL and the probability of private retirement saving account or private pension scheme subscription for Ireland (Nolan and Doorley, Reference Nolan and Doorley2019).
The evidence I provide is not easily comparable, given the focus on the PPP market, to the findings of previous studies that investigate the participation rate in the Italian private pension system as a whole, using SHIW editions with different wordings in the FL module. The correct answer to the question on the effect of inflation on the purchasing power is significant at the 10% level in the 2008 SHIW (Cappelletti and Guazzarotti, Reference Cappelletti and Guazzarotti2010). In the LPM estimates, the correct answer to the question on interest rate, which is also, surprisingly, the least understood, is significant, at the 1% level in the 2006 SHIW, whereas the correct answer to the question on inflation is not significant; in the probit estimates, being able to answer all three questions correctly is not statistically significant (Fornero and Monticone, Reference Fornero and Monticone2011a). Average marginal effects of FL on private pension subscriptions are highly significant, large and increasing with FL levels, especially with IV probit estimates in the 2010 SHIW (probability up to 42% to participate in the private pension with three correct FL answers), though there are no controls for positive saving (Ricci and Caratelli, Reference Ricci and Caratelli2017). It is interesting to note that in this last study the size of the municipality has an explanatory role on the demand side, because it is one of the two variables chosen to instrument the endogenous FL, assuming that larger municipalities provide easier access to banking services, besides Information and Communications Technology (ICT) and education. This rationale could be intuitively adopted also for arguing that there should be a positive correlation between PPP subscription rates and municipality size. The first step estimates on Table 5, however, consistently negative and highly significant, suggest it is worth exploring a supply side perspective, as it is attempted in the present study.
Due to the likely endogeneity of FL to the financial choices I cannot impute a causal interpretation to the estimated coefficients (Jappelli and Padula, Reference Jappelli and Padula2015).
6. Conclusions
This paper has investigated the reasons behind the preference of Italian workers for the dominated alternative of PPPs, i.e., insurance-based PIPs instead of open funds FPAs. This decade-long investment mistake à la Campbell (Reference Campbell2006) offers a clue to the role of structural supply factors that need to be taken into account in order to assess the available set of choices for pension investment. An emerging literature has detected supply side factors countervailing the expected demand side determinants, be they marketing expenses or advisors' incentives or financial competence (Foà et al., Reference Foà, Gambacorta, Guiso and Mistrulli2015 for Italy; Gurun et al., Reference Gurun, Matvos and Seru2016 for the US; Argyle et al., Reference Argyle, Nadauld and Palmer2017 for the US; Hastings et al., Reference Hastings, Madrian and Skimmyhorn2017 for Mexico; Iscenko Reference Iscenko2018 for the UK). I contribute to this literature by adding the factor of the geographical distribution of providers tilted towards the dominated instrument. One key component is the countrywide network of the state-controlled Post Office selling only PIPs of the subsidiary insurance company. A second component is the larger scope left to private insurance companies, providers of both PIPs and FPAs, in comparison with banks and bank-controlled management saving companies, providers of FPAs only.
The evidence of a structural supply factor tilted towards PIPs is robust across SHIW waves. This result is the more remarkable because the widely debated and politically controversial shock of a public pension reform in the midst of a sovereign debt crisis should have raised the salience of a proper choice in PPPs, especially among wealthier households. Indeed, financial strength indicators are statistically significant and correctly signed explanatory variables in the first step estimation procedure to explain the subscription rate to PPPs in the 2014 wave; they were negligible in the 2012 wave.
This paper contributes also to the FL literature. More financially literate investors should be better at understanding the advantages of supplementing public pension entitlements with voluntary PPPs and to look through the sales force factor inducements to push for preferring one of the alternative PPPs. I estimate instead a surprisingly negative, though small, coefficient for the FL indicator, amounting to a decrease in the probability of subscribing PPPs in the 2014 wave. Caution is warranted in considering this result, because of the reduced sample of the cross-sections drawn from a 2010–2014 balanced panel with an FL level, computed only for the 2010 SHIW wave and therefore assumed invariant for the following waves.
I surmise that these findings have two main policy implications.
First, public policies aimed at improving consumer financial outcomes, whatever the level of FL, have to encompass a wide variety of regulatory approaches, to avoid frictions in local markets because of an excessive pressure by suppliers. Structural regulation is called for, in order to let workers to access a wide enough set of local financial providers and independent advisors. Regulation on transparency and consumer protection, designing more effective guidelines and supervision on how consultants inform and advise in pension choices, should restrain advisers' incentives, following the best practices of the bans on inducement towards in-house products in the Netherlands and the UK (European Commission, 2018).
Second, on FL, better policies should aim at designing more focused packages that, besides concepts more related to specific financial products, include also notions on how market structure features can narrow down the choices available to investors in the place where they reside.
This study has some obvious limitations, starting with the loose matching between SHIW and COVIP data. The crude proxying of geographical distribution of PPP providers warrants for a special module in future SHIWs. The evidence gathered on the geographical market structure opens however an interesting avenue for research in an international comparative perspective on this supply side feature as well as on the range of financial products sold by state-controlled and private providers.
I view as a key shortcoming from a policy point of view the lack of microdata on self-reported subscription rates associated with no contributions in the year of reference. Missing contributions, on COVIP data, from one fifth of enrollees in the private pensions system, one fourth for subscribers to PPPs and almost one third for self-employed subscribers, raise intriguing research questions on the role of FL and saving of workers who have to rely increasingly on their own investment to aim at an adequate pension income.
Supplementary material
The supplementary material for this article can be found at https://doi.org/10.1017/S1474747219000209


