1 Introduction
The world will experience major changes in its demographic structure in the next decades. In all countries, this process is driven by increasing life expectancy and falling birth rates. The fraction of the population in working-age will decrease and the fraction of people in old-age will increase. This process is already well under way in industrialized countries with many developing countries following suit in a few decades. Standard economic analyses predict that these demographic processes will increase the capital–labor ratio. Hence, rates of return to capital will decrease and wages increase, which has adverse welfare consequences for current cohorts who will be retired when the rate of return on assets is low.
The purpose of this paper is to ask how strongly three channels of adjustment to these ongoing developments and their interactions dampen such adverse welfare effects. We focus on France, Germany and Italy (FGI) as the three European countries that are most affected by the ongoing demographic change. First, compared with these countries, the rest of the world (ROW) is relatively young. In autarky, rates of return to capital in ROW are therefore higher. From the perspective of industrialized countries such as FGI, globalization and investing capital abroad may therefore stabilize the return to capital. Second, as raw labor will become a relatively scarce factor and as life expectancy increases, strong incentives to invest in human capital emanate. This improves productivity. Such endogenous human capital adjustments may thereby substantially mitigate the effects of demographic change on macroeconomic aggregates and individual welfare. Third, while human capital adjustment increases the quality of the factor labor, a parametric pension reform (PR) through increasing the retirement age will increase the quantity of labor. By increasing the fraction of the population in the labor force, this will further increase per capita output. In addition to this direct effect, increasing the retirement age will also extend the worklife planning horizon of households, thus amplifying the incentives to accumulate human capital.
Point of departure of our analysis is the demographic evolution in two world regions, FGI and ROW. The left panel of Figure 1 illustrates the impact of demographic change on the working-age population ratio – the ratio of the working-age population (of age 16–64) to the total adult population (of age 16–90) – and the right panel the old-age dependency ratio – the ratio of the old population of age 65–90 to the working-age population – in these regions. As the figure shows, the demographic structure is subject to significant changes over time in both regions. Currently, there are large level differences, but overall demographic trends are very similar.

Figure 1. Old-Age Dependency Ratio and Working-Age Population Ratio. (a) Working-Age Population Ratio (b) Old-Age Dependency Ratio.
Notes: Data taken from United Nations (2007) and own projections. FGI: France, Germany and Italy, ROW: Rest of the world.
We feed these demographic data into an Auerbach and Kotlikoff (Reference Auerbach and Kotlikoff1987) style overlapping generations (OLG) model with two integrated world regions, endogenous labor supply decisions and endogenous human capital formation. Our model builds on Ludwig et al. (Reference Ludwig, Schelkle and Vogel2012) who focus on the USA as a closed economy and ignore any adjustments of the retirement age. Our extensions of this earlier work allow us to compare different adjustments – which have been identified as important in the previous literature – within one coherent framework and to highlight their interactions. Despite these conceptual differences to earlier work, we also direct the view toward an analysis of FGI in an integrated world and not of the USA in isolation. Importantly, FGI is small relative to the rest of the world. In contrast to standard small open economy models where constant interest rates are assumed, we however discipline the calibration by considering FGI as embedded in the world economy. Hence, relative prices are determined by worldwide demographic processes.
As the central part of our analysis we work out the quantitative differences between a benchmark (BM) model – with open economies and endogenous human capital formation – and counterfactual models where countries operate as closed economies and where human capital may be exogenous. Along this line we emphasize the role of pension policy. We combine our PR of increasing the retirement age with two pension scenarios of a stylized pay-as-you-go (PAYG) pension system. In these scenarios, either the contribution rate or the relative benefit level is held constant and – given a balanced budget and the demographic trends as displayed in Figure 1 – benefits or contributions adjust.
Our main findings for our baseline scenario with constant contribution rates are as follows. In absence of endogenous human capital formation and without a fundamental PR, demographic change would lead to a substantial reduction of economic growth. Expressed relative to a constant trend growth scenario, this leads to an accumulated output reduction by about 5% until 2040 and a reduction of the real rate of return to capital by more than one percentage point. This implies that currently (as of year 2010) 50-year-old households experience welfare losses. They would be willing to give up roughly 7% of their consumption each period of their remaining expected life to rather live in a world without the ongoing demographic change. However, this picture is too gloomy in light of potential adjustments through human capital formation and a PR. Taking these two effects into consideration, the overall output response is particularly large in the open economy scenario. There, gross domestic product (GDP) per capita in the year 2040 is about 15% higher without and 20% higher with the PR, relative to a path with constant growth.Footnote 1 The decrease of the rate of return – which is the relevant aggregate statistic to evaluate the welfare consequences for middle aged asset rich households – is only 0.6 percentage points. Hence, maximum welfare losses reduce to 4%.
The reason for the reduction of output and rates of return (and the accompanying welfare losses) in the closed economy, exogenous human capital model without a PR is that demographic change leads to scarcity of raw labor. This increases the capital intensity, decreasing the rate of return and – given our maintained assumption of constant contribution rates – leads to increasing net wages. An important feedback is labor supply of households, which increases, but the effect is not strong enough to compensate for the reduction of raw labor. Hence, output and rates of return decrease in general equilibrium.
However, the adjustment of the quantity of labor through the endogenous increase of hours worked is only one feedback channel. Once human capital endogenously adjusts, then the simultaneous decrease of asset returns and increase of wages leads households to reduce their labor supply when young to invest in human capital. This increases the quality of the workforce thereby also leading to a lower increase of capital per effective worker. The higher amount of human capital leads to output gains (relative to a constant growth scenario) along the transition and the rate of return decreases by less. This feedback is additionally amplified by the PR: it increases the raw amount of labor and triggers additional incentives to invest in human capital. The PR is particularly effective in the open economy. Because FGI is a relatively small region compared to the rest of the world, general equilibrium feedback is absent in the open economy which would otherwise dampen the effects of the reform.
In closed economies, İmrohoroğlu et al. (Reference İmrohoroğlu, İmrohoroğlu and Joines1995), Fuster et al. (Reference Fuster, İmrohoroğlu and İmrohoroğlu2007), Huang et al. (Reference Huang, İmrohoroğlu and Sargent1997) and De Nardi et al. (Reference De Nardi, İmrohoroğlu and Sargent1999) quantify the effects of social security adjustments on factor prices and welfare. In open economies, Domeij and Flodén (Reference Domeij and Flodén2006), Bösch-Supan et al. (Reference Bösch-Supan, Ludwig and Winter2006), Fehr et al. (Reference Fehr, Jokisch and Kotlikoff2005), Attanasio et al. (Reference Attanasio, Kitao and Violante2007) and Krüger and Ludwig (Reference Krüger and Ludwig2007), among others, investigate the role of international capital flows during the demographic transition. Storesletten (Reference Storesletten2000) examines the effect of migration to industrialized countries as a means to take pressure from social security systems. The effects of increased human capital accumulation are examined by Fougère and Mérette (Reference Fougère and Mérette1999), Sadahiro and Shimasawa (Reference Sadahiro and Shimasawa2002), Buyse et al. (Reference Buyse, Heylen and Van de Kerckhove2012), Ludwig et al. (Reference Ludwig, Schelkle and Vogel2012) and Heijdra and Reijnders (Reference Heijdra and Reijnders2012). This work uses some version of the seminal paper by Ben-Porath (Reference Ben-Porath1967)Footnote 2 and concludes that human capital adjustments may significantly mitigate the adverse consequences of demographic change.
While evidence on the effect of changes in the mandatory retirement age in the quantitative literature is scarce, there are a growing number of empirical papers estimating the effect of PRs on old-age labor supply and the actual retirement age. For instance, Mastrobuoni (Reference Mastrobuoni2009), Hurd and Rohwedder (Reference Hurd and Rohwedder2011) and French and Jones (Reference French and Jones2012) document that the response of older workers to changes in retirement age legislation is large (extensive margin) whereby younger workers do not react much (intensive margin), just as we find.Footnote 3 While in this paper we ignore the link between human capital accumulation and endogenous growth in the long-run, there are a considerable number of contributions shedding light on this topic.Footnote 4
The remainder of our analysis is organized as follows. In Section 2, we present the formal structure of our quantitative model. Section 3 describes the calibration strategy and our computational solution method. Our results are presented in Section 4. Finally, Section 5 concludes the paper. Detailed descriptions of computational methods and additional results are relegated to separate online appendices.
2 The model
We use a large-scale multi-country OLG model in the spirit of Auerbach and Kotlikoff (Reference Auerbach and Kotlikoff1987) with endogenous labor supply, human capital formation, and a standard consumption-saving decision. Our model extends Ludwig et al. (Reference Ludwig, Schelkle and Vogel2012) to an open economy setup and a flexible treatment of the retirement age. The population structure is exogenously determined by time- and region-specific demographic processes for fertility, mortality, and migration, the exogenous driving force of the model.Footnote 5 The world population is divided into two regions, FGI and ROW.
2.1 Timing, demographics and notation
The model is cast in discrete time with time t being measured in calendar years. Each year, a new cohort enters the economy. Since agents are inactive before they enter the labor market, entering the economy refers to the first time agents make own decisions and is set to real life age of 16 (model age j = 0). In the BM scenario, agents retire at an exogenously given age of 65 (model age jr = 49) and live at most until age 90 (model age j = J = 74). Both numbers are identical across regions. At a given point in time t, individuals of age j in country i survive to age j + 1 with probability ϕ
t,j,i
, where ϕ
t,J,i
= 0. The number of agents of age j at time t in country i is denoted by N
t,j,i
and
 $N_{t,i} = \sum\nolimits_{j = 0}^J N_{t,j,i} $
is the total population in t, i. In the demographic projections migration happens at the age of 16. Thus, we implicitly assume that new migrants are born with the initial human capital endowment and human capital production function of natives. This assumption is consistent with Hanushek and Kimko (Reference Hanushek and Kimko2000) who show that individual productivity (and thus human capital) of workers is mainly related to a country's level of schooling and not to cultural factors. This assumption on the age of migration also implies that we can treat newborns and immigrants alike, which is technically convenient.
$N_{t,i} = \sum\nolimits_{j = 0}^J N_{t,j,i} $
is the total population in t, i. In the demographic projections migration happens at the age of 16. Thus, we implicitly assume that new migrants are born with the initial human capital endowment and human capital production function of natives. This assumption is consistent with Hanushek and Kimko (Reference Hanushek and Kimko2000) who show that individual productivity (and thus human capital) of workers is mainly related to a country's level of schooling and not to cultural factors. This assumption on the age of migration also implies that we can treat newborns and immigrants alike, which is technically convenient.
2.2 Households
Households are populated by one representative agent deciding about consumption, saving, labor supply, and time investment into human capital formation. The remaining time is consumed as leisure. A household in region i maximizes lifetime utility at the beginning of economic life (j = 0) in period t,
 $$\max \sum\limits_{\,j = 0}^J \beta ^j \pi _{t,j,i} \displaystyle{1 \over {1 - \sigma}} \{ c_{t + j,j,i}^\varphi (1 - \ell _{t + j,j,i} - e_{t + j,j,i} )^{1 - \varphi} \} ^{1 - \sigma}, \quad \sigma \gt 0,$$
where the per period utility function takes consumption c, working hours ℓ and time spent on increasing the stock of human capital e, as inputs. Standardizing the time endowment to unity leaves 1 − ℓ − e as leisure time. φ is the consumption elasticity in utility, β is the raw time discount factor, and σ is the inverse of the inter-temporal elasticity of substitution with respect to the consumption-leisure aggregate. π
t,j,i
denotes the unconditional probability to survive until age j,
 $\pi _{t,j,i} = \prod\nolimits_{k = 0}^{j - 1} \phi _{t + k,k,i} $
, for j > 0 and π
t,0,i
= 1.
$\pi _{t,j,i} = \prod\nolimits_{k = 0}^{j - 1} \phi _{t + k,k,i} $
, for j > 0 and π
t,0,i
= 1.
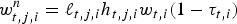
Agents earn labor income (pensions if retired), interest payments on their physical assets, and receive accidental bequests. Social security contributions are a share τ
t,i
of their gross wages. Net wage income in period t of an agent of age j living in region i is given by
 $w_{t,j,i}^n = \ell _{t,j,i} h_{t,j,i} w_{t,i} (1 - \tau _{t,i} )$
, where w
t,i
is the (gross) wage per unit of supplied human capital at time t in region i. Annuity markets are missing and accidental bequests are distributed by the government as lump-sum payments to households. The household's dynamic budget constraint is given by
$w_{t,j,i}^n = \ell _{t,j,i} h_{t,j,i} w_{t,i} (1 - \tau _{t,i} )$
, where w
t,i
is the (gross) wage per unit of supplied human capital at time t in region i. Annuity markets are missing and accidental bequests are distributed by the government as lump-sum payments to households. The household's dynamic budget constraint is given by
 $$a_{t + 1,j + 1,i} = \left\{ \matrix{(a_{t,j,i} + tr_{t,i}) (1 + r_{t,i}) + w_{t,j,i}^n - c_{t,j,i} &{\rm if}\;j \lt jr \cr (a_{t,j,i} + tr_{t,i}) (1 + r_{t,i}) + p_{t,j,i} - c_{t,j,i} &{\rm if}\;j \ge jr \comma} \right.$$
where a t,j,i denotes assets, p t,j,i is pension income, tr t,i are transfers from accidental bequests, and r t,i is the real interest rate, the rate of return to physical capital. Households start their economic life with zero assets (a t,0,i = 0) and do not intend to leave bequests to the next generation (a t,J+1,i = 0).
2.3 Formation of human capital
The initial level of human capital h t,0,i = h 0 is exogenously given, identical across households of a birth cohort and cohort invariant. Then, at any point in time agents can spend a fraction of their time to build human capital. We employ a frequently used twist of the Ben-Porath (Reference Ben-Porath1967) human capital technology given by
 $$h_{t + 1,j + 1,i} = h_{t,j,i} (1 - \delta _i^h ) + \xi _i (h_{t,j,i} e_{t,j,i} )^{\psi _i}, \quad \psi _i \in (0,1),\quad \xi _i \gt 0,\quad \delta _i^h \ge 0,$$
where ξ
i
is a scaling factor, ψ
i
determines the curvature of the human capital technology and
 $\delta _i^h $
is the depreciation rate of human capital. Parameters of the production function vary across regions to allow for region-specific human capital profiles during our calibration period.Footnote
6
Since we do not model any other labor market frictionsFootnote
7
or costs of human capital acquisition this is the only way to replicate observed differences in age-wage profiles. However, we adjust parameters such that they are eventually identical in both regions and thus agents will have – everything else equal – the same life-cycle human capital profile in the final steady state (see Section 3.3).
$\delta _i^h $
is the depreciation rate of human capital. Parameters of the production function vary across regions to allow for region-specific human capital profiles during our calibration period.Footnote
6
Since we do not model any other labor market frictionsFootnote
7
or costs of human capital acquisition this is the only way to replicate observed differences in age-wage profiles. However, we adjust parameters such that they are eventually identical in both regions and thus agents will have – everything else equal – the same life-cycle human capital profile in the final steady state (see Section 3.3).
Investment into human capital requires only the input of time. Opportunity costs of human capital accumulation are not only forgone wages but also the utility loss due to less leisure. As we do not model formal education and on-the-job-experience (learning-by-doing) separately, the accumulation of human capital is a mixture of formal and informal training programs. Human capital can be accumulated at all stages of the life-cycle but optimal behavior implies that agents will spend more time on building human capital early in life and factually stop investing some years before retirement.
2.4 Firms
There is a large number of firms in a perfectly competitive environment producing a homogenous good (which can be consumed or invested) using the Cobb–Douglas technology
 $$Y_{t,i} = K_{t,i}^\alpha (A_{t,i} L_{t,i} )^{1 - \alpha}. $$
Here, α denotes the share of capital used in production. K
t,i
, L
t,i
and A
t,i
are region-specific stocks of physical capital, effective labor and the level of technology, respectively. Labor inputs and human capital of different agents (of different age) are perfect substitutes.Footnote
8
Aggregate effective labor input L
t,i
is given by
 $L_{t,i} = \sum\nolimits_{j = 0}^{jr - 1} \ell _{t,j,i} h_{t,j,i} N_{t,j,i} $
. Factors of production are paid their marginal products, i.e.,
$L_{t,i} = \sum\nolimits_{j = 0}^{jr - 1} \ell _{t,j,i} h_{t,j,i} N_{t,j,i} $
. Factors of production are paid their marginal products, i.e.,
 $$w_{t,i} = (1 - \alpha )A_{t,i} k_{t,i}^\alpha, $$
 $$r_{t,i} = \alpha k_{t,i}^{\alpha - 1} - \delta, $$
where k
t,i
≡K
t,i
/A
t,i
L
t,i
is the capital intensity, i.e., the capital stock per efficient unit of labor, w
t,i
is the gross wage per unit of efficient labor, r
t,i
is the interest rate, and δ denotes the (constant) depreciation rate of physical capital. Total factor productivity (TFP), A
t,i
, is growing at the region-specific exogenous rate
 $g_{t,i}^A $
:
$g_{t,i}^A $
:
 $A_{t + 1,i} = A_{t,i} (1 + g_{t,i}^A )$
.
$A_{t + 1,i} = A_{t,i} (1 + g_{t,i}^A )$
.
2.5 Capital markets
We assume that both regions are initially closed economies where we solve for the equilibrium transition path of both economies with agents using only prices and transfers from the closed economy scenario. Then, we repeat the same exercise but assume that both economies are open. We follow Buiter and Kletzer (Reference Buiter and Kletzer1995) and assume that physical capital is perfectly mobile, whereas human capital (labor) is immobile. This implies that, in the world capital market equilibrium, the interest rate is the same across regions. Given the choice of our country aggregates, the weight of FGI decreases over time. Hence, the open economy market clearing interest rate will be largely dominated by demographic developments in the other part of the world (ROW).
2.6 The pension system
The pension system is a simple PAYG system that replicates key mechanics of many real-world public pension schemes. The system is balanced in every period by adjusting the contribution rate or the replacement rate. Workers contribute a fraction τ
t,i
of their gross wages, and pensioners receive a fraction ρ
t,i
of their average indexed yearly earnings (AIYE) over their employment history.Footnote
9
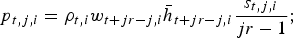
The level of pensions for each period t in region i of an agent of age j is given by
 $p_{t,j,i} = \rho _{t,i} w_{t + jr - j,i} \bar h_{t + jr - j,i} (s_{t,j,i} /(jr - 1))$
, where
$p_{t,j,i} = \rho _{t,i} w_{t + jr - j,i} \bar h_{t + jr - j,i} (s_{t,j,i} /(jr - 1))$
, where
 $w_{t + jr - j,i} \bar h_{t + jr - j,i} (s_{t,j,i} /jr - 1)$
are AIYE over the working life,Footnote
10
$w_{t + jr - j,i} \bar h_{t + jr - j,i} (s_{t,j,i} /jr - 1)$
are AIYE over the working life,Footnote
10
 $w_{t + jr - j,i} \bar h_{t + jr - j,i} $
are average earnings of all workers in period t when a retiree of age j reaches retirement age jr. Further,
$w_{t + jr - j,i} \bar h_{t + jr - j,i} $
are average earnings of all workers in period t when a retiree of age j reaches retirement age jr. Further,
 $\bar h_{t,i} $
, the region-specific average effective human capital of a worker, is defined as
$\bar h_{t,i} $
, the region-specific average effective human capital of a worker, is defined as
 $$\bar h_{t,i} = \displaystyle{{\sum\nolimits_{\,j = 0}^{\,jr - 1} {\ell _{t,j,i} h_{t,j,i} N_{t,j,i}}} \over {\sum\nolimits_{\,j = 0}^{\,jr - 1} {N_{t,j,i}}}}. $$
Past individual earnings of an agent relative to average economy-wide earnings in the respective year is given by
 $$s_{t,j,i} = \sum\limits_{i = 0}^j {\displaystyle{{\ell _{t - j + i,i} h_{t - j + i,i}} \over {\bar h_{t - j + i}}},} $$
which links contributions and pensions. Last, the budget constraint of the system is given by
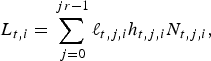
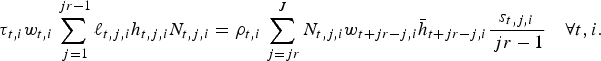 $$\tau _{t,i} w_{t,i} \sum\limits_{\,j = 1}^{\,jr - 1} \ell _{t,j,i} h_{t,j,i} N_{t,j,i} = \rho _{t,i} \sum\limits_{\,j = jr}^J N_{t,j,i} w_{t + jr - j,i} \bar h_{t + jr - j,i} \displaystyle{{s_{t,j,i}} \over {\,jr - 1}}\quad \forall t,i.$$
where we have substituted p t,j,i into the equation.
We consider two policy scenarios. In our first scenario, we keep the retirement age at the baseline level (65 years) and hold the contribution rate constant
 $\tau _{t,i} = \bar \tau _i $
(labeled ‘const. τ’). We endogenously adjust the replacement rate to balance the budget of the pension system. The alternative adjustment with constant replacement rates is briefly discussed in Section 4.4.
$\tau _{t,i} = \bar \tau _i $
(labeled ‘const. τ’). We endogenously adjust the replacement rate to balance the budget of the pension system. The alternative adjustment with constant replacement rates is briefly discussed in Section 4.4.
As the second dimension of PRs we increase the normal retirement age in region FGI. This reform scenario captures two effects on incentives to acquire human capital: a lengthening of the working life combined with – everything else equal – lowering the tax burden on currently working individuals. It mimics elements of the actual reform debate in FGI.Footnote 11
2.7 Equilibrium
Denoting current period/age variables by x and next period/age variables by x', a household of age j solves in region i, at the beginning of period t, the maximization problem
 $$V(a,h,s,t,j,i) = \mathop {\max} \limits_{c,\ell, e,a^{\prime}, h^{\prime}, s^{\prime}} \{ u(c,1 - \ell - e) + \phi _i \beta V(a^{\prime}, h^{\prime}, s^{\prime}, t + 1,j + 1,i)\} $$
subject to
 $w_{t,j,i}^n = \ell _{t,j,i} h_{t,j,i} w_{t,i} (1 - \tau _{t,i} )$
, (2), (3) and the constraint e ∈ [0, 1 − ℓ) and ℓ ∈ [0, 1).
$w_{t,j,i}^n = \ell _{t,j,i} h_{t,j,i} w_{t,i} (1 - \tau _{t,i} )$
, (2), (3) and the constraint e ∈ [0, 1 − ℓ) and ℓ ∈ [0, 1).
Definition 1
Given the exogenous population distribution and survival rates in all periods
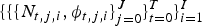 $\{ \{ \{ N_{t,j,i}, \phi _{t,j,i} \} _{j = 0}^J \} _{t = 0}^T \} _{i = 1}^I $
, an initial physical capital stock and an initial level of average human capital
$\{ \{ \{ N_{t,j,i}, \phi _{t,j,i} \} _{j = 0}^J \} _{t = 0}^T \} _{i = 1}^I $
, an initial physical capital stock and an initial level of average human capital
 $\{ K_{0,i}, \bar h_0 \} _{i = 1}^I $
, and an initial distribution of assets and human capital
$\{ K_{0,i}, \bar h_0 \} _{i = 1}^I $
, and an initial distribution of assets and human capital
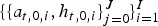 $\{ \{ a_{t,0,i}, h_{t,0,i} \} _{j = 0}^J \} _{i = 1}^I $
, a competitive equilibrium is given by sequences of individual variables
$\{ \{ a_{t,0,i}, h_{t,0,i} \} _{j = 0}^J \} _{i = 1}^I $
, a competitive equilibrium is given by sequences of individual variables
 $$\{ \{ \{ c_{t,j,i}, e_{t,j,i}, a_{t + 1,j + 1,i}, h_{t + 1,j + 1,i}, s_{t + 1,j + 1,i} \} _{\,j = 0}^J \} _{t = 0}^T \} _{i = 1}^I, $$
sequences of aggregate variables
 $\{ \{ L_{t,i}, K_{t + 1,i}, Y_{t,i} \} _{t = 0}^T \} _{i = 1}^I $
, government policies
$\{ \{ L_{t,i}, K_{t + 1,i}, Y_{t,i} \} _{t = 0}^T \} _{i = 1}^I $
, government policies
 $\{ \{ \rho _{t,i}, \tau _{t,i} \} _{t = 0}^T \} _{i = 1}^I $
, prices
$\{ \{ \rho _{t,i}, \tau _{t,i} \} _{t = 0}^T \} _{i = 1}^I $
, prices
 $\{ \{ w_{t,i}, r_t \} _{t = 0}^T \} _{i = 1}^I $
, and transfers
$\{ \{ w_{t,i}, r_t \} _{t = 0}^T \} _{i = 1}^I $
, and transfers
 $\{ \{ tr_{t,i} \} _{t = 0}^T \} _{i = 1}^I $
such that
$\{ \{ tr_{t,i} \} _{t = 0}^T \} _{i = 1}^I $
such that
-
1. given prices, bequests and initial conditions, households solve their maximization problem as described above;
-
2. interest rates and wages are paid their marginal products, i.e., w t,i = (1 − α)(Y t,i /L t,i ) and r t,i = α (Y t,i /K t,i ) − δ;
-
3. per capita transfers are determined by
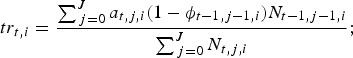
(9) $$tr_{t,i} = \displaystyle{{\sum\nolimits_{\,j = 0}^J {a_{t,j,i} (1 - \phi _{t - 1,j - 1,i} )N_{t - 1,j - 1,i}}} \over {\sum\nolimits_{\,j = 0}^J {N_{t,j,i}}}} ;$$
-
4. government policies are such that the budget of the social security system is balanced in every period and region, i.e., equation (7) holds ∀t, i, and household pension income is given by
$p_{t,j,i} = \rho _{t,i} w_{t + jr - j,i} \bar h_{t + jr - j,i} {{s_{t,j,i}} \over {jr - 1}};$
-
5. all regional labor markets clear and allocations are feasible in all periods:
(10a)
$$L_{t,i} = \sum\limits_{\,j = 0}^{\,jr - 1} \ell _{t,j,i} h_{t,j,i} N_{t,j,i}, $$
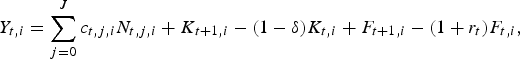
(10b)
$$Y_{t,i} = \sum\limits_{j = 0}^J c_{t,j,i} N_{t,j,i} + K_{t + 1,i} - (1 - \delta )K_{t,i} + F_{t + 1,i} - (1 + r_t )F_{t,i}, $$
(10c)
$$Y_t = \sum\limits_{i = 1}^I Y_{t,i}, $$
(10d)
$$K_{t + 1} = \sum\limits_{i = 1}^I \sum\limits_{j = 0}^J a_{t + 1,j + 1,i} N_{t,j,i} ;$$
-
6. and the world capital market clears at the world interest rate r t = r t,i ,∀i, hence the sum of foreign assets F t,i across all regions is zero
(11)
$$\sum\limits_{i = 1}^I F_{t,i} = 0\quad \Leftrightarrow \quad r_{t,i} = r_t {\kern 1pt} \forall i\quad \Leftrightarrow \quad k_{t,i} = k_t, {\kern 1pt} \displaystyle{{K_{t,i}} \over {Y_{t,i}}} = \displaystyle{{K_t} \over {Y_t}} {\kern 1pt} \forall i.$$
While our assumption of frictionless international capital markets implies that capital intensities, k t,i , adjust such that the rate of return is equalized across regions, human capital is immobile by assumption. Hence, wages differ across regions and are a function of the country-specific productivity A t,i .
Definition 2
A stationary equilibrium is a competitive equilibrium in which per capita variables grow at constant rate
 $1 + \bar g^A $
and aggregate variables grow at the constant rate
$1 + \bar g^A $
and aggregate variables grow at the constant rate
 $(1 + \bar g^A )(1 + n)$
.
$(1 + \bar g^A )(1 + n)$
.
2.8 Thought experiments
The exogenous driving force of our model is the time-varying and region-specific demographic structure. The solution of our model is done in two steps. We first assume that both regions are closed and solve for the region-specific artificial initial steady state. We then compute the closed economy equilibrium transition paths to the new steady state. While computing the transition paths, we include sufficiently many ‘phase-in’ and ‘phase-out’ periodsFootnote 12 to ensure convergence. We recompute the equilibrium transition path assuming open capital markets. To display the effects of our PR on macroeconomic variables we report simulation results for the main projection period of interest, from 2000 to 2050. To capture the welfare effects of the PR, changes in welfare are reported for agents alive in 2010. We use data from 1960 to 2005 in order to calibrate the vector of structural model parameters (cf. Section 3).
Our baseline model variant (which is also used in calibration) is one with endogenous human capital for the baseline retirement age. We use the results from this model variant to compute average time investment for the accumulation of human capital and the associated human capital profile. We use this as input in the alternative model with exogenous human capital. Specifically, we obtain the life-cycle profile of time investment into education
 $\bar e_{j,i} $
for each age j = 1, 2,…, J by averaging over all life-cycle profiles of agents living during the calibration period.Footnote
13
The corresponding human capital profile is computed by using the time series
$\bar e_{j,i} $
for each age j = 1, 2,…, J by averaging over all life-cycle profiles of agents living during the calibration period.Footnote
13
The corresponding human capital profile is computed by using the time series
 $\bar e_{j,i} $
in (3).
$\bar e_{j,i} $
in (3).
3 Calibration and computation
The calibration of the model is standard. We choose parameters such that simulated moments match their counterparts in the data. For the wage profile, we choose parameters such that the endogenous wage profiles match the empirically observed wage profile during the calibration period 1960–2005 (cf. Section 3.3).Footnote 14 We provide a condensed overview over all parameters in Table 1.
Table 1. Model parameters

Notes: ‘ROW’ and ‘FGI’ refer to the region. Only one value in a column indicates that the parameter is identical for both regions.
3.1 Demographics
Population data from 1950 to 2005 are taken from the United Nations (2007). For the period until 2050 we use the same data source and choose the UN's ‘medium’ variant for the fertility projections. However, we have to forecast population dynamics beyond 2050 to solve our model. The key assumptions of our projection are as follows: First, for both regions the total fertility rate is constant at 2050 levels until 2100. Then we adjust fertility such that the number of newborns is constant for the rest of the simulation period. Second, we use the life expectancy forecasted by the United Nations (2007) and extrapolate it until 2100 at the same (region and gender-specific) linear rate.Footnote 15 Then we assume that life expectancy in FGI stays constant. Life expectancy in ROW keeps rising until it reaches the level in FGI by the year 2300. These assumptions imply that a stationary population structure is reached in about 2200 in the old nations and in 2300 in the rest of the world. Our assumptions ensure that a steady state is reached eventually also in the economic model which is necessary to close the dynamics of the system. At the same time, we choose these somewhat artificial and technically convenient adjustments to take place in the distant future, so that their impact on our window of interest – years 2000 to 2050 – is negligible.
3.2 Households
We set σ to 2. This corresponds to a standard estimate of the IES of 0.5 (Hall, Reference Hall1988). The pure time discount factor β is chosen to match a capital-output ratio of 2.9 in FGI which requires β = 0.99. To calibrate the weight of consumption in the utility function, we set φ = 0.37 by targeting an average labor supply of one-third of the total available time. We constrain the parameters of the utility function to be identical across regions.
3.3 Individual productivity and labor supply
We follow Ludwig et al. (Reference Ludwig, Schelkle and Vogel2012) and choose the parameters of the human capital production function such that average wage profiles resulting from endogenous human capital model replicate empirically observed wage profiles. As in Börsch-Supan et al. (Reference Börsch-Supan, Härtl and Ludwig2014) we assume that an estimated age productivity profile for the USA is a good proxy for the age productivity in region FGI. Our estimates are based on PSID data, adopting the procedure of Huggett et al. (Reference Huggett, Ventura and Yaron2012). Accordingly, life-cycle efficiency peaks at around age 50 when it is about 60% higher than at labor market entry. This is in line with estimates by Fitzenberger et al. (Reference Fitzenberger, Hujer, MaCurdy and Schnabel2001) for Germany. After normalizing the initial value of human capital to h
0 = 1, we determine the value of the structural parameters
 $\{ \xi _i, \psi _i, \delta _i^h \} _{i = 1}^I $
using indirect inference methods (Gourieroux et al. Reference Gourieroux, Monfort and Renault1993; Smith Reference Smith1993). To do this, we run regressions on the wage profiles obtained from the simulation and the observed data on a 3rd-order polynomial in age defined as
$\{ \xi _i, \psi _i, \delta _i^h \} _{i = 1}^I $
using indirect inference methods (Gourieroux et al. Reference Gourieroux, Monfort and Renault1993; Smith Reference Smith1993). To do this, we run regressions on the wage profiles obtained from the simulation and the observed data on a 3rd-order polynomial in age defined as
 $$\log w_{\,j,i} = \lambda _{0,i} + \lambda _{1,i} j + \lambda _{2,i} j^2 + \lambda _{3,i} j^3 + \varepsilon _{\,j,i}. $$
where w
j,i
denotes the age-specific productivity. We write the coefficient vector from the regression on the observed wage data as
 $\lambda _i^d = [\lambda _{1,i}, \lambda _{2,i}, \lambda _{3,i} ]'$
and the one from the simulated human capital profile of cohorts born in 1960–2005 by
$\lambda _i^d = [\lambda _{1,i}, \lambda _{2,i}, \lambda _{3,i} ]'$
and the one from the simulated human capital profile of cohorts born in 1960–2005 by
 $\hat \lambda^{s} = [\hat \lambda_{1,i}, \hat \lambda_{2,i}, \hat \lambda_{3, i}]^{\prime}$
. The vector
$\hat \lambda^{s} = [\hat \lambda_{1,i}, \hat \lambda_{2,i}, \hat \lambda_{3, i}]^{\prime}$
. The vector
 $\hat \lambda^{s}$
is then a function of the deep structural parameters
$\hat \lambda^{s}$
is then a function of the deep structural parameters
 $\{ \xi _i, \psi _i, \delta _i^h \} _{i = 1}^I $
. We choose the values for the structural parameters by minimizing the distance between the values of the polynomial obtained from the regression on the actual data and the simulated data, i.e., by minimizing
$\{ \xi _i, \psi _i, \delta _i^h \} _{i = 1}^I $
. We choose the values for the structural parameters by minimizing the distance between the values of the polynomial obtained from the regression on the actual data and the simulated data, i.e., by minimizing
 ${\rm \parallel} \lambda _i^d - \hat \lambda _i^s {\rm \parallel} \ \forall i$
; see Section 3.6 for computational details.
${\rm \parallel} \lambda _i^d - \hat \lambda _i^s {\rm \parallel} \ \forall i$
; see Section 3.6 for computational details.
As the demographically younger region ROW is a mix of developing and developed countries, we cannot use the profile from FGI. Instead, we take the polynomial estimated on the US-profile and scale coefficient the λ 1 by a factor of 0.95. The resulting age-wage profile corresponds to a profile estimated on Mexican data by Attanasio et al. (Reference Attanasio, Kitao and Violante2007). This choice is motivated by the fact that GDP per capita of Mexico is very close to the global (weighted) average corresponding to region ROW. The main difference between the two profiles is that wages in the US drop by 10% and Mexican wages by 20% from their peak to retirement age and that the maximal wage in the USA is about 100% higher than the wage at entry into the labor market. The same number in Mexico is about 90%. Attanasio et al. (Reference Attanasio, Kitao and Violante2007) attribute these differences – US profiles are steeper and drop less toward the end of working life – to differences in the physical requirements in the two economies. The flatter profile probably reflects less human capital intensive and more physically demanding tasks of the ‘representative’ worker. Further supportive evidence on flatter profiles is provided by Lagakos et al. (Reference Lagakos, Moll, Porzio and Qian2012). Using a panel with 48 developing and developed countries, they find that age-experience profiles are much steeper in developed countries.
Figure 2 presents the empirically observed productivity profile and the estimated polynomials for the different regions. The coefficientsFootnote 16 and the shape of the wage profile are in line with the literature; see, e.g., Altig et al. (Reference Altig, Auerbach, Kotlikoff, Smetters and Walliser2001) and Hansen (Reference Hansen1993). The value of ψ ≈ 0.60 is also in the middle of the range reported in Browning et al. (Reference Browning, Hansen, Heckman, Taylor and Woodford1999). The depreciation rate of human capital is δ h = 1.4% for ROW and δ h = 0.9% for FGI. Although there is a considerable disagreement about δ h in the literature, our numbers are in a reasonable range; see, e.g., Arrazola and de Hevia (Reference Arrazola and de Hevia2004), and Browning et al. (Reference Browning, Hansen, Heckman, Taylor and Woodford1999).

Figure 2. Wage Profiles.
Notes: Data standardized by the wage at the age 23. Source: PSID, own calculations.
We adjust the parameters of the human capital production function such that they are eventually identical in both regions. To this end we parameterize the adjustment path and calibrate it such that parameters start to change for the cohort born in year 2100 and are identical for the cohort born in year 2300. We denote the vector of parameters
 $\{ \xi _i, \psi _i, \delta _i^h \} = \vec \chi _i $
and assume that
$\{ \xi _i, \psi _i, \delta _i^h \} = \vec \chi _i $
and assume that
 $$\vec \chi _{i,k} = \vec \chi _{i \ne j,k} + \Delta (\hskip1pt\chi _{\,j,k} ) \cdot t,\quad k = 1,2,3,$$
for the adjustment process where Δ(χ j,k ) denotes the per period linear adjustment of the parameter, t is the length of the adjustment period, and k is an element from χ i .
3.4 Production
The production elasticity of capital is set to α = 0.33 such that we match the share of capital income in national accounts. The average growth rate of TFP,
 $\bar g_i^A $
, is calibrated such that we match the region-specific growth rate of GDP per capita, taken from Maddison (Reference Maddison2003). Growth of output per capita in FGI during our calibration period is 2.8%. Accordingly, we set the growth rate of TFP to 1.85% to meet our calibration target. To match the observed growth of GDP per capita of 2.2% in ROW, we let TFP grow at a rate of 1.5%. From 2100 onwards we let the growth rate of TFP in ROW adjust smoothly to the growth rate in FGI. This adjustment process is assumed to be completed in 2300. Further, we compute relative GDP per capita from Maddison (Reference Maddison2003) for both regions in 1950 and use this ratio to calibrate the relative productivity levels at the beginning of the calibration period. Initially, per capita GDP in ROW is only 20% of income per capita in the old nations. Finally, we calibrate δ such that our simulated data match an average investment output ratio of 20% in FGI which requires δ = 0.035.
$\bar g_i^A $
, is calibrated such that we match the region-specific growth rate of GDP per capita, taken from Maddison (Reference Maddison2003). Growth of output per capita in FGI during our calibration period is 2.8%. Accordingly, we set the growth rate of TFP to 1.85% to meet our calibration target. To match the observed growth of GDP per capita of 2.2% in ROW, we let TFP grow at a rate of 1.5%. From 2100 onwards we let the growth rate of TFP in ROW adjust smoothly to the growth rate in FGI. This adjustment process is assumed to be completed in 2300. Further, we compute relative GDP per capita from Maddison (Reference Maddison2003) for both regions in 1950 and use this ratio to calibrate the relative productivity levels at the beginning of the calibration period. Initially, per capita GDP in ROW is only 20% of income per capita in the old nations. Finally, we calibrate δ such that our simulated data match an average investment output ratio of 20% in FGI which requires δ = 0.035.
3.5 The pension system
In our first social security scenario (‘const. τ’) we fix contribution rates and adjust replacement rates of the pension system. Since there are no yearly data on contribution rates for sufficiently many countries, we use data from Palacios and Pallarés-Miralles (Reference Palacios and Pallarés-Miralles2000) for the mid-1990s and assume that the contribution rate was constant through the entire calibration period. On the individual country level, we use the pension tax as a share of total labor costs weighted by the share of contributing workers to compute a national average. Then we weight these numbers by total GDP to compute separately a representative number for the two world regions. The contribution rate in the young (old) region is then 7.8% (11.3%). Given the initial demographic structure, the replacement rate is 77.4% (63.4%) in the young (old) region. In our baseline social security scenario, we freeze the country-specific contribution rate at the level used for the calibration period for all following years. We also assume that the retirement age is fixed at 65 years and agents do not expect any change. We label this scenario as ‘Benchmark’ (‘BM’) in the following analysis.
For the second type of policy reform we increase the retirement age by linking it to remaining life expectancy at age 65 (the current retirement age). We assume that for an increase in conditional life expectancy by 1.5 years, retirement increases by one year. We model this change – labeled ‘Pension Reform’ (‘PR’) – by assuming that this reform affects already workers in the labor market in 1955 (birth cohort 1939) by raising their retirement age immediately by one year and thereby effectively increasing the number of workers already in 2001. We then apply this rule for all following cohorts. This pattern mimics recent PRs in many old countries, e.g., recent PRs in Germany. The reform has direct effects via lengthening expected lifetime labor supply of workers and changing prices for retirees. Given our projections of life expectancy, the retirement age will eventually settle down at 71 years, a value also discussed in the public debate about PRs. We show the stepwise increase in the retirement age in Figure 3 as a function of the respective labor market cohort.

Figure 3. Retirement Age.
Notes: The jumps in the broken line indicate the labor market cohort which is affected by the change in the retirement age and not the actual time when the number of workers is increasing.
3.6 Computational method
For a given set of structural model parameters, we solve the model by iterating on household related variables (inner loop) and aggregate variables (outer loop). In the outer loop, we solve for the equilibrium by making an initial guess about the time path of the following variables: the capital intensity, the ratio of bequests to wages, the replacement rate (or contribution rate) of the pension system and the average human capital stock for all periods from t = 0, 1,…, T. For the open economy we impose the restriction of identical capital intensity for both regions but require all other variables from above to converge for each country separately. On the household level (inner loop), we start by guessing c J , hJ , i.e., the terminal values for consumption and human capital. Then we iterate on them until convergence of the inner loop as defined by some metric. In each outer loop, household variables are aggregated in each iteration for all periods. Values for the aggregate time series are then updated using the Gauss–Seidel–Quasi-Newton algorithm suggested in Ludwig (Reference Ludwig2007) until convergence.
To calibrate the model (we do this in the ‘const. τ’ scenario, BM retirement), we run additional ‘outer outer’ loops on the vector of structural model parameters in order to minimize the distance between moments computed from the simulated data and their corresponding calibration targets for the calibration period 1960–2005. In a nutshell, the common parameter values determined in this procedure are β, φ, δ and the country-specific parameters of the human capital production function are
 $\{ \xi _i, \psi _i, \delta _i^h \} $
.
$\{ \xi _i, \psi _i, \delta _i^h \} $
.
4 Results
Our prime focus is to work out the effects of a parametric PR – the increase of the retirement age as described above – on macroeconomic aggregates and on welfare of households living through the demographic transition. We divide the presentation of results into three parts. Section 4.1 looks at the evolution of macroeconomic aggregates such as the replacement rate of the pension system, the rate of return to capital, aggregate labor supply and detrended GDP per capita in closed and open economies with exogenous or endogenous human capital formation. As this analysis shows, a key factor is the endogenous reaction of labor supply and human capital formation. To shed more light on the interplay between these margins, we ask in Section 4.2 how much of the exogenous increase in the retirement age (extensive margin) is potentially offset by adverse endogenous labor supply reactions at the intensive margin. Finally, Section 4.3, evaluates the welfare consequences for households who live through the demographic transition. Throughout, we focus the analysis on a pension scenario with constant contribution rates. Once these effects are understood, the consequences under the polar case of constant replacement rates immediately follow. We briefly discuss those in Section 4.4, relegating all details to the online Supplementary Appendix.
4.1 Macroeconomic aggregates
Figure 4 shows the evolution of the replacement rate for the benchmark pension system (‘BM’) and the pension reform (‘PR’). Keeping the contribution rate unchanged during the entire period at 11.3% requires a drop in the replacement rate to about 28% until 2050. This decline in the replacement rate is substantially dampened by the pension reform (‘PR’). Because of the constant contribution rate, the distortions for labor supply and human capital investment decisions are similar across human capital model variants. Hence, differences between endogenous and exogenous human capital formation are small.

Figure 4. Adjustment of the Replacement Rate. Notes: ‘Open’ and ‘Closed’ refer to the results obtained from the closed and open economy versions. ‘PR’ and ‘BM’ denote the pension reform and benchmark retirement scenario. All results obtained with constant contribution rate, τ.
Figure 5 shows the evolution of the rate of return as an index. The index is constructed such that we normalize the closed economy rate of return to zero in 2000 in both the exogenous (left panel) and the endogenous human capital (right panel) model. Thereby the change of the rate of return caused by the ongoing demographic change in the two respective model variants can be immediately read off. At the same time we normalize the open economy rate of return such that the return differential between the open and the closed economy in year 2000 is made explicit. In both panels, we observe the well-established finding of falling returns due to demographic change. While the level of the rate of return in the year 2000 is higher in the open economy scenario, it decreases more strongly. The reason is that countries outside FGI are currently younger in terms of levels of the key demographic indicators, but age more rapidly after about year 2015; cf. Figure 1. Furthermore, the overall decrease of the rate of return is quite substantially dampened if human capital adjusts endogenously. Relative scarcity of raw labor, abundance of physical capital, and the associated decrease of the rate of return and increase of wages, trigger human capital investments in the endogenous human capital model; also see Figure 6 below. As a consequence of this feedback, the capital intensity increases by less and the rate of return correspondingly falls by less. Finally, the PR increases the supply of raw labor thereby leading to a lower reduction of the rate of return in the closed economy. In the open economy, however, this effect dissipates because region FGI, in which the reform takes place, is small relative to the rest of the world. Therefore the return is virtually unaltered between the BM and the PR scenarios.

Figure 5. Rate of Return [Index]. (a) Exogenous Human Capital. (b) Endogenous Human Capital.
Notes: ‘Open’ and ‘Closed’ refer to the results obtained from the closed and open economy versions. ‘PR’ and ‘BM’ denote the pension reform and benchmark retirement scenario. All results obtained with constant contribution rate, τ.

Figure 6. Effective Labor Supply per Worker [Index]. (a) Exogenous Human Capital (b) Endogenous Human Capital.
Notes: ‘Open’ and ‘Closed’ refer to the results obtained from the closed and open economy versions. ‘PR’ and ‘BM’ denote the pension reform and benchmark retirement scenario. All results obtained with constant contribution rate, τ.
Figure 6 shows effective labor supply – i.e., hours worked times human capital weighted with the respective population shares and summed across all ages – relative to the total number of workers – i.e., the population aged 16–64 – again for the exogenous human capital model in the left and the endogenous human capital model in the right panel. We normalize the simulated time series of effective labor supply per worker to one in year 2000. In case of exogenous human capital, labor supply per worker increases by slightly more than 10% until 2050 in the most optimistic scenario, i.e., the scenario PR in the open economy. In case of endogenous human capital adjustments, however, this increase is far more pronounced with total effective labor supply per worker increasing by 40% until year 2050. As explained above, this is a consequence of the strong incentives to invest into human capital, triggered by relative price movements in aging economies. In the PR model, this is further amplified by the extension of the working life and the associated incentives to increase human capital investments; also see Section 4.2 below.
Finally, we investigate the evolution of GDP per capita in Figure 7, again expressed as an index. We detrend by the constant growth factor. In consequence, the normalization is such that detrended GDP per capita would stay at the constant value of 1 in a stationary economy. In case of exogenous human capital (left panel), we confirm findings from the earlier literature simulating a decrease of detrended GDP per capita in light of demographic change caused by the relative scarcity of labor; cf., e.g., Krüger and Ludwig (Reference Krüger and Ludwig2007) and Ludwig et al. (Reference Ludwig, Schelkle and Vogel2012). The decrease is less strong in the open economy and basically absent in scenario PR for the open economy. In case of endogenous human capital adjustments, the increase of human capital already documented above leads to a substantial increase of GDP per capita by up to about 25% until 2040 in scenario PR for the open economy.

Figure 7. Detrended GDP per Capita [Index]. (a) Exogenous Human Capital (b) Endogenous Human Capital.
Notes: ‘Open’ and ‘Closed’ refer to the results obtained from the closed and open economy versions. ‘PR’ and ‘BM’ denote the pension reform and benchmark retirement scenario. All results obtained with constant replacement rate τ.
4.2 Labor supply over the life cycle
To understand the effects of the PR on aggregate hours and human capital, it is key to understand the response over the life cycle. Theoretical insights into these life-cycle effects are developed in online Appendix B using a simple two-period model. To shed light on these adjustments quantitatively, we isolate the effects induced by a change in the retirement age from changes induced by general equilibrium feedback.
Results of this decomposition analysis for the closed economy are summarized in Figure 8 as percent deviations from the BM life-cycle profile.Footnote 17 Ignoring general equilibrium adjustments and human capital accumulation, an increase in the retirement age has a negligible impact on labor supply at the intensive margin early in life but labor supply decreases considerable at higher ages. With both margins of adjustment at work (‘Both Endogenous’) the young invest more time in education and hence labor supply decreases relative to the BM. Older agents work more to reap the benefits of higher levels of human capital. In a nutshell, when both are endogenous, agents substitute labor supply against human capital early in life. These predictions are consistent with the theoretical model in the online Appendix B; cf. equation (31). Finally, in general equilibrium, the endogenous labor supply and human capital response leads to higher pension payments, lower increases in wages and relatively higher interest rates. This mitigates the incentives to invest in human capital and increases (decreases) labor supply when young (old) relative to the case with constant prices. As a consequence, once all general equilibrium adjustments are considered, incentives to work and invest into human capital are weakened. The total effect on the intensive margin of labor supply is negative (see Table 2). Turning to the human capital investment, we observe that with human capital and labor supply being endogenous, there is a sizable positive effect of a longer working life on human capital. Similarly to labor supply, the general equilibrium effects dampen the increase via relatively lower wages and relatively higher interest rates.

Figure 8. Reallocation over the Life Cycle. (a) Change in Labor Supply, Constant τ (b) Change in Human Capital, Constant τ.
Notes: ‘Endogenous’ and ‘Exogenous’ refer to the human capital production profile. Results with closed capital markets.
Table 2. Change in life-cycle allocations

Notes: ‘Intensive’ refers to the total amount of effective labor supply up to the ‘old’ retirement age (as defined in the ‘BM’ scenario), ‘total’ adds the additional working year. The variables reported (title of column) is always the endogenous variable, the other is assumed to be exogenous (see description of methodology above). The upper (lower) panel refers to the open (closed) economy scenario.
Table 2 documents the total effect of these behavioral adjustments as the sum of changes of life-cycle allocations shown in Figure 8. Moving from left to right in the table, we observe lower labor supply at the intensive margin in partial equilibrium. The drop in hours worked is smallest when education and hours worked are simultaneously endogenous. However, this is compensated by the additional working year which leads to a sizable increase in total labor supply. We can therefore conclude that the exogenous increase of the retirement age has a significant impact on total aggregate effective labor supply mainly by inducing agents to work more in the marginal year and investing more into human capital. On the contrary, reactions at the intensive margin only shift allocations over the life cycle with a small total negative effect. Analyzing the results of the same reform in an open economy gives qualitatively the same findings. There, the difference between the scenarios ‘Both Endogenous’ and ‘GE effect’ is negligible.
Such quantitative responses are in line with empirical estimates. As Mastrobuoni (Reference Mastrobuoni2009) shows, more than half of the increase in retirement age in the USA is taken up by agents. In Table 2 (rightmost column), we show that the increase in hours in the additional year corresponds to an implicit pass-through of roughly 1/2 to 2/3 which we believe to be a reasonable approximation of the empirical results. If workers would work full time, an increase in the retirement age by 1 year constitutes an increase of total time by about (1/(65 − 16)) ≈ 0.02. However, total hours worked over the working life increase by only about 1.0–1.3% which is a pass-through of about between 1/2 and 2/3.
4.3 Welfare
In our model, households are affected by three distinct consequences of demographic change and policy reform. First, for given prices utility increases because survival probabilities increase. Second, households are affected by changes in prices and transfers due to general equilibrium effects of aging. For cohorts currently alive, these profound changes can have – depending on the position in the life cycle – positive or negative welfare effects. Third, when the retirement age is increased, a constraint is relaxed which will lead to welfare gains.
Furthermore, as shown above, increasing the retirement age in the closed economy leads to higher levels of rates of return (lower wages) and lower decreases of the rate of return as societies are aging – cf. Figures 5(b) and 5(a) – with associated feedback into welfare consequences.
We want to isolate and quantify the effect of changing prices, taxes and transfers as well as increasing the retirement age on households’ lifetime utility. To this end, we first compute the (remaining) lifetime utility of an agent of age j born in year t using the full set of (time varying) general equilibrium prices, taxes and transfers. Then, we hold all prices and transfers constant at their respective year 2010 value and recompute agents' remaining lifetime utility. For both scenarios we keep survival probabilities constant at their year 2010 values. We compute the consumption equivalent variation, g t,j,i , i.e., the percentage of consumption that needs to be given to the agent at each date for her remaining lifetime at prices from 2010 in order to make her indifferent between the two scenarios. Positive values of g t,j,i thus indicate welfare gains from the general equilibrium effects of aging.Footnote 18 In order to isolate the effects of changing prices, taxes and transfers, we do not account for the gain in households’ lifetime utility during the additional life years generated by the increase in life expectancy.
4.3.1 Welfare of generations alive in 2010
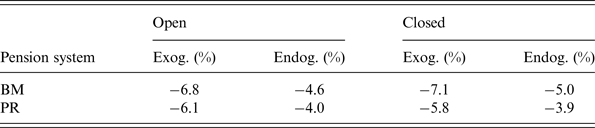
Results on welfare for generations alive in 2010 are displayed in Figure 9 and can be summarized as follows: in the closed economy versions, newborns in 2010 marginally benefit from demographic change, confirming earlier findings in the literature by, e.g., Krüger and Ludwig (Reference Krüger and Ludwig2007) and Ludwig et al. (Reference Ludwig, Schelkle and Vogel2012). Hence we find that, when the contribution rate is held constant, increasing wages dominate for newborn households who experience welfare gains. The converse applies to old and asset rich households. In welfare terms, the increase of wages dominates the reduction of the rate of return for this group. Recall that we hold the contribution rate constant so that any increase in gross wages feeds one to one into an increase in net wages. These gains vanish in the open economy variants because here the relative price movements are less favorable for this cohort. Table 3 provides a summary. All other generations are losing with losses peaking around age 52. The reason is relative asset richness and hence lower asset income from decreasing interest rates. These losses are substantially lower in the endogenous human capital model variants and decrease to about 4% in the PR scenarios (Table 4).

Figure 9. Consumption Equivalent Variation of Agents alive in 2010, Constant τ. (a) Exogenous Human Capital (b) Endogenous Human Capital.
Notes: ‘Open’ and ‘Closed’ refer to the results obtained from the closed and open economy versions. ‘PR’ and ‘BM’ denote the pension reform and benchmark retirement scenario. All results obtained with constant contribution rate, τ.
Table 3. Welfare gains/losses – newborns 2010
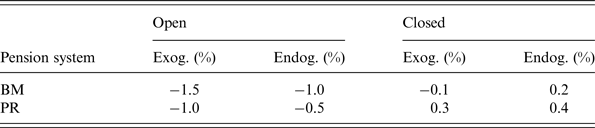
Notes: ‘Endog.’ and ‘Exog.’ refer to the endogenous and exogenous human capital production profile. ‘Open’ and ‘Closed’ refer to the results obtained from the closed and open economy versions. ‘PR’ and ‘BM’ denote the pension reform and benchmark retirement scenario. All results obtained with constant contribution rate, τ.
Table 4. Maximum welfare losses – agents alive 2010
Notes: ‘Endog.’ and ‘Exog.’ refer to the endogenous and exogenous human capital production profile. ‘Open’ and ‘Closed’ refer to the results obtained from the closed and open economy versions. ‘PR’ and ‘BM’ denote the pension reform and benchmark retirement scenario. All results obtained with constant contribution rate, τ.
4.3.2 Welfare of future generations
We now report welfare changes for newborns between 2010 and 2050 in Figure 10. In the closed economy model with endogenous human capital adjustments and the PR, all newborn generations are benefiting from the reform. While all future newborn generations generally lose from demographic change in the open economy, they are substantially better off if the PR takes place.

Figure 10. Consumption Equivalent Variation of Future Generations, Constant τ. (a) Exogenous Human Capital (b) Endogenous Human Capital.
Notes: ‘Open’ and ‘Closed’ refer to the results obtained from the closed and open economy versions. ‘PR’ and ‘BM’ denote the pension reform and benchmark retirement scenario. All results obtained with constant contribution rate, τ.
4.4 Results with fixed replacement rate
Our analysis concentrated on the case with a constant contribution rate, τ. We here briefly comment on how these results change when we consider the polar pension scenario with a constant replacement rate, ρ. All details are relegated to the online Supplementary Appendix. The upshot of that analysis is that the endogenous increase of the contribution rate caused by demographic change in a world with constant replacement rates leads to a mitigation of the effects on the effective labor supply. Effective labor supply per worker increases only by roughly 10% in the open economy PR scenario, compared with 40% observed for the pension scenario with constant contribution rates. As the pension system is now rather generous, households do not build up that much retirement savings. Therefore, the increase of the capital intensity is not as strong as in the constant τ scenario with the consequence that the reduction of the rate of return is smaller. On top of this effect, keeping ρ constant causes a substantial increase in the labor market distortions due to a higher τ. These trends of capital formation and effective labor supply in comparison to the constant τ scenario also imply that GDP per capita increases less strongly. Overall, the effects of the PR are slightly less pronounced. In terms of welfare, all generations currently alive as well as all future generations experience losses from demographic change under constant replacement rates. These losses are somewhat mitigated under the pension reform PR but the effect is far less positive than we observed for the constant τ scenario.
5 Conclusion
This paper revisits the literature on the consequences of demographic change – aging – for welfare of generations who live through the demographic transition in industrialized countries focusing on FGI in a globalized world. We ask how the potentially detrimental consequences of aging for FGI may be mitigated by two margins of adjustment, namely by investing abroad and by human capital formation. We address this question in combination with pension policy. That is, we ask how the design of pension policy may contribute via these endogenous channels.
We conclude that endogenous human capital adjustments in combination with a pension policy reform by increasing the retirement age and a constant contribution rate has strong implications, both, for economic aggregates such as the future trends of per capita output and for welfare. Welfare losses of currently 50-year-old households decrease by roughly 3 percentage points when such adjustments take place. Furthermore, we emphasize that world prices are influenced by global demographic developments. Hence a fundamental PR in FGI (in isolation) has very strong effects on per capita output because mitigating general equilibrium feedback is largely absent. Therefore, labor market policies focusing at the extensive margin (by increasing the retirement age) and adjustments at the education margin are powerful policy options to mitigate the adverse welfare effects of demographic change.
However, we ignore the endogenous adjustment of retirement to policy, as done by, e.g., Heijdra and Romp (Reference Heijdra and Romp2009b ) and Buyse et al. (Reference Buyse, Heylen and Van de Kerckhove2012). While we document that our estimates of endogenous labor supply adjustments to changes in the exogenous reform of the retirement age are reasonable, one may still argue that it is important to explicitly model the endogenous choice of retirement at the extensive margin. However, our approach is a valid first-order approximation. In order to replicate actual retirement patterns observed in the data, a model with endogenous retirement requires the specification of pension pay adjustment factors for late/early retirement. These adjustment factors would also change with a reform that increases the statutory retirement age. Such a reform was recently implemented, e.g., in Germany. Moreover, as such adjustment factors do not suffice to replicate actual retirement patterns, specification and calibration of some fixed costs of work participation is needed as, e.g., in French (Reference French2005) and Fehr et al. (Reference Fehr, Kindermann and Kallweit2013). It is reasonable to assume that such fixed costs decrease as health and therefore life expectancy is improving. For these reasons, the average and the statutory retirement age would co-move in such an extended model.
Furthermore, in our work, all endogenous human capital adjustments are driven by relative price changes, increases in life expectancy and increases of the statutory retirement age. If, instead, human capital formation is affected by market imperfections, such as borrowing constraints, then these automatic adjustments will be inhibited. In this case, appropriate human capital policies in combination with pension policies are an important topic for future research and the policy agenda.
Supplementary material
To view supplementary material for this article, please visit http://dx.doi.org/10.1017/S1474747215000086