


1. INTRODUCTION
Navigation and manoeuvring simulators are increasingly being used in research centres to conduct complex navigation experiments and analyses. The structure and capabilities of simulation software make it possible to reproduce any conditions, including weather conditions. The complex mathematical models of marine environmental conditions that are being implemented nowadays take into account various sea wave models, which makes simulation tests more realistic. Irrespective of the software manufacturer, these mathematical models consist of two main parts, a model of the environment and a model of a vessel. A simulator user can only edit and create virtual vessels and sea areas, and he/she has no control over the mechanisms ruling the meteorological phenomena such as wind, or sea waves. Moreover, additional applications must be used to change vessels' parameters. When choosing a specific item from a list of vessels, the operator does not know anything about a given simulation model's congruence with its real-world counterpart. Manufacturers are only required to obtain software certifications from classification associations, for example, a Det Norte Veritas (DNV) certificate. This paper deals with issues related to evaluating and verifying vessel simulation models based on real-world studies. As a result of the present research project, a methodology for comparing vessel simulation models with their real-life counterparts was developed. A measurement platform was created for the purpose of carrying out real-world studies; it is available at the Institute of Marine Navigation and Hydrography of the Polish Naval Academy. The platform allows its users to obtain information necessary for achieving their goal without causing the users to interfere with marine navigation equipment. One important research step involved developing a procedural algorithm for making real-world measurements. This paper presents the results of using this platform in comparative tests of the manoeuvring elements of real and simulated vessels.
The article consists of five parts:
-
• The algorithm of methodology of vessel simulation model evaluation with the methodology presented in the form of block diagrams indicating actions required to verify the performance of simulation vessel models based on real-world data.
-
• Characteristics of the measurement platform describing the modules and the configuration of the measurement platform registering real manoeuvring parameters of a ship.
-
• Measurements performed under real conditions describing the process of registration of naval ship's manoeuvring parameters used for studies, and presenting a portion of the recorded data.
-
• Simulation study presenting the simulation experiment reflecting real-world study in the simulated environment. The experiment involves preparation of a virtual model of the basin where real-world registration had been performed in the Transas simulated environment and the implementation of the scenario in the simulator corresponding to real-world trials.
-
• Verifying the model of a vessel presenting the results of trials enabling the researchers to identify the differences in behaviours of a simulation model and a real vessel.
2. THE ALGORITHM OF METHODOLOGY OF VESSEL SIMULATION MODEL EVALUATION
In analysing the literature dealing with vessel simulation models, the authors noticed that most articles on this subject are focused on a model's creation rather than on the process of their evaluation and verification (Abkowitz, Reference Abkowitz1964). There are many articles describing the methodology of building simulation models in experimental basins at scale. There is however little information on how they are further assessed in studies in real-world conditions, outside of the information contained in the Pilot Card or Manoeuvring Booklet (NMTRI, 2013). The manoeuvres performed for the sake of acquiring knowledge about ship manoeuvring elements are performed, as recommended by the International Maritime Organization (IMO), in ideal weather conditions. The literature does not provide information on the methodology and evaluation of vessel models in a given simulator with an accompanying measurement methodology. The flowcharts presented below show a suggested course of action which can be taken to determine the degree of congruence between the behaviours of a simulation model and a real vessel. Due to the material's broad scope, this article focuses on the characterisation of elements enabling the registration of manoeuvring parameters of a real vessel, and a simulation experiment. The methodology presented also contains an algorithm based on a mathematical method and an evaluation-supporting application, aimed at the correction of a model's factors. As this article covers the methodology, a thorough description of this component is left for future research.
The general flowchart is presented in Figure 1. Each of the algorithm blocks is composed of specific steps to be taken. One of the most important and also the most difficult elements is the first registration block, which may be presented as in Figure 2.

Figure 1. The general methodology of the studies.

Figure 2. Registration of the navigation parameters in real-world conditions.
3. CHARACTERISTICS OF THE MEASUREMENT PLATFORM
A measurement platform should make it possible to obtain data about a vessel's movement in six degrees of freedom as well as nautical information on the hydro-meteorological conditions in a given sea area. The platform is a mobile and versatile set of instruments with a modular structure which allows one to freely configure the platform so that it suits the purpose of particular studies carried out as well as to assemble and use it on any vessel, regardless of what equipment it has.
The configuration of the measurement system consists of devices that are mounted inside the mobile measurement platform and of external sensors that are connected to this platform, as necessitated by a particular task.
The base configuration of the platform consists of devices that are integrated in one casing, external sensors that are connected to this platform if necessary, as well as an industrial Personal Computer (PC) that records measurements and controls the platform's operation. A mobile device such as a tablet or a smartphone with an operating system that makes it possible to install the controllers of devices working inside the platform can perform the function of an industrial computer.
Among the integrated devices are a Global Navigation Satellite System (GNSS) receiver, an Automatic Identification System (AIS) receiver, a Wireless Fidelity (Wi-Fi) router which transmits the recorded parameters to a measuring computer or other receivers by radio, an NDC-4 National Marine Electronics Association (NMEA) multiplexer which makes it possible to collect data from four sources and send them to a measuring computer through a Universal Serial Bus (USB) port (it is necessary to use a multiplexer because there are no serial ports in the available laptop computers and the number of USB ports is limited), an InSight Radar 2 – Black Box (IR-BB), two converters (Actisense NGW-1, NMEA 2000 TO NMEA 183 (NMEA, 2002) and Actisense NGT-1-USB, NMEA 2000 TO PC (USB) (Spitzer, Reference Spitzer2009)) and a power supply.
These devices, which form an integrated whole, are illustrated in Figure 3.

Figure 3. Block diagram of the measurement platform.
Depending on the type of research being conducted, the platform can be connected to and additionally equipped with an Inertial Navigation System (INS) (Montewka and Gucma, Reference Montewka and Gucma2006), which measures a vessel's movement in six degrees of freedom as well as its position by using a Global Positioning System (GPS) receiver; measurement results are transmitted to the computer through the NMEA 2000 and 0183 ports. Other equipment which may be connected includes a Micro-Electromechanical Systems (MEMS) inclinometer which makes it possible to record data with a frequency of at least 10 Hz, a weather station which allows one to measure the true and relative wind direction and speed as well as air temperature and atmospheric pressure, an ocean current meter, a gyrocompass, a satellite compass, an echo sounder, a measuring computer that collects data from all sensors and an Electronic Chart Display and Information System (ECDIS).
The basic elements of the measurement platform have been installed in a 19-inch rack case, which is used for mounting servers. Figure 4 shows the platform together with the measuring industrial PC.

Figure 4. Measurement platform and the industrial PC.
4. MEASUREMENTS PERFORMED UNDER REAL CONDITIONS
In order to check the platform's functionality, a range of measurement series was carried out on ships of the Polish Navy while at sea. The study was conducted in the years 2012–2015. A ship that was hove to in open (unrestricted) water provided a basis for assessing vessels' behaviour, which made it possible to obtain a test sample that had not been affected by the influence of port infrastructure on the measurement of hydro-meteorological parameters. It is particularly important to take undisturbed measurements of the wind, wave and current fields. Since data was recorded many times under similar hydro-meteorological conditions, it was possible to repeat the measurements and verify them under simulated conditions, which is described later in the paper. During the study, the following navigation parameters were recorded:
-
– the ship's position fix (GNSS receiver),
-
– Course Over Ground – COG (GNSS receiver),
-
– Speed Over Ground – SOG (GNSS receiver),
-
– heading – HDG (gyrocompass),
-
– pitch (INS; inclinometer),
-
– roll (INS; inclinometer),
-
– yaw (INS),
-
– true wind direction (weather station),
-
– true wind speed (weather station),
-
– current speed (current meter),
-
– current direction (current meter),
-
– observed wave height (weather buoy),
-
– observed wave direction (weather buoy).
During the data recording process, a comparative analysis of the results that had been obtained from different sensors showing the angles of inclination of the ship was also carried out. This analysis involved verifying the suitability of inclinometers and low-cost INSs. The inclinometers that are available on the market make it possible to measure inclination angles bi-axially with an accuracy of up to one thousandth of a degree. The resolution and measurement accuracy of these devices depends on their measuring range. Figure 5 shows the devices that were used during the study.

Figure 5. Devices used during the study: a) Inclinometer ACS-080-2-SV00-HH2-CW (MEMS) b) Inclinometer AGS005-2-CA1-H0-2RW c) VectorNav VN-100 (source: authors' archive).
Based on the analysis of the results obtained from different sensors, it was found that MEMS inclinometers provided the most versatile method for measuring inclination angles. They ensured measurement stability and considerable resistance to external factors. A comparison of INSs with inclinometers shows that the former must be calibrated by adjusting the Kalman filter's parameters or turning it off completely before being installed inside a ship's hull. Using INSs that have been calibrated in a standard way will cause the filters to smooth out variations and not to provide raw data. As a result, it becomes increasingly difficult and time-consuming to make measurements. Figure 6 shows a comparison of readings given by the tested devices during one of the measurement sessions.

Figure 6. Comparison of readings given by devices that measure inclinations.
This comparative analysis was based on studies that had been carried out on a training ship of the Polish Navy – ORP Wodnik. Publicly available tactical and technical data is presented in Figure 7.

Figure 7. Tactical and technical data for ORP Wodnik (source: www.mw.mil.pl).
Table 1 shows a portion of data recorded during one of the real-world measurement trials. The measurement results were used to generate similar hydro-meteorological conditions in a simulated environment and to conduct a comparative analysis of a vessel's movement.
Table 1. Portion of data recorded during a measurement session.

5. SIMULATION STUDY
The next research step involved conducting tests in a simulated environment in order to reproduce the hydro-meteorological conditions that had been recorded during the real-world study. The simulation study was carried out by using a navigation and manoeuvring simulator produced by Transas with the Navi-Trainer PRO 5000 software, made available by the Institute of Marine Navigation and Hydrography of the Polish Naval Academy (Transas Marine 2011a, 2011b). The general flowchart of simulation test is presented in Figure 8.

Figure 8. Simulation tests.
In order to reproduce a given vessel's movement under specific conditions, one must use the appropriate model of that vessel and of the sea area (water body) covered by a given study. Since no such area was represented in the simulator's software environment, it was necessary to construct its virtual model for the purpose of the study. This model had to take into account both the geographic coordinate grid and the proper seabed profile containing up-to-date information which had been obtained from a sea probe. Bathymetric data can be obtained from the cells of Electronic Navigational Charts (ENC) or from a ship's echo sounder when measuring actual depths. The Model Wizard is an application that allows one to edit and create water bodies in a simulated environment. It uses S-57 ENC cells as a basis for constructing a body of water by converting them into the TX-97 format, which is utilised by the software. During this process, the basic shoreline is generated along with navigation marks and bathymetric characteristics. A detailed methodology for modelling a water body is presented in Czaplewski and Zwolan (Reference Czaplewski and Zwolan2009). Figure 9 shows a visualisation of one of the test sea areas which is located near Lawica Slupska.

Figure 9. Model of the test sea area.
If a simulation study is to be complete and if its results are to be reliable, a simulation model of a vessel must be used. In order to achieve the aim of this study, a vessel's mathematical model was created in the Virtual Shipyard software environment based on a design project and stability calculations. An algorithm for creating a vessel's virtual model in a simulated environment is described in Czaplewski and Zwolan (Reference Czaplewski and Zwolan2014).
Manoeuvring tests must be carried out under simulated conditions that are as similar as possible to the real conditions that were observed during a study. Constructing a model of a weather zone with parameters that are identical to those recorded while at sea is the most important stage of manoeuvring tests. The simulation software allows one to select the appropriate sea wave model depending on the sea area in which a vessel is to be moving. The Joint North Sea Wave Project (JONSWAP) wave model, which was designed for the North Sea, is the most suitable for the Baltic Sea (Michel, Reference Michel1999; SCoW, 2002). Due to its characteristics, this model is often used in studies and analyses that are conducted with respect to coastal sailing in restricted waters. Figure 10 presents the studied area together with the simulated weather conditions.

Figure 10. Model of a weather zone constructed for the purpose of the simulation tests.
After a simulation study has been carried out, one should generate a report detailing the progress of the study and presenting particular parameters which will then be compared with the parameters of an actual vessel. A detailed analysis can be carried out by recreating a log file, in which the parameters of a given vessel's movement are recorded at one-second intervals.
6. VERIFYING THE MODEL OF A VESSEL
The verification process involves comparing a simulation study with a real-world study as well as defining the differences in the behaviour of a simulation model and its real-world counterpart. The results can be used to edit the model and check if the editing process was correct. The text below presents the results of the comparison between a simulation model and an actual vessel. The results of the analyses were obtained by using the recorded data and the manoeuvring elements that were available from the pilot card and the manoeuvring booklet (ABoS, 2006). Since this paper is limited in length, the authors decided to present the results of analysing several major elements of the vessel's movement.
6.1. Heading
The analysis of the course that was indicated on the gyrocompass shows that the real-world vessel was quicker to stabilise its course and almost always kept a steady course when drifting, while the simulation model achieved a much larger drift angle (Figure 11).
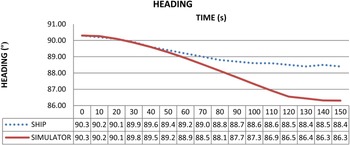
Figure 11. Comparison of the courses as indicated by a gyrocompass.
6.2. Speed over Ground
A comparison of the model's and the real-world vessel's speeds over ground shows that this value was set at about 0·45 knots for the simulation model, whereas the actual vessel drifted at about 0·65 knots. After analysing the mathematical model's coefficients, it was determined that the simulation model was considerably different from the real-world vessel in terms of the area of the above-water lateral plane (Figure 12).

Figure 12. Comparison of the speeds over ground.
6.3. Course over Ground
An analysis of the model's and the real-world vessel's directions of movement relative to the seabed, which are visualised in Figure 13, shows that there were considerable differences between them. This may have been caused, for example, by an erroneous distribution of the above-water planes in the bow and stern areas. The problem of differences in drift speeds and directions does not lie in ignoring the current or wave parameters as this difference is observed repeatedly in the analysis of more than a dozen cases. For this reason, in the analysis performed by the authors, only low wave parameters were admitted so as to avoid errors in the evaluation of wave height and direction.

Figure 13. Comparison of courses over ground.
6.4. Pitch and Roll
A comparison of the model's and the actual vessel's pitch and roll values (Figures 14 and 15) shows that there were no major differences between the virtual and the real vessel in terms of these angle values, which were in the range of tenths of a degree. However, there was a significant difference in frequency of pitches and rolls. The differences may have resulted from the difficulties with determining the exact direction, length and frequency of sea waves and describing wave direction in a simulated environment. The problem with analysing the vessel's roll and pitch lies in different time samples. The simulator enables the registration of these parameters at a frequency of 1 Hz and with the devices connected to the platform - at a frequency as high as 100 Hz.

Figure 14. Comparison of the pitch values.

Figure 15. Comparison of the roll values.
7. CONCLUSIONS
The measurement apparatus that has been constructed and tested as part of the present study makes it possible to quickly record a large number of parameters that describe a vessel's movement. Additionally, this apparatus can be easily and freely configured, which allows one to carry out extensive and basically unlimited studies on moving objects with regard to maintaining a high level of marine safety.
Using navigation and manoeuvring simulators for research purposes lowers the costs of carrying out projects without lowering the level of marine safety at sea during verification of the results of studies.
If simulators are to fully replace real water bodies and coastal areas at the stage of research, they must not only faithfully imitate the properties of these areas, but also those of vessels that move in real waters. Therefore, the proposed method of verification of simulation models' adequacy with their real-world counterparts should be used to increase the reliability of the simulation results obtained.
The authors intend to carry out a fully-fledged evaluation of the model by using a multi-criteria analysis at the next stage of the research.


