


1. INTRODUCTION
Poor performance of Global Positioning System (GPS) user equipment in urban canyons is a well-known problem [Reference Ballester-Gúrpide1–Reference Ji4]. Where there are tall buildings or narrow streets, the direct line-of-sight (LOS) signals from many, sometimes most, of the satellites are blocked. The buildings effectively cast GPS shadows over the adjacent terrain. Figure 1 illustrates this. Without direct signals from four or more satellites, an accurate position solution cannot be determined. Sometimes, a degraded position solution may be obtained by making use of signals that can only be received by reflection off a building; these are known as non-line-of-sight (NLOS) signals [Reference Ercek, De Doncker and Grenez5, Reference Viandier6].
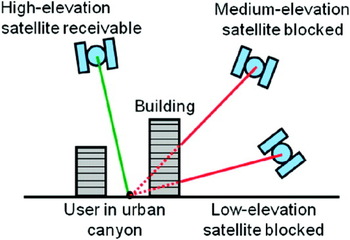
Figure 1. Illustration of signal blockage in an urban canyon (based on [Reference Tsakiri3]).
As more satellites are deployed from the other Global Navigation Satellite System (GNSS) constellations, the number of direct LOS signals available to suitably equipped users in urban canyons is increasing. Consequently, the proportion of the time for which four or more direct LOS signals are available is also increasing. Section 2 presents modelling results to support this, showing how the availability in mid-latitude urban canyons varies as a function of the building height to street width ratio. Three satellite constellations are modelled:
• A 27-satellite constellation, assuming that only GPS signals may be received;
• A 65-satellite constellation assuming GPS, GLONASS and a partially-complete Galileo constellation are available;
• A 100-satellite constellation assuming availability of GPS, GLONASS, Galileo and Compass.
However, an urban canyon affects the geometry as well as the number of the available GNSS signals. Signals with lines of sight going across the street are much more likely to be blocked by buildings than signals with lines of sight going along the street. This is illustrated by Figure 2. As a result, the signal geometry, and hence the positioning accuracy, will be much better along the direction of the street than across the street. Section 3 presents modelling results in support of this, showing how the average along-street and cross-street positioning error with the 100-satellite constellation vary with the building height to street width ratio.

Figure 2. Signal geometry in an urban canyon (aerial perspective).
Thus, although it should be possible to identify the correct street with multi-constellation conventional GNSS positioning, determining where the user is across that street will be difficult in deep urban canyons. However, there are many applications that benefit from this information. Traffic lane identification is useful for route guidance and vehicle tracking and is essential for lane-based road user charging. Pedestrian route guidance is enhanced by knowing which side of the street an individual is on; for visually impaired users, this is essential. Location-based directory services can estimate the journey time to a restaurant or café more accurately if they know which side of the street the user is on. Accurate cross-street positioning is also important for locating military, security and emergency service personnel.
3D city models have been used to predict GNSS signal availability (and multipath interference) in urban areas [Reference Bradbury7] and as part of the route-guidance user interface for pedestrian navigation [Reference Chen8]. The shadow-matching positioning method reverses this by using the signal availability determined by the receiver to work out the user location. At the correct location, the direct LOS signals received will be unshadowed according to the city model and the remaining signals will be shadowed. The conventional GNSS positioning solution is used to limit the extent of the search region. Section 4 describes a simple shadow-matching algorithm and presents simulation test results that demonstrate the concept and estimate the best-case performance.
To move from proof of concept to a practical shadow-matching positioning system, a number of issues must be resolved. These include handling database errors, the effect of along-street position errors on shadow matching, reliable determination of whether a satellite is directly visible and efficient preparation, dissemination and storage of the building database. Section 5 describes these challenges and discusses possible solutions. Finally, Section 6 presents conclusions.
2. AVAILABILITY MODELLING
A series of simulations were run to determine the impact of GNSS constellation size and urban canyon aspect ratio on GNSS position solution availability. The aspect ratio is the ratio of the building height to the street width. A position solution was assumed to be available wherever direct LOS signals were receivable from four or more satellites.
Six scenarios were simulated for each satellite constellation, all with the user located at latitude 45°, longitude 0. In two scenarios, the street was aligned north-south and in the remaining four, it was aligned east-west. In half the scenarios, the receiver was located 0·1 street widths from the edge, representing a pedestrian; in the remaining scenarios, it was located 0·35 street widths from the edge, representing a car. For the east-west street, scenarios for pedestrians and cars on both the north and south sides of the street were simulated. For the north-south street, the receiver was located on the west side of the street only as east side results are very similar.
For each scenario, the building height to street width aspect ratio was varied between 0 and 4 in steps of 0·1. For each aspect ratio, the satellite constellation was stepped through a 24 hour period in 60 s increments and the percentage availability of four or more direct LOS signals calculated. The elevation masking angle was 15°.
As only an approximate indication of signal availability is required, a number of simplifying assumptions were made:
• All satellites are evenly distributed amongst six evenly-spaced circular orbits, inclined at 55° to the equator with a period of half a sidereal day;
• The urban canyon has uniform width with no gaps between the buildings on either side;
• All buildings in the urban canyon have uniform height;
• The street is sufficiently long for end effects not to be considered.
Figure 3 presents the availability results for the 27-, 65- and 100-satellite constellations. As might be expected, the availability decreases with the urban canyon aspect ratio and increases with the size of the satellite constellation. Less obviously, the availability is significantly poorer along the north-south street than along the east-west street. This can be explained by comparing the projections of the line of sight vectors in the east-west and north-south planes. Within the east-west plane, a greater proportion of the satellites have lower elevations, whereas within the north-south plane, the distribution is more even, with a peak around 77°. Furthermore, for the east-west street satellite availability is actually better on the south side of the street than the north; this is because there are more higher-elevation satellites to the north than to the south. Figure 4 shows the west-east and north-south elevation distributions for satellites in GPS orbits.

Figure 3. Availability of direct LOS signals from four or more satellites in an urban canyon with (top left) a 27-satellite; (top right) a 65-satellite; and (bottom) a 100-satellite constellation.

Figure 4. West-east and north-south elevation distributions for satellites in GPS orbits and a receiver at 45° latitude.
In a real urban canyon, availability will be enhanced where satellites are visible through gaps between buildings and diminished where satellites are blocked by tall buildings in other streets. In particular, availability will typically be better in street intersections.
In practice, where fewer than four direct LOS signals are available, a degraded position solution can be often be obtained using NLOS signals. Also, a good position solution may often be obtained from three direct LOS signals and a terrain height database. Finally, dead reckoning [Reference Groves9] could be used to bridge a navigation solution between intersections, though the accuracy will depend on sensor quality and environment.
3. CONVENTIONAL POSITIONING PERFORMANCE
The performance of multi-constellation GNSS positioning in urban canyons using conventional methods may be predicted by multiplying the average dilutions of precision (DOP) by an estimated user equivalent range error (UERE). As for the availability modelling, it is assumed that only signals from satellites with a direct line of sight are used.
For each simulation, the LOS vectors were transformed to a coordinate frame aligned with the along-street, cross-street and vertical axes. Along-street and cross-street DOP were then calculated using the conventional method [Reference Groves9, Reference Conley, Kaplan and Hegarty10]. For the north-south street, the along-street DOP is the same as the north DOP and the cross-street DOP is equal to the east DOP; for the east-west street, these are reversed. For each of the six scenarios simulated for each constellation in the availability modelling, DOPs for each aspect ratio were averaged over a 24 hour period. Instances for which fewer than four direct LOS signals were available were omitted from the averaging. Instances where the relevant component of DOP exceeded 20 were also omitted to prevent outliers from skewing the results.
The UERE estimation was based on the following assumptions [Reference Groves9]:
• A code tracking noise standard deviation (SD) of 0·67 m;
• A signal in space (residual orbit and satellite clock) error SD of 1·0 m;
• A residual ionosphere error SD of 2·0 m, assuming a single-frequency user and a bias in favour of high-elevation satellites;
• A residual troposphere error SD of 0·5 m, assuming a bias in favour of high-elevation satellites;
• A multipath error SD of 1·0 m.
These give a total UERE of 2·6 m. The reason that the assumed multipath error SD is so low is that the buildings block many reflected signal paths as well as direct signal paths. For an urban canyon with buildings of equal height on both sides, the maximum path delay for a singly reflected signal is ![]() , where w is the street width and b the building height. Furthermore, the reflected to direct signal amplitude should be relatively low as the user antenna polarisation discrimination is good for high-elevation signals. In practice, significant outliers will occur due to reception of signals reflected off buildings in neighbouring streets. Also, the path delay can be up to twice as large where the direct LOS signal is received through a gap between buildings.
, where w is the street width and b the building height. Furthermore, the reflected to direct signal amplitude should be relatively low as the user antenna polarisation discrimination is good for high-elevation signals. In practice, significant outliers will occur due to reception of signals reflected off buildings in neighbouring streets. Also, the path delay can be up to twice as large where the direct LOS signal is received through a gap between buildings.
Note that “multipath” errors quoted in the literature for urban canyon positioning tend be much bigger than 1 m. This is because they tend to include reception of signals by NLOS paths only. The ranging errors using NLOS signals are much greater than those using direct LOS signals with multipath interference.
Combining the DOPs and UEREs, the estimated along-street and cross-street position error SDs with the 100-satellite constellation are presented in Figure 5. Values are omitted for solution availabilities below 10% to avoid misleading outlier effects. They are also omitted for building height to street width aspect ratios below 0·5 because the ionosphere, troposphere and multipath error standard deviations will be larger than assumed in the UERE estimate.

Figure 5. Estimated along-street (left) and cross-street (right) position error standard deviation for conventional positioning in an urban canyon with a 100-satellite constellation.
As can be seen from the figures, the cross-street positioning accuracy is slightly poorer than its along-street counterpart for the north-south street alignment and substantially poorer for the east-west street alignment. Certainly, for deep urban canyons, there is little prospect of using conventional GNSS positioning to identify the traffic lane or even which side of the street a pedestrian is on.
4. A SIMPLE SHADOW-MATCHING ALGORITHM
The principle of shadow matching is simple. Due to obstruction by buildings, signals from many GNSS satellites will be receivable in some parts of a street, but not others. A 3D city model, combined with knowledge of the line-of-sight vector between the satellite and the user can be used to predict where each signal is receivable. Consequently, by determining whether a direct signal is being received from a given satellite, the user can localise their position to one of two areas of the street. Figure 6 illustrates this. One method of determining whether a direct signal is received is to compare the measured carrier-power-to-noise density ratio, c/n 0, with a threshold.
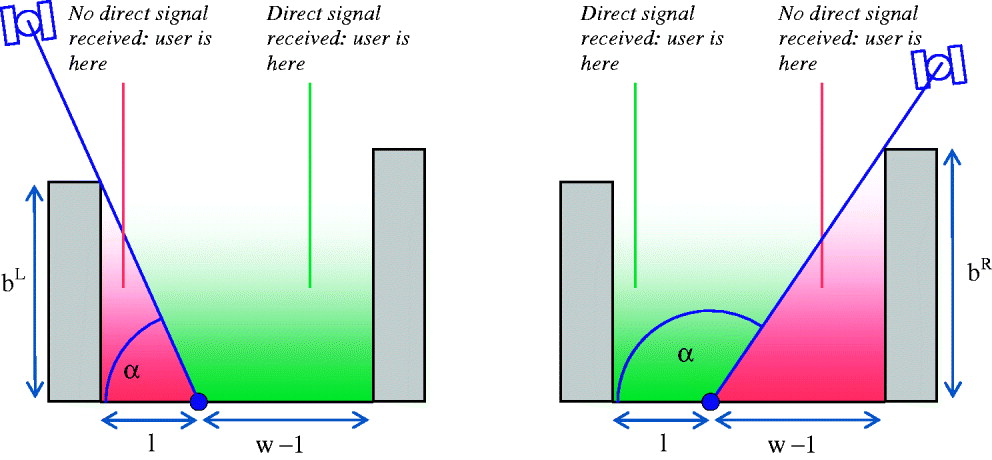
Figure 6. The shadow matching concept: using direct signal reception to localise position (w is street width; α is cross-street elevation; bL is left-side building height; bR is right-side building height; and l denotes the boundary of the reception area).
By repeating the shadow-matching process for each partially-obstructed satellite, the region within which the user may be located is narrowed. The estimated cross-street position is then taken as the centre of this region. Figure 7 illustrates this. Note that satellites that are either directly visible throughout the street or obstructed throughout the street do not contribute positional information. Figure 8 depicts a simple shadow-matching algorithm.
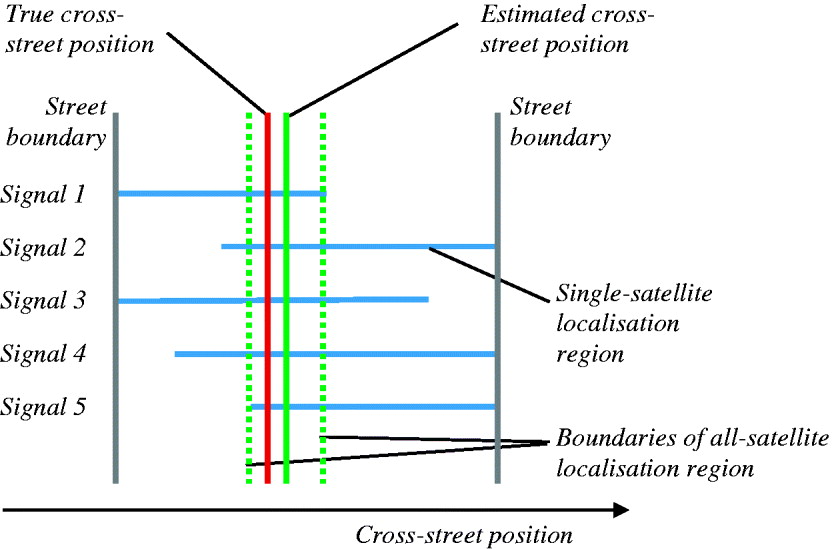
Figure 7. Combining shadow-matching measurements from multiple signals.

Figure 8. A simple shadow-matching algorithm (y is cross-street position from the left).
To determine the performance of this shadow matching algorithm, it was tested using the 100-satellite constellation over each of the six scenarios used for determining urban canyon position solution availability and conventional positioning performance in the preceding sections. A street width of 20 m was modelled. For each scenario, the building height to street width aspect ratio was varied between 0 and 4 in steps of 0·1. For each aspect ratio, the satellite constellation was stepped through a 24 hour period in 60 s increments. Wherever signals from four or more direct LOS signals were available, the shadow matching algorithm was run and the position error and containment logged, together with the number of satellites used. Position containment is the difference between the maximum and minimum cross-street position as determined by the shadow matching process. In the notation of Figure 8, the position containment is y + − y −.
Figure 9 (left) shows the root mean square (RMS) cross-street position error using shadow matching as a function of street aspect ratio. Figure 9 (right) shows the mean position containment region for shadow matching. Figure 10 shows the mean number of satellites used; this does not include satellites which are visible across the whole width of the street. With a street width of 20 m, the cross-street positioning accuracy was about 1 m. Note that if the street width were to be doubled to 40 m, the cross-street position error and containment region would also double. Performance in the car scenarios was poor for the lowest aspect ratio of 0·1 because the GNSS shadows did not extend to the middle of the street. However, conventional cross-street positioning works well for low aspect ratios.

Figure 9. RMS (left) and mean (right) cross-street positioning error using shadow matching in a 20 m wide urban canyon with a 100-satellite constellation.

Figure 10. Mean number of satellites used for shadow matching in an urban canyon with a 100-satellite constellation.
The results presented here represent a lower bound on the expected accuracy of a practical shadow-matching system. Additional position errors will occur due to errors in the 3D city model, the conventional GNSS position solution used to select the correct region of the model and the ability of the GNSS user equipment to determine whether a received signal is direct line of sight. These are discussed in the following section. It is assumed that gross errors can be detected by incorporating consistency checks into the shadow matching algorithm while smaller errors will not be detected and will moderately degrade the solution accuracy. On this basis, it is predicted that these error sources will double the overall position error.
Figure 11 presents a comparison of the predicted accuracy of shadow-matching cross-street positioning with conventional along-street and cross-street positioning averaged across the six scenarios with a 100-satellite constellation; this aggregates the results presented in Figures 5 and 9 (left), with the predicted shadow matching error SD being twice the RMS error from the simulations. For the deepest urban canyons, shadow matching is thus predicted to be about an order of magnitude more accurate than conventional GNSS positioning in the cross-street direction.

Figure 11. Comparison of conventional GNSS and shadow matching positioning accuracy in a 20 m wide urban canyon with a 100-satellite constellation.
5. PRACTICAL SHADOW MATCHING
A practical implementation of shadow matching requires:
• Efficient preparation, dissemination and storage of the city models;
• Reliable determination of whether a satellite is directly visible; and
• Quantification and mitigation of errors.
Each of these issues is discussed in turn.
5.1. City models
3D city models are now available from a range of suppliers for cities all around the world. UCL already has experience of using city models for modelling GNSS signal propagation in order to predict code multipath errors [Reference Bradbury7]. Data for the models is typically captured using airborne laser scanning, photogrammetry or light detection and ranging (LIDAR). Interestingly, experiments on using GNSS signal shadowing itself to build a city model have also been conducted [Reference Swinford11].
For shadow matching, city models must be efficiently stored within and disseminated to GNSS user equipment. Building data must also be retrievable rapidly. There is no need to model complete cities; only the buildings surrounding urban canyons, where conventional GNSS positioning is unreliable, are required.
The resolution of the model need only match the required shadow matching positioning accuracy, while building details that do not affect GNSS signal shadowing need not be stored. The key is to represent the rooflines accurately. A limitation of many current city models is that they assume all buildings have a flat roof, which will limit shadow matching precision. Consequently, a city model optimised for GNSS shadow matching would typically incorporate more detail around the roofline and less detail elsewhere than one designed for general use. How to automatically generate the appropriate level of detail for a particular application from the original base data is still an open research question.
For road vehicle navigation, 3D city model data could be disseminated alongside conventional road mapping, both at installation and update stages. For handheld devices, assisted GNSS (AGNSS) schemes might be augmented with city model data, so the device itself would only have to store building data for the city it is currently in.
5.2. Visibility Determination
Satellite visibility may be determined using the receiver's carrier power to noise density, C/N 0, measurements. A high value, typically above 40 dB-Hz, is indicative of a direct line-of-sight signal, while a low value is indicative of non-line-of-sight reception. However, it is not always clear from a C/N 0 measurement whether or not a satellite is directly visible as there are a number of other effects that impact C/N 0.
Transmission powers vary between satellites and decline as a satellite ages. This may be mitigated by keeping a log of the maximum C/N 0 recently received from each satellite. Alternatively, satellite transmission powers could be included in AGNSS data.
The received C/N 0 depends on the signal line of sight and the receive antenna gain pattern. For applications where the antenna is kept (approximately) horizontal, the angle of incidence at the antenna will be known, so antenna gain calibration can be used to determine the expected C/N 0. For applications where the antenna orientation is not known, such as most pedestrian applications, this will not work; instead, an antenna with a near-uniform gain should be used.
Reflected signals can sometimes be almost as strong as the direct signals. As a strongly reflected signal will have left-handed circular polarisation (LHCP), a receive antenna with a good polarisation discrimination will help reduce its C/N 0. However, this cannot apply to all received signals as the polarisation discrimination drops as the angle of incidence at the antenna (i.e. the departure from boresight) increases. In a deep urban canyon, even reflected-only signals will have a medium to high elevation, so lack of antenna polarisation discrimination will be more of a problem for pedestrian applications with unknown variable antenna orientation.
It will thus not always be possible to determine whether or not a satellite is visible. Where the measured C/N 0 is borderline, that signal should be excluded from the shadow matching algorithm.
5.3. Errors
Errors can arise from the database, the conventional GNSS solution and the satellite visibility determination. Database errors comprise along-street position errors, cross-street position errors, building height errors and out-of-date feature errors.
Cross-street errors in the positions of buildings in the database directly translate into errors in the boundary between the receivable and non-receivable regions. Both whole-database and individual building errors can occur. These errors are mitigated through adding an appropriate uncertainty to each shadow match, noting that some components of the database error will be correlated across all satellites whereas others will be correlated across some satellites, i.e. those shadowed by a particular building. Thus, modelling database errors correlated across only some satellites will require a more sophisticated shadow matching algorithm.
Building height errors translate into errors in the boundary between the receivable and non-receivable regions with a scaling factor of tan (π/2−α). Note that the lowest elevation satellites have the largest scaling factors, but are unlikely to be useful for shadow matching as they will typically be non-visible everywhere in an urban canyon. Thus the scaling factor will typically be one or less. Mitigation methods are as for the cross-street errors.
Out-of-date databases will result in real buildings being missing from the database or nonexistent buildings being included in the database. These errors can invalidate multiple shadow matches. Mitigation requires the development and implementation of consistency checking algorithms. These compare quantities calculated from different combinations of measurements to determine whether they are consistent [Reference Groves9]. An approach similar to receiver autonomous integrity monitoring (RAIM) [Reference Brown, Parkinson and Spilker12] can be used, provided modifications are made to allow for the fact that errors will often be correlated between signals. Consistency checks identify measurements from individual signals that are inconsistent with those from the majority of signals. Sometimes database errors can be detected through those signals that are predicted to be available or unavailable across the whole street.
Along-street database errors and errors in the along-street position solution, obtained by conventional GNSS methods, will cause divergence between the true and assumed signal propagation paths. Where both the true and assumed paths are blocked or both are unobstructed, this will have no effect on shadow matching. However, where only one path is blocked, an erroneous shadow match will occur, whereby the shadow matching algorithm assumes a blocked signal when the true signal is available or an available signal when the true signal is blocked.
One way of mitigating these along-street errors is to repeat the shadow matching calculation for a number of different along-street positions, applying a consistency check in each case. Those along-street positions for which the consistency check is passed (or the smallest number of shadow matches rejected) are most likely to be correct. Where a clear solution cannot be identified, a weighted average of the candidates should be selected. The range of along-street positions to be tested should be determined by the predicted uncertainties of the database and the along-street position solution. Note that large individual-building along-street database errors can have a similar impact to out-of-date databases, but are less likely to affect multiple signals.
Large errors in the conventional GNSS cross-street position solution can result in the wrong street in the database being selected for shadow matching. Unless the two streets are very similar this will result in an inconsistent and/or erroneous cross-street position solution. One way of mitigating this is to compute shadow-matching position solutions for multiple street hypotheses where the cross-street position uncertainty is large. The consistency in cross-street positions determined from different measurement combinations should be greater for the correct street hypothesis than for the other hypotheses. For navigation applications, data from previous epochs can also be used to determine the correct street hypothesis.
The final source of error is in satellite visibility determination. If a direct line-of-sight signal is assumed to be receivable when, in fact, only reflected signals are receivable, or vice versa, incorrect shadow matching will occur. The occurrence of these errors can be minimised by omitting those signals for which satellite visibility is unclear from the shadow matching process. However, the more stringent the criteria used to determine satellite visibility status, the fewer signals will be available for shadow matching. Consequently, availability must be traded off against reliability. Remaining satellite visibility classification errors may be identified using consistency checking.
6. CONCLUSIONS
It has been shown, using mathematical modelling, that although combining GPS with other GNSS significantly increases signal availability in urban canyons, the positioning accuracy in the cross-street direction will generally be poor because the unobstructed satellite signals travel along the street, rather than across it.
A novel solution to this problem is to use 3D building models to improve cross-track positioning accuracy in urban canyons by predicting which satellites are visible from different locations and comparing this with the measured satellite visibility to determine position. Modelling has shown that this shadow matching technique has the potential to achieve metre-order cross-street positioning in urban canyons. This is an order of magnitude better than predicted for conventional positioning in the deepest canyons.
Issues affecting a practical implementation of shadow matching, such as database dissemination, satellite visibility determination and handling of database errors, have been explored and mitigating action proposed.
ACKNOWLEDGEMENT
The author would like to thank Dr Claire Ellul, Peter Stacey and Toby Webb for their helpful suggestions and comments.


