


1. INTRODUCTION
SESAR is Europe's ‘Single European Sky Air traffic Research system’ (termed SESAME prior to 2005). NextGen is the USA's ‘Next Generation Air Transport System’ (previously termed NGATS). SESAR and NextGen are developments targeted at post 2020. The common vision is to integrate and implement new technologies to improve air traffic management (ATM) performance – a ‘new paradigm’. SESAR and NextGen are intended to combine increased automation with new procedures to achieve safety, economic, capacity, environmental, and security benefits. The two systems do not have to be identical, but it is important to align common equipment standards and to ensure technical interoperability.
In analysing potential major ATM system changes, a simple division into five Key Test areas might be: Safety Credibility, Operational Concept, Technological Feasibility, Benefits and Costs, and Transition Path (Brooker, Reference Brooker2002). The main attention here is on Benefits and Costs.
The following sections are organised as follows. First, SESAR and NextGen are briefly described. Then there are two economic sections. The first section is on Benefits and Costs Appraisal. The second economic section on Transport Investment, Welfare and GDP (Gross Domestic Product) examines the wider benefits of transport investments. Traditionally, transport project assessments estimate welfare benefits and costs, but there are in many cases wider benefits through the impact of transport on productivity and GDP. This leads on to a critique of some of the important features of the main SESAR Cost Benefit Analysis (SDG, 2005).
There is a huge literature on the appraisal of projects. The phrase Cost Benefit Analysis (CBA) and its variants are in common use. But there are different types of CBA, with very different calculation rules. The two sections sketch important types: Business Appraisal CBA – CBA(B) – and Society Appraisal CBA – CBA(S). Both of them calculate Net Present Values for projects – termed here NPV(B) and NPV(S). SDG presents two CBAs: a Financial CBA and a Social and Economic Costs and Benefits, which correspond broadly to CBA(B) and CBA(S).
2. SESAR AND NEXTGEN
SESAR and NextGen literature is huge and growing. Both are under development rather than being well-defined products. The main goal of both programmes is to increase system capacity cost-effectively, whilst ensuring safety. Thus, the ATM system improves thanks to planning and operational tasks being eliminated, simplified or transferred. Most of the current efforts are on agreeing the respective Concept of Operation documents to achieve these gains. The most recent NextGen document on this is JPDO (2007). EC(2007) is a sketch of the comparable SESAR thinking.
A particularly interesting analysis of NextGen's concepts is set out in Sheridan et al (Reference Sheridan, Corker and Nadler2006). This focuses on new roles and responsibilities for human operators and the issues associated with human-automation interaction in NextGen. The system changes generally involve much greater automation compared to the present, so pilots, air traffic service providers, and other system operators will still be required to monitor operations and ensure safety, especially when there are hardware failures, software errors or other unanticipated events.
Figures 1 and 2 illustrate key features of SESAR and NextGen (omitting weather and security elements, which are much more important in the latter's planning). Both create a cooperative surveillance model for civil aircraft operations, where aircraft are constantly transmitting their position, flight path intent, and other useful aircraft parameters (ADS-B – Automatic Dependent Surveillance-Broadcast). Both expect aircraft position to be determined using a satnav constellation, such as GPS or Galileo.

Figure 1. Key NextGen features (from Sheridan et al, Reference Sheridan, Corker and Nadler2006) (excludes weather, security elements).

Figure 2. Some SESAR features (extracted from EC, 2007) (excludes weather, security elements).
The basis for planning and executing system operations is an aircraft 4D trajectory, which is the aircraft path, three space dimensions plus time, from gate-to-gate, including the path along the ground at the airport. Data on the planned and actual trajectories are exchanged between air and ground. Digital satcomm constellations report positions to ground facilities. All other communication is through this constellation as well, e.g. gate-to-gate 4-D trajectories are broadcast and, if necessary, so are voice communications. Thus, communications, navigation and surveillance functions are much less ground-based than the current system.
The main difference shown in the two Figures is that NextGen additionally uses automation through the Evaluator function to analyze these trajectories to ensure aircraft remain at safe distances from one another (the Evaluator is briefly explained in Brooker (Reference Brooker2007)).
The main official cost benefit study of SESAR so far is SDG (2005). The ATM Master Plan, the final result of the SESAR definition phase, due in 2008, is intended to have detailed cost benefit analyses. Are there problems with the SDG analysis that need to be addressed? One issue with the SDG report is that it does not give much of the raw material used to develop its quantitative conclusions, so the comments here are high-level ones about general methodology.
3. BENEFITS AND COSTS APPRAISAL
3.1. Business Appraisal (CBA(B))
Businesses use CBA(B) to produce rational decisions about investing in projects. CBA(B) focuses on the present and future pluses and minuses of flows of hard cash. CBA(B) focuses on money flows. It discounts money flows in the future (e.g. Merrett and Sykes, Reference Merrett and Sykes1973). It is an example of a Discounted Cash Flow (DCF) technique. A discount rate of r% implies that £1 in i years time is worth £1/(1+r)i today.
The equation below shows the general calculation for a Net Present Value (Business) – NPV(B). If a business faces choices, the best investment according to this technique is the one that produces the highest positive NPV(B). The sum ranges over n+1 years – from 0 to n: this is to cover the case when there is an immediate investment – year 0. To reiterate, benefits, disbenefits and costs are real-money cash flows to the company making the investment. A cost would be an actual expenditure of cash to secure the investment (e.g. on maintaining equipment) while a disbenefit would be an estimated operational cost arising out of the investment (e.g. increased fuel usage). All the cash flows are usually calculated in constant price levels.

The discount rate r% reflects alternative uses for investment capital. As the opportunity cost of capital, it should be at least as high as the interest rate available at the bank. Indeed, it needs to be an even greater figure than this, to reflect the fact that all investments into the future involve some risk, e.g. when future cash flows depend on projected traffic volumes. Sensitivity analysis is also used to assess risks – making cautious and pessimistic estimates of the parameters in the calculation.
3.2. Society Appraisal (CBA – CBA(S))
Societies frequently have to make decisions about choices that will deliver the best way forward. To promote the common good of society in this way means to benefit people, so it is roughly equivalent to ensuring society's social welfare or just welfare. The rational social decision is then the one in which the benefits to society, taken as the sum of the individuals in society, exceed the costs to society. This is Society Appraisal CBA – CBA(S). Good background material on CBA(S) and the economics jargon used here can be found in (e.g.) Pearce (Reference Pearce1998; Reference Pearce2002).
In economics, the word utility – U – is used to indicate the happiness or satisfaction gained consuming goods and services, including those not derived from market transactions. People's decisions and economic behaviour can be seen in terms of attempts to increase their utility. Economists combine the preferences expressed in function U with monetary valuation. Money has the advantages that it can be observed and measured, and that it is common currency between people. Thus, economists determined people's wellbeing, or happiness, or utility by comparing various monetary figures – but monetary is not hard cash in every case.
How is society to decide whether a project is desirable or not, when that project might (e.g.) include significant negative environmental changes (known as externalities)? Suppose N people are in total affected by this project in some way, and that there is a social welfare function (SWF) of the form:
If the project goes ahead, the utilities for each person i will change by an amount ΔUi. This means that the SWF will change by ΔSWF:
Things are very nice if ΔSWF>0 and all the ΔUi⩾0. Everybody either gains or at least finds the situation no worse than before. This is called a Pareto improvement. Although Pareto improvements are useful in economic theory, they do not help much with real-life problems. Typically, the situation is:
i.e. there are some losers, even if the pluses outweigh the minuses in the ΔSWF calculation.
The Kaldor-Hicks compensation test says that such a project is socially desirable if those who gain could compensate the losers, so that their utility is not changed compared to the initial situation, and still have some gain left over. U values are seldom measured directly: benefits and costs are assessed by determining willingness to pay (WTP) or willingness to accept (WTA) compensation. Actual compensation is not required if the project goes ahead, because society as a whole is seen as benefiting – but that does not say that it could not be paid. The Kaldor-Hicks test is usually taken as the ‘best’ way of assessing changes, although it has flaws as an ethical criterion for social decision-making. But it does not appear easily replaceable by something that could be proven to be systematically better. It provides the basis for a method of weighing benefits, costs and externalities against each other. This is Cost Benefit Analysis for Social Appraisal – CBA (S).
CBA(S) shares with CBA(B) the use of time discounting to compare costs and benefits at different times. However, as already noted, discounting for business investments uses a discount rate that is intended to reflect alternative uses for investment capital. Where there are issues of society's sustainability, e.g. in respect of climate change, relatively low social discount rates, e.g. of <3%, are often used to discount the long-term future costs (e.g. see Spackman (Reference Spackman2004)).
Estimating costs, benefits and externalities in CBA(S) can be very difficult. Market prices provide information about individual preferences and firms' costs through demand and supply activity. But some costs and benefits are not traded in markets, and many externalities, such as noise and pollution, are not included in market prices. The estimation of non-market benefits and externalities has generated several thousand research papers. For present purposes, the most important example is the valuation of time-savings. Passengers value their time, and indeed are willing to pay for time-savings. Thus, both Eurocontrol (2005) and the Federal Aviation Administration (GRA, 2004) have cost-benefit studies guidelines for passenger time-savings.
4. TRANSPORT INVESTMENT, WELFARE AND GDP
An important theme of UK DfT (Department for Transport) research in recent years has been the wider benefits of transport investments. Traditionally, a transport project assessment estimates its social welfare benefits and costs, including journey time-savings, and environmental and other factors. But there are in many cases wider benefits through the impact of better transport on productivity and GDP. Appraisals should endeavour to include all benefits and costs, and so should include the best estimates of all these wider benefits/costs.
Examples of DfT-funded research work in this area are Graham (Reference Graham2005) and a review by DfT (2006). The importance of this work is probably best appreciated by the analysis in the UK's Eddington Transport Review, a chapter of which was devoted to transport's contribution to the performance of the economy (Eddington, Reference Eddington2006). The following makes considerable use of the material in Eddington, Graham, and the DfT review.
The Venn diagram in Figure 3 is crucial to understanding Welfare and GDP effects. The key point is that Welfare and GDP gains from transport investments have some things in common, but not others. The most important common element of Welfare and GDP is Business Time and Reliability Savings. Reliability is usually measured in terms of the variability around the average journey time. Unreliability is a cost to business because of the contingency measures that have to be put in place, e.g. building slack capacity into the supply chain, hiring additional staff, and holding buffer stocks. But reliability is usually included qualitatively in transport appraisals, if at all.
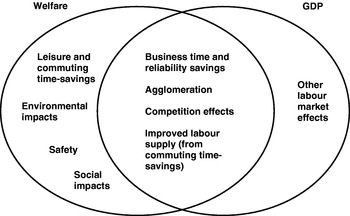
Figure 3. Potential Welfare and GDP Effects of Transport Investment (adapted from DfT, 2006).
To quote some extracts from Eddington (Reference Eddington2006) on Business Time-savings:
“The most obvious and direct benefit of an improvement in transport is a reduction in the time spent travelling. The benefit of a transport improvement with regard to time savings is the value of the time that becomes available to do things that could not be done whilst travelling: for business, this translates directly into a reduction in costs and/or an increase in output.
A high proportion of expected benefits from a transport intervention accrue in the form of journey time savings to users … Where such journey time savings are of work time, ie savings mainly to business and freight, there is an equivalent gain in GDP.
Transport improvements that deliver time, cost and journey reliability savings, particularly for business and freight traffic, can significantly contribute to GDP through an increase in overall cost savings for business … It should be noted that these efficiency gains to business are manifestations of the initial time-savings from transport improvements and are captured in appraisal.”
Figure 3 shows three other categories of GDP gain that should be counted as Welfare benefits: agglomeration, competition effects, and improved labour supply (from commuting time-savings). Very briefly, these mean the following:
Agglomeration: Economies of agglomeration describe the productivity benefits that some firms derive from being located close to other firms. Productivity would be expected to increase with employment density
Competition effects: Better transport tends to reduce the risks of ‘Imperfect competition’, situations where buyers or sellers are able to distort prices in order to increase profits. Benefits would be expected to be in proportion to trips during people's working time.
Improved labour supply: High commuting costs can lead workers to work less or in less productive (and lower paid) jobs than they otherwise would. Improves with reducing commuting costs.
An example of the large effects that including these GDP benefit categories can have is set out in DfT (2006) for Crossrail. This is a proposed project to build new railway connections under central London. The conventional appraisal – business, commuting and leisure time-savings – produces an NPV of £12·8 billion. Adding in the categories of GDP gain, mainly agglomeration and labour supply benefits, into the Welfare total produces an NPV of almost exactly £20·0 billion. This is a highly significant 56% increase. This is probably a high figure for typical road/rail projects, because travel in London is badly affected by congestion and capacity limits.
But these GDP gains are much less likely for air transport investments than they are for road and rail projects in cities. The key point is that the extra GDP benefits are largely achieved through changes to firms' locations and labour market effects. These kinds of gains will mainly be derived from reductions in business travel times, within clusters of firms, and reductions in commuting times. These will be far more apparent for road or rail than for air transport. In particular, only a small proportion of commuters generally use air transport, especially since extra time has been required for aviation's extra security arrangements.
The conclusions from this sketch of transport investment, welfare and GDP are:
• GDP benefits from a transport investment cannot simply be added to the traditional project appraisal benefits. At the very least, this would be double counting of the gains to be achieved from business time-savings.
• For air transport projects, there could be some GDP gains from locational and commuting times savings, but these cannot be assumed to be large in comparison with traditional project appraisal benefits.
These conclusions are crucial to the assessment of the SDG (2005) cost benefit analyses.
5. CRITIQUE OF THE SDG FINANCIAL CBA
It is difficult to analyse SDG's Financial CBA because details of the calculations are not presented. The quantitative conclusions are generally set out graphically – several of the numbers quoted here have been read from histograms. The SDG Base Case is defined as the ATM industry, under existing R&D plans, implementation plans and institutional arrangements, without the influence of SESAR. Three variant SESAR scenarios, Scenario I and two variants, 2 (Enhanced) and 3 (Aggressive), then show different estimates of the potential impact of the programme. The impact of SESAR on the existing plans potentially arises from:
• Earlier implementation of existing (developmental) and new concepts and technologies.
• Smaller number of parallel developments and thus reduced R&D and implementation costs.
• Higher probability of delivering the planned improvements.
The tangible – hard cash – financial benefits to firms in the industry arise from:
• Reduced ATM costs. Excess ATM system capacity can be used to improve productivity, e.g. by reducing the required number of controller working positions.
• Reduced fuel usage. Aircraft can fly more direct routes.
• Fewer buffer delays. Better schedule predictability allows reduced time buffers between flights
Figure 4 shows the main SDG results for this financial appraisal. About 88% of the benefits are from reduced ATM costs and the next highest amount is 7% from reduced fuel usage. The fact that so much of the value arises from the first category is very important: are there cheaper ways of delivering the capacity increases needed to meet demand? This is a key question: the robustness of the SDG analysis depends crucially on the answer being ‘No’.

The problem is the productivity of European ATM. This has been most conspicuously displayed through the results of a comparative study of European and USA performance (PRC, 2003) – which are not addressed in the SDG (2005) report. Some quotes from the analysis serve to make the point (note that the European centres examined were all in developed nations; ATCO=en route controller):
• “ … the operating costs per flight-hour controlled in the selected European centres were, on average, more than 60% higher than those in the selected US centres.
• The difference in controller productivity arises in part from the fact that the US controllers can handle more traffic when working at their maximum throughput, and in part from the fact that the availability of US controllers to staff the operations room is better matched to the ups and downs of traffic leading to better resources utilisation. Differences in working, operational, and organisational practices lie behind these differences in performance.
• … there is no evidence of a systemic difference in traffic complexity between the selected US and European en-route centres.
• … each ATCO on operational duty in the US centres handles on average 29% more flight-hours per hour on duty than the average European – a performance ratio of 1·29. In addition, ATCOs in the US work on average 32% more hours.
• Some 23% of the performance gap between the US and Europe arises from the ability of US centres to adapt their staffing better to the traffic variability that they face.
• … we were struck by the statement that hand-over between centres in the US required no more controller effort than hand-over between sectors. This difference in hand-over workload would make a difference to the productive efficiency of sectors and hence ATCOs.
• US ATFM [air traffic flow management] procedures allow both greater sector productivity (because sector workloads were more even and predictable) and better capacity utilisation (because unnecessary restrictions are avoided).”
The PRC report notes that there are social, cultural and labour market differences between the USA and Europe, which generally tend to militate against rapid changes. But many of Europe's Single European Sky initiatives (EC, 2007) are focused on these kinds of productivity improvements, for example the creation of Functional Airspace Blocks to improve efficiency. SDG (2005) includes no discussion on improvements to controller productivity that would bring Europe nearer to achieved USA levels.
A back of envelope sensitivity test is to assume that en route ATM capacity grows by 1% per annum for the first three years of SESAR because of continuing European efforts to improve controller productivity. Three years of 1% growth is about 3% in total, i.e. about a tenth of the maximum throughput gap between Europe and the USA. More important, it is more than a year's traffic growth on the central forecast used by SDG. The Reduced ATM costs element described above is a consequence of the imbalance between capacity and (mainly peak hour) demand. Shifting the capacity line up by a year's growth in traffic is roughly equivalent to delaying SESAR traffic benefits by a year. SDG estimate the consequences of a year's benefits delay as €7 billion in Scenario 1 (and there would be a similar proportionate reduction in the passenger time-savings discussed in the next section).
There are also problems with the NPV analysis used to construct Figure 4. First, it is very unusual simply to add together NPVs for different firms and industry sectors using different discount rates (page 34 of SDG (2005) appears to indicate that this is what was done). This tends to obscure the major problems for military and general aviation (paragraphs 7·31 to 7·33 of SDG (2005)). Second, although most of the SDG discount rates generally match those used in other ATM work, the commercial discount rate, for Airlines and General Aviation of 10·0%, is on the low side. This is crucially important given that nearly 70% of the Scenario 1 costs are avionics-related. It is, however, very difficult to find good, general evidence for this aspect of airline decision-making, because of its commercial importance. But a quote from Marais and Weigel (Reference Marais and Weigel2006) serves to make the point:
“… a positive long-term net present value (NPV) is necessary but may not be sufficient to motivate investment by aircraft operators. For example, commercial airline boards typically require a positive return on investment (ROI) within eighteen months of investing.”
An eighteen month payback would be much more than a 10% discount rate.
6. CRITIQUE OF THE SDG SOCIAL AND ECONOMIC CBA
The main SDG conclusion of the CBA(S) is shown in Figure 5, which is an NPV calculated with a 5% rate of return. The contributions in the Figure show the net economic impacts of each of the scenarios compared to the Base Case. Net economic impacts do not include the financial costs and benefits described above, but take into account the wider impacts on the economy including:
• GDP induced and indirect effects arising from impacts on the economy – positive
• Passengers' time-savings – positive
• Increased emission costs – negative
• Increased noise costs – negative

Figure 5. SESAR Incremental Economic Benefits and Costs, adapted from Figure 7·21, SDG (2005).
All SESAR scenarios provide incremental GDP growth and passenger time-savings benefits as compared to the Base Case. The magnitude of the net economic benefits exceeds the SESAR financial benefits by between three and five times. Are these results credible?
The largest effect is from GDP gains. From the histogram in Figure 5, these range from €42 billion to €45 billion for the three scenarios. How are they calculated? The calculation rests on an earlier UK study (OEF, 1999). This extrapolated results from transport generally to air transport in particular, through a set of estimated relationships and assumptions:
• OEF estimate that a 1% increase in total transport output leads to an overall economic growth, at the margin, of 0·135%.
• Aviation constitutes 15% of the total transport output (an OEF estimate).
• 15% of 0·135% (i.e. pro rata) is 0·02%
• Thus, a 1% marginal increase in output level in the aviation sector would yield a 0·02% increase in GDP.
• SESAR scenarios can accommodate additional flights compared with the Base Case.
• The aviation multiplier of 0·02 is applied to the year-on-year growth in aviation output to measure the year-on-year increase in European GDP.
The earlier section explained how GDP effects should reasonably be added to the typical welfare effects assessed in CBA(S). The OEF/SDG methodology does not follow this process. First, by simply adding a GDP effect, it may double-count the effects of business time-savings. Second, by assuming that air transport has similar GDP effects to transport as a whole, it supposes that air transport generates the kinds of locational and labour market benefits that arise from road and rail projects in towns and cities, but no evidence is presented to back up this assumption. Thus, the Net GDP Impacts in Figure 5 are not substantiated.
The next largest contribution in Figure 5 is from passenger time-savings – Net Pax Time-savings – which vary from about €15 billion to €22 billion across the scenarios. Again, the SDG report does not give the details of the time-savings calculations, but it does give the assumed Value of Time per passenger hour of time saving as €45·7 (in 2005 prices – page 29). Table 1 reproduces an approximate calculation to arrive at this figure using Eurocontrol data (Eurocontrol, 2005). Table 1 shows Low and High ranges for the Value of Time, depending on the purpose of the flight. (Note that the difference between ‘Personal convenience’ and ‘Tourism’ was not defined in the original source material.)
Table 1. Value of Time Calculations.

Notes:
1. Raw data is from Eurocontrol (2005), pages 14 and 18.
2. All raw data is inflated by a factor 1·162 to produce ~2005 € prices. This ensures that the mid-range Value of Time using SDG Purpose proportions matches the quoted – assumed mid-range – €45·7 figure in SDG (2005), page 29.
The decimal places are not significant. They are there merely so that the quoted SDG figure is reproduced.
There is an important issue about what should be the appropriate weightings for the various types of travel, given the large differences in valuations shown in Table 1. The problem is that the proportion of leisure traffic in Europe is increasing over time. Column A of Table 1 is in fact based on a 2000 report quoting even earlier data. A much more recent report, (Jacobs Consultancy, 2006, page 124), calculates the current split between business and leisure passengers at 15 major EU airports in 2003 (sic). The average split was 33% business and 67% leisure, i.e. much more leisure-orientated than it would have been even a few years ago. OEF (2006) gives some recent figures for UK airports: Heathrow has about 40% business travellers, but other UK airports are at 18%, having reduced from 24% a decade ago.
Thus, the conclusion about the average Value of Time is that, all other things being equal, it will tend to reduce year by year as the proportion of leisure traffic increases. If the proportions were 25% Business, 25% Personal convenience, and 50% Tourism (Table 1, column B), then the weighted average would be about €37·3, i.e. about 18% less than the SDG figure of €45·7. If this were a reasonable figure to use for the average Value of Time over the whole SDG NPV horizon of 30 years, then this would correspond to a reduction in Net Pax Time-savings of €3–4 billion, depending on the scenario.
7. CONCLUSIONS
SESAR and NextGen developers face a strategic challenge. They must convince customers and stakeholders of the benefits of paradigm shift expenditure, given the associated impacts on future user charges, aircraft equipment investments and public expenditure. The existing SDG (2005) CBAs for SESAR are not particularly robust.
The SESAR financial CBA includes some sensitivity analyses on project delays and costs, but it does not cover the prospects of improved productivity as a consequence of successful operational gains though the Single European Sky programme. These would close the productivity gap between Europe and the USA. Even comparatively small progress in this area could reduce the NPV by €7 billion in scenario 1. It would be better to include potential SES improvements in SESAR CBAs.
There are major problems with the SDG methodology for assessing GDP benefits. There is some double counting of GDP benefits that are already included in business time-savings. The assumption that wider GDP increase will result from air transport growth is an unsubstantiated extrapolation from road/rail projects focusing on city development. The NPV over-estimate in scenario 1 could be up to €45 billion. The methodology for including GDP benefits needs to rest on much firmer foundations.
The SDG assumptions made about the value of future passenger time-savings do not take into account the likely increasing proportion of leisure traffic. For scenario 1, the NPV over-estimate could be of the order of €3 billion. The future breakdown between business and other passengers needs to be assessed in more depth.


