1. INTRODUCTION
All vessels are expected to comply with international regulations and practices as they navigate in open waters and in waterways. As ships approach each other, there is a practice that provides guidance on which minimum safety distance is recommended to avoid the occurrence of an incident or an accident (International Maritime Organization (IMO), 1972). Vessels that follow and take responsibility for their actions according to this practice are considered to be acting according to “normal behaviour”, that is, expected behaviour for navigation purposes. A vessel that deviates from normal behaviour, that is, one that does something unexpected or has manoeuvring problems, is “uncomfortable” from the point of view of other ships (Hansen et al., Reference Hansen, Jensen, Lehn-Schiøler, Melchild, Rasmussen and Ennemark2013). It is a risk factor for possible ship meetings and crossings or to infrastructure close to waterways.
The understanding of both normal and abnormal ship behaviour is essential in traffic capacity analysis, for example, when evaluating traffic separation schemes or planning to build maritime infrastructure that restricts a fairway (Coldwell, Reference Coldwell1983). A poor understanding of normal passing distances may lead to unreliable estimations of risks at sea (Przywarty et al., Reference Przywarty, Gucma, Marcjan and Bak2015). For example, when the probability of collisions is underestimated, necessary actions to avoid collisions and grounding accidents in congested waters may not be taken (Copping et al., Reference Copping, Breithaupt, Whiting, Grear, Tagestad and Shelton2016), whereas an overestimation may lead to excessive costs in building maritime infrastructure (Jensen et al., Reference Jensen, Hansen, Lehn-Schiøler, Melchild, Rasmussen and Ennemark2013).
To decrease the risk of collision, there must be a “well clear” distance between ships according to International Regulations for Preventing Collisions at Sea (COLREGS) (International Maritime Organization (IMO), 1972). However, the size of a “well clear” distance is not defined in a quantitative measure; it is often determined as outside the ship domain (Jingsong et al., Reference Jingsong, Zhaolin and Fengchen1993; Chang et al., Reference Chang, Hsiao and Wang2014; Goodwin, Reference Goodwin1975; Hansen et al., Reference Hansen, Jensen, Lehn-Schiøler, Melchild, Rasmussen and Ennemark2013; Jensen et al., Reference Jensen, Hansen, Lehn-Schiøler, Melchild, Rasmussen and Ennemark2013). The term ship domain was first defined by Goodwin (Reference Goodwin1975), who investigated traffic situations in the North Sea and concluded that a ship domain is the area completely surrounding a ship required by the navigator for safe and efficient navigation. The effects of ship size were discussed by Goodwin, but it was not considered conclusive, and thereby not included in the ship domain size. The ship domain was divided into different sectors near the ship: port, starboard and astern, which have different radii of 0.7 Nautical Miles (NM), 0·85 NM and 0·45 NM, respectively.
Fujii and Tanaka (Reference Fujii and Tanaka1971) introduced the term “effective domain”, which was defined as “the effective domain around a ship into which other ships avoid entering”. This area was later determined by Fujii (Reference Fujii1983): “the domain for co-directional encounter is approximately elliptic with a long radius of 8 LFootnote 1 and short radius of 3.2 L under ordinary navigation condition”. Goodwin's definition conceptually differs from Fujii's definition, as Goodwin defines the ship domain as the area that navigators want and require for safe navigation, whereas Fujii's ellipse is the space that the navigators actually achieve.
Coldwell (Reference Coldwell1983) suggested a definition of the domain similar to Fujii (Reference Fujii1983) and referred to it as the ship domain in restricted waters. This is a situation-based ellipse and separated overtaking from meeting head-on, for example, 6 × 3 · 5 cables (1,110 × 650 metres) for overtaking situations or 6 · 1 × 5 cables (1,130 × 930 metres) for head-on meetings with an offset (1cot75 cables to port and 3cot25 to starboard). The distances are presented in cables instead of ship lengths, since only limited correlation between the size of the domain and the size of the ship was found in overtaking situations and there were no significant correlations for the domain being dependent on ship size in meeting situations (Coldwell, Reference Coldwell1983).
Hence, Fujii, Goodwin and Coldwell all used radar observations, with some differences with respect to distance measurement unit and geometrical shape of ship domains, see Figure 1. Within this research area, Pietrzykowski and Uriasz (Reference Pietrzykowski and Uriasz2009) defined three different approaches to investigate the ship domain: statistical, analytical and artificial intelligence. The statistical approach is an approach where passing distances are taken from historical data or observations; the approaches developed by Goodwin, Fujii and Coldwell are all statistical methods. The analytical approach is a method where the size and shape of the domain is as an example determined after simulation runs, that is, how close did the ships pass in a safe manner. The artificial approach is a method where certain rules are implemented, and the ship domain is given after multiple simulations.
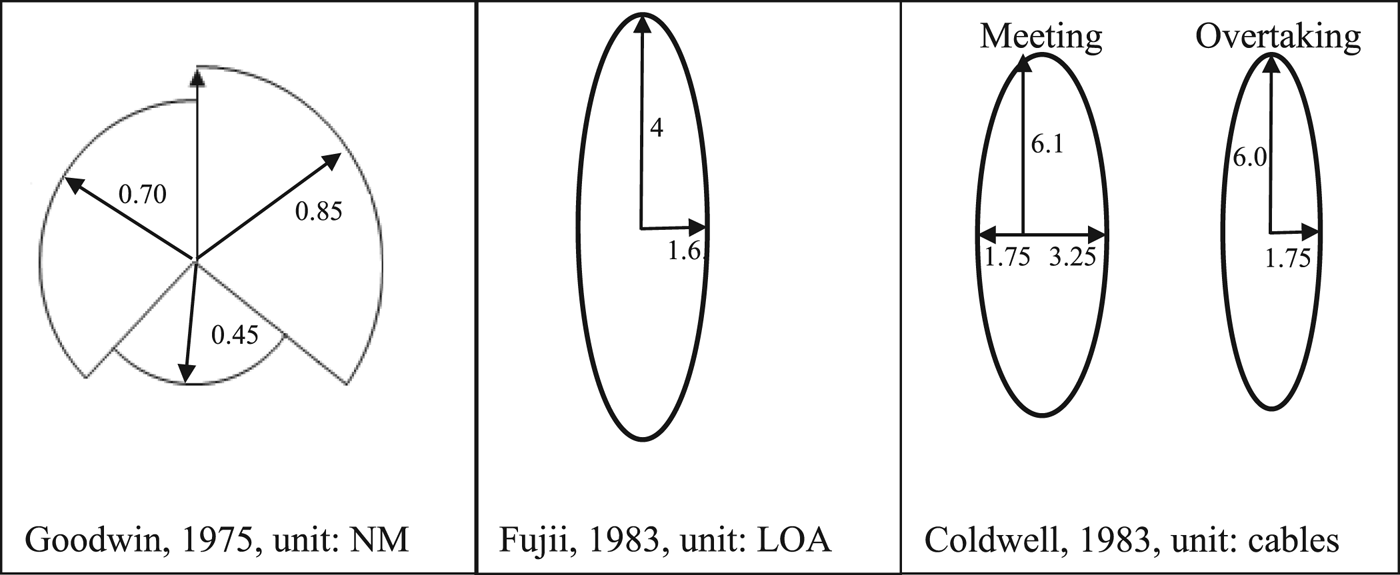
Figure 1. Ship domains based on the research of Goodwin, Fujii and Coldwell.
Some shortcomings of using statistical methods within the ship domain research field have been identified by Pietrzykowski and Uriasz (Reference Pietrzykowski and Uriasz2009): it is necessary to record sufficient amounts of data; it is difficult to separate the parameters that affect the domain size and shape; and it is difficult to describe if the ship domain is the area that navigators want to keep clear or the area that is left clear. Even though not intentionally developed to advance maritime research, the introduction of the Automatic Identification System (AIS) has allowed researchers to study various maritime fields with higher accuracy regarding spatiotemporal aspects (Robards et al., Reference Robards, Silber, Adams, Arroyo, Lorenzini, Schwehr and Amos2016; Szlapczynski and Szlapczynska, Reference Szlapczynski and Szlapczynska2017). Hence, using AIS as a source of data makes it possible to overcome the aforementioned drawbacks of statistical methods, primarily due to the volume of AIS data. This has, to some extent, already been used within the field of collisions between ships (Silveria et al., 2013). Gucma and Marcjan (Reference Gucma and Marcjan2012) used AIS data and studied if the ship and encounter type affected the ship domain in the Gulf of Pomerania. They concluded that the type of ship had no effect on the shape of the domain, and only minor differences could be observed in size. They also suggested that future research should look into the relationship between ship size and domain size. Hansen et al. (Reference Hansen, Jensen, Lehn-Schiøler, Melchild, Rasmussen and Ennemark2013) investigated the passing distance between ships in the Great Belt and in the Drogden Channel. The distance to target ships was measured in Length Overall (LOA) and was determined to have the same shape and size as the effective domain by Fujii and Tanaka (Reference Fujii and Tanaka1971), though they defined the area as the “comfort ellipse”. Pietrzykowski and Magaj (Reference Pietrzykowski and Magaj2016) investigated ship domains in the Bornholmsgatt and found that the size of the ship domain was different in open and restricted waters.
The concept of ship domains has high practical relevance for operators of ships as well as actors involved in planning maritime infrastructure. Since the ship domain is used in many methods linked to risk assessments, such as in Jensen et al. (Reference Jensen, Hansen, Lehn-Schiøler, Melchild, Rasmussen and Ennemark2013) and Zhang et al. (Reference Zhang, Goerlandt, Kujala and Wang2016b), it is important that the size of the ship domain is consistent with traffic today. Furthermore it has been implemented to serve as part of the design criteria for the International Association for Bridge and Structural Engineering, (IABSE), which affects the building codes of bridges worldwide. The model proposed by IABSE, estimating the collision risk, includes the risk of ships doing unwanted evasive manoeuvres near a bridge. Thereby, the ship domain was introduced as a measurement to ensure that the span is wide enough to fit the intended traffic (Larsen, Reference Larsen1993).
In summary, understanding which parameters influence ships' domains is essential in order to avoid groundings and estimate the probability of collisions. The early research on ship domains used radar observations, and the introduction of AIS enables studies of how different parameters influence the ship domain under different conditions, which has been used by Gucma and Marcjan (Reference Gucma and Marcjan2012) and Hansen et al. (Reference Hansen, Jensen, Lehn-Schiøler, Melchild, Rasmussen and Ennemark2013). Gucma and Marcjan (Reference Gucma and Marcjan2012) concluded that it is important to investigate how the ship domain relates to the ship size, whereas Hansen et al. (Reference Hansen, Jensen, Lehn-Schiøler, Melchild, Rasmussen and Ennemark2013) argued that it is important to investigate ship domains in other locations beyond their study. Given this background, the objective of this paper is to identify how different parameters (including locations) influence the ship domain.
The rest of this paper is structured as follows. Section 2 describes the general methodology for handling AIS and how the ship domain is constructed, followed by a detailed example on how this is performed. Section 3 presents a case study, and the results from this study are presented in Section 4 and discussed in Section 5.
2. DESCRIPTION OF MODELS AND METHODS
This paper develops a method to investigate ship domains, which is done by analysing how ships interact, using AIS data to calculate distances between ships and their relative bearings. AIS data are used as a historical dataset regarding ship movements at sea. The AIS data consists of position reports and various metadata about each ship, such as draft, ship dimensions, etc. (Raymond, Reference Raymond2014). The position reports are sent from each ship at an interval of 3 to 10 seconds while at sea, depending on the speed and turn rate. The AIS data used in this research was supplied by the Swedish Maritime Administration (SMA) for 2016 (1 January to 31 December). The positions are combined pairwise into line segments, where some intermediate positions are dropped if they travel in a straight line; this is to save storage space and speed up analysis. In the end, each travelling ship will generate a large set of line segments, all stored in a relational database with support for geospatial datatypes. Not only does storing AIS as line segments make storage requirements smaller but this approach also makes selecting geographically constrained subsets more reliable, because the selection will contain the AIS line segments even if the endpoints of those line segments are outside the selection area. The transformation into segments includes checks that the data are reasonable, and unreasonable AIS data is disregarded. The line segment approach is similar to the AIS trajectories that Zhang et al. (Reference Zhang, Liu, Cai, Wu and Shi2016a) used.
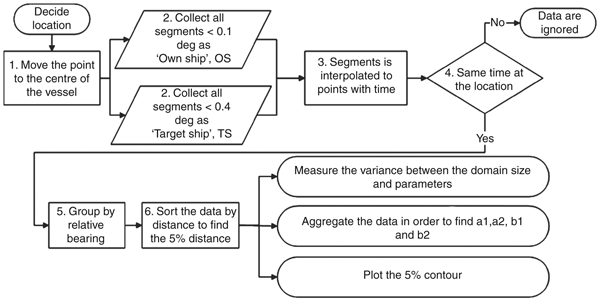
The methodology used in this research to determine the ship domain is a statistical method, illustrated in Figure 2. The term statistical is very broad and could be used to describe an analysis based on interviews as well as visual observations from land. The authors of this paper propose that statistical methods are subcategorised and that the analysis in this paper be labelled a sensor data-driven statistical method. Finally, within earlier research, many terms (comfort ellipse, effective domain and ship domain) have been used, though, in principle, they refer to the same thing; for consistency in this paper, the term used is ship domain.
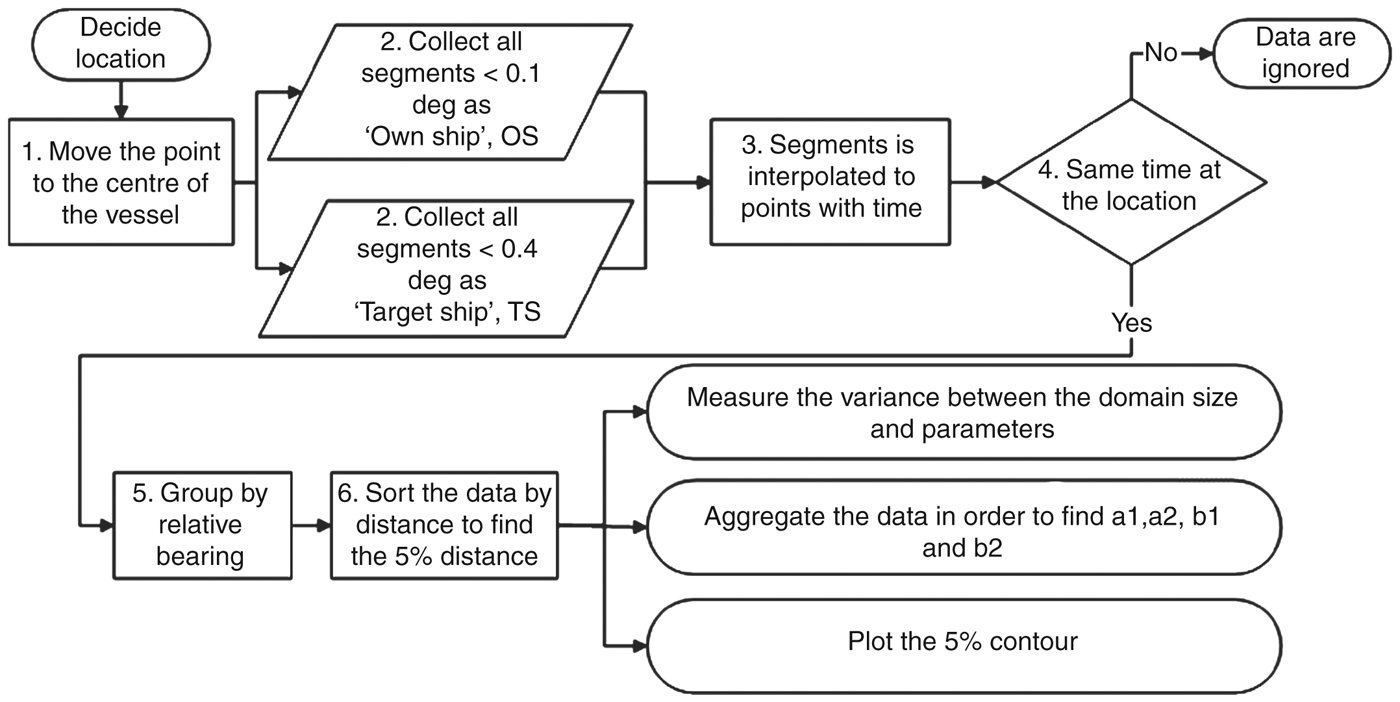
Figure 2. The methodology, how the ship domain is derived from AIS data in this study.
The methodology described in Figure 2 is divided into seven steps prior to the final analysis of the data. The seven steps are described below, followed by a demonstration of the methodology.
Step 1 – Calculate the ship centre position. Given that the position of antennae on board ships varies, this paper suggests that it is relevant to measure the distance from the centre to centre of ships. The position of the antenna relative to the ship is transmitted in the AIS message as four distances; A, B, C and D (see Figure 3) and is recalculated into the centre point of the ship.
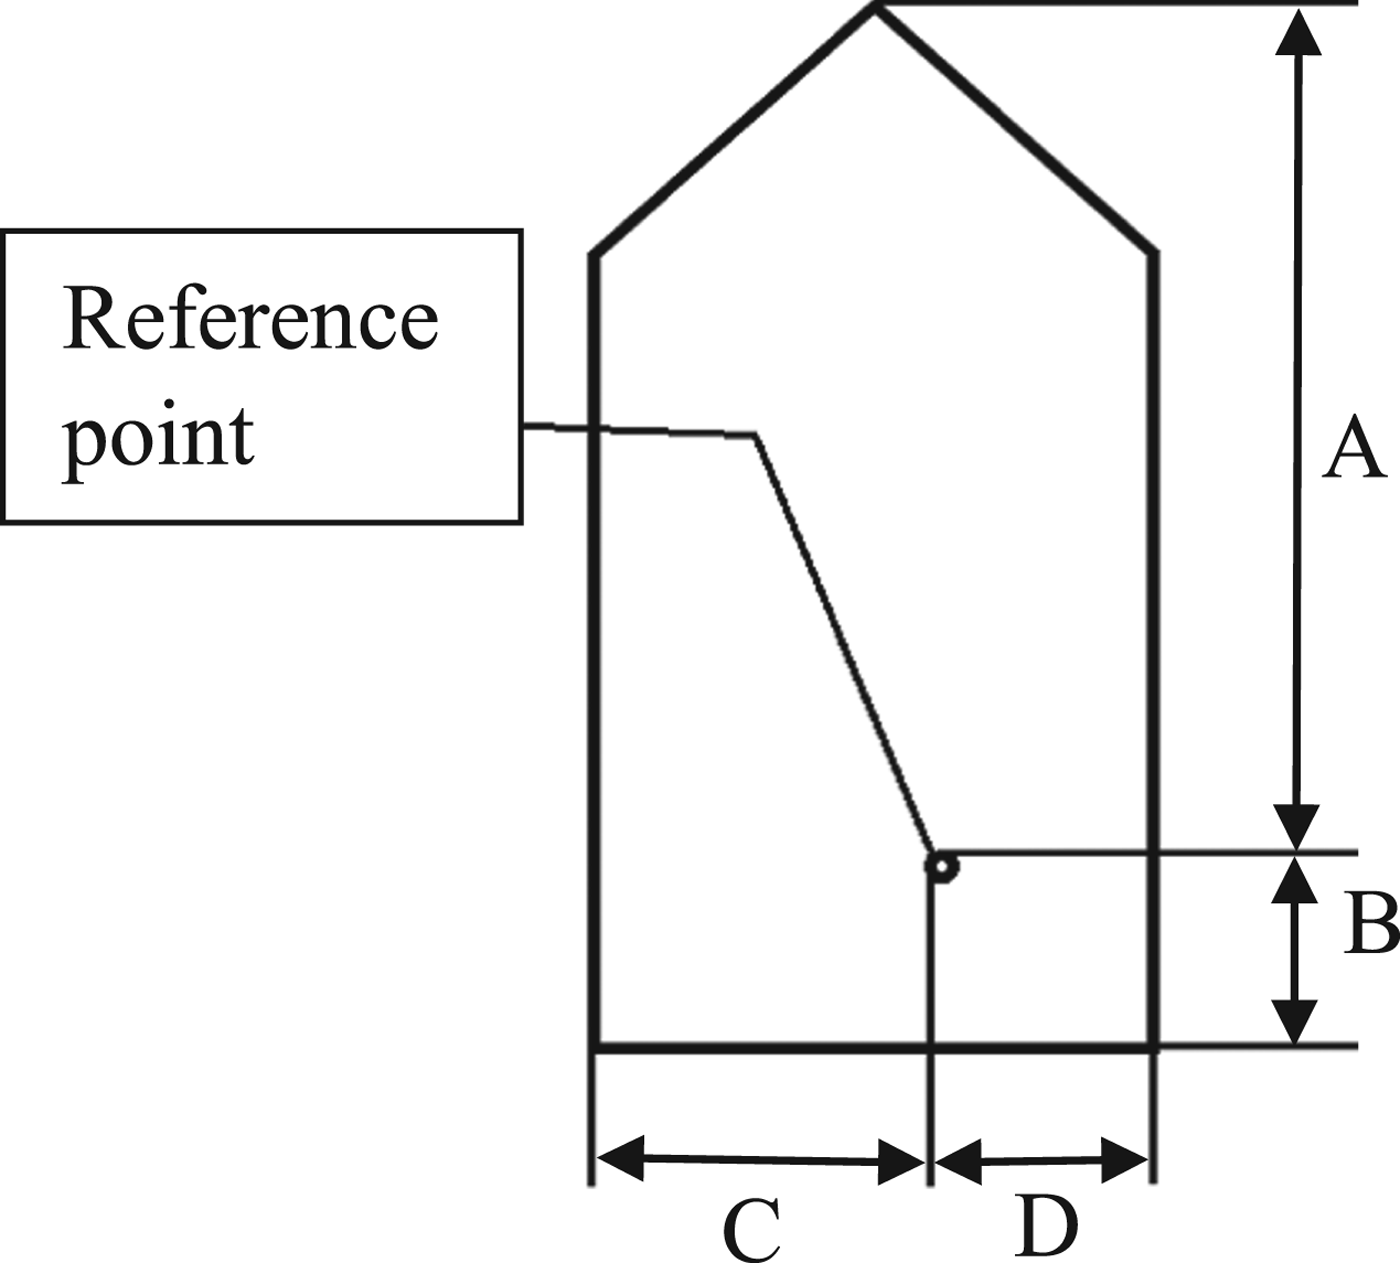
Figure 3. AIS position on a ship.
Step 2 – Data collection for Own Ship (OS) and Target Ship (TS). Two separate sets of data are compiled, one set for OS and one for TS. The OS dataset is defined as ships passing less than 500 metres from the centre point of each investigated area. The selection of TS is defined in a similar way, and includes ships passing the point within less than 5,000 metres. The actual query to the database is done in latitude and longitude, so the selection distances will differ slightly, but all of the investigated areas have at least the distances listed above.
Steps 3 and 4 – Interpolating the data into time points. The segments representing the OS and TS paths are interpolated into a point every second, which makes it possible to synchronise the datasets in time. Points without any OS and TS present at the same time are disregarded.
Step 5 - Group by bearing. When the distance and relative bearing between OS and TS are calculated, OS is assumed to be in the origin and rotated “head-up”. All TS at distances less than 5,000 metres (approximately 2·7 NM) are included in the study. This approach follows earlier research: Chang et al. (Reference Chang, Hsiao and Wang2014), used 2 NM, as the maximum distance between OS and TS, Gucma and Marcjan (Reference Gucma and Marcjan2012) used 2·5 NM and Hansen et al. (Reference Hansen, Jensen, Lehn-Schiøler, Melchild, Rasmussen and Ennemark2013) used 3,500 metres. The TS distances are grouped by their relative bearing into 5° groups, resulting in a total of 72 groups.
Step 6 – Building the ship domain from the groups. The data in each of the 72 groups are then ordered by distance, and the 5% radial distance point in each group is identified. The ship domain is the polygon constructed by interconnecting all of the 5% points. Five percent is chosen as the inner limit of the ship domain, since it represents 2σ in a normal distribution, in line with Chang et al. (Reference Chang, Hsiao and Wang2014), who made similar assumptions when plotting the ship domain. It is also required that the 5° direction contains data from more than five different intersections. Hansen et al. (Reference Hansen, Jensen, Lehn-Schiøler, Melchild, Rasmussen and Ennemark2013) used 5% of the most often observed distances in the T-route study. The distance between OS and TS was measured in a unit unrelated to the ship length (metres or nautical miles), which is used also by other researchers such as Godwin (1975), Coldwell (Reference Coldwell1983), Gucma and Marcjan (Reference Gucma and Marcjan2012) and Pietrzykowski and Magaj (Reference Pietrzykowski and Magaj2016).
Step 7 – Parametric analysis. To investigate which factors directly or indirectly influence distances between ships in close situations, Pearson correlation coefficients (Pearson, Reference Pearson1895) between physical dimensions were calculated. For each meeting/overtaking/crossing, the closest distance between the OS and TS was analysed against each of the properties (length, width, speed, and draught) of the OS and TS.
2.1. Demonstration of the methodology
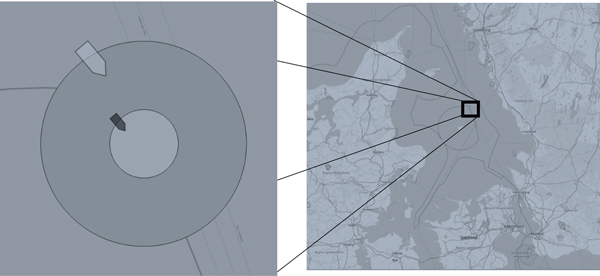
This section illustrates the methodology with an overtaking situation in the “T-route” outside the Danish island Anholt, which is the main passage into the Baltic Sea. In Figure 4, the darker (smaller) ship is intersecting the inner circle, here defined as the OS, the lighter (larger) ship is the TS.

Figure 4. Example of an overtaking situation.
Figure 5. Map of the Kattegatt.
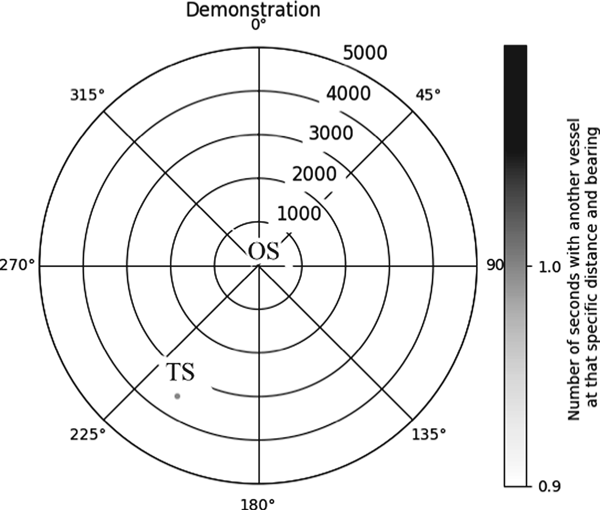
Data was collected every second that the OS intersects the inner circle in Figure 4, and the TS is within the larger circle, and then generates one relative bearing and one distance each second. Everything that is within 5,000 metres is kept for the next part of the analysis. The first second the OS enters the inner circle can be illustrated as one dot in a polar diagram, see Figure 6.

Figure 6. Example of the first second plotted in a polar diagram.
The intersection in Figure 4 is rotated so that the TS is plotted at the relative bearing to the OS, depicted in Figure 6. In the first second of the analysis, the TS is illustrated by the dot at approximately 3,500 metres and a relative bearing of 210°. By aggregating all the intersection data for each second during an entire year, the traffic density in a single location is generated, as shown in Figure 7.
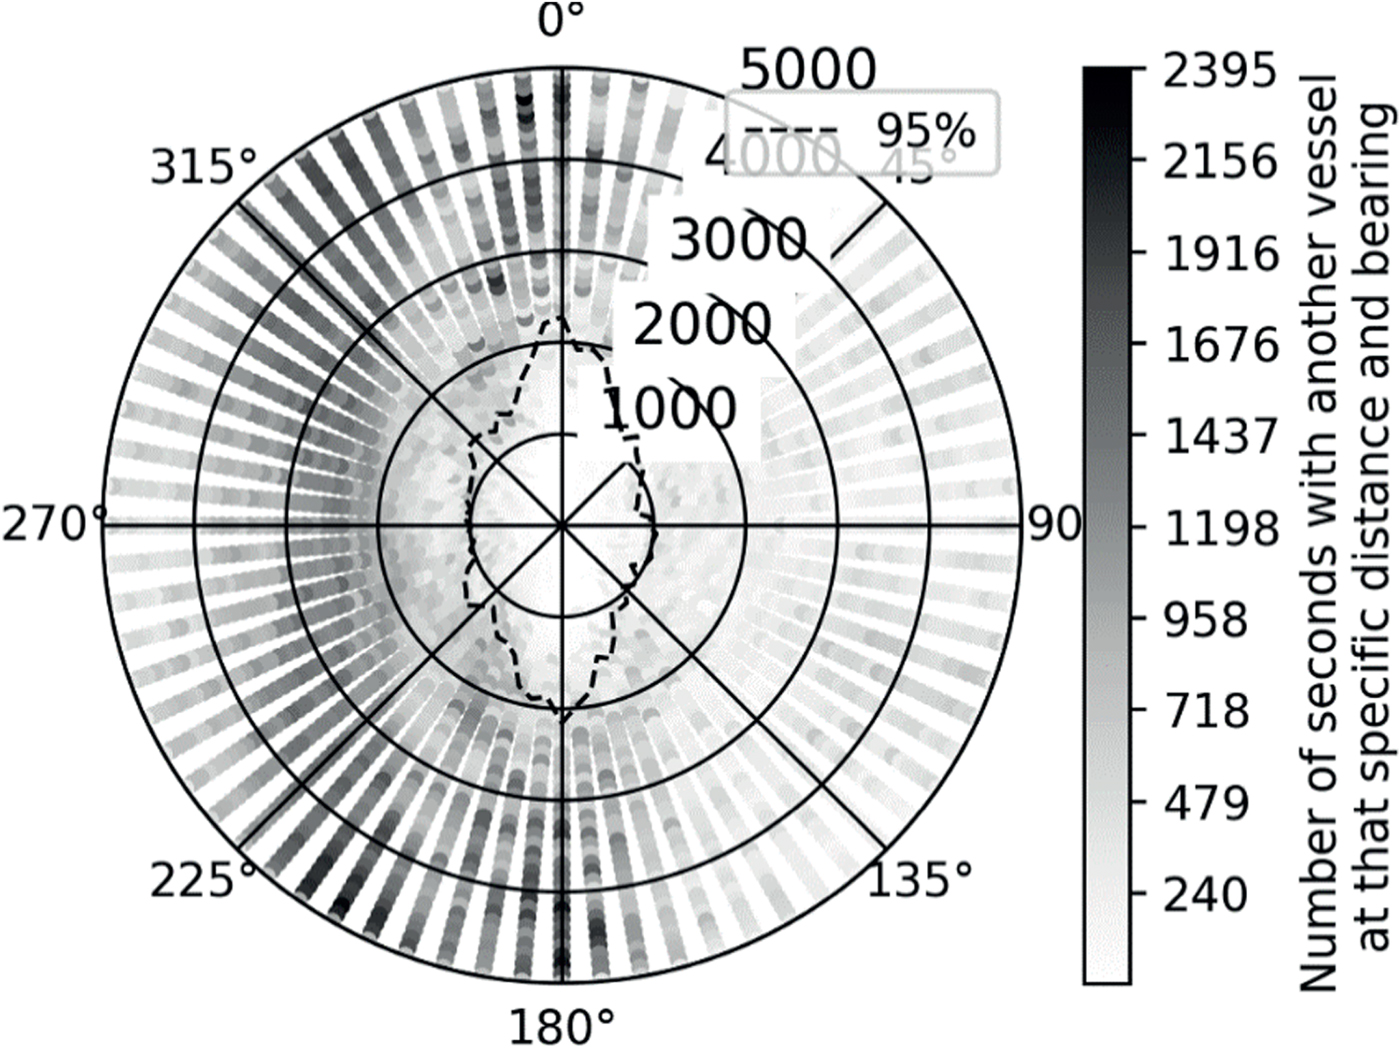
Figure 7. One year of data at the location in Figure 3.
The dotted line, defined as 95% or the 2σ line, in Figure 7 represents the ship domain, that is, the distance describing where less than 5% of all passages occur inside, grouped radially in every 5° direction. Given the resemblance of the dotted line to an ellipse, it is suggested that the ship domain is elliptical, which also follows earlier research, for example, Hansen et al. (Reference Hansen, Jensen, Lehn-Schiøler, Melchild, Rasmussen and Ennemark2013), Gucma and Marcjan (Reference Gucma and Marcjan2012) and Chang et al. (Reference Chang, Hsiao and Wang2014). There are some light grey dots inside of the 95% area in Figure 7, which illustrates that there are a few ships passing each other at a very short passing distances, where most ships pass more than 2,000 metres on the portside (180-360°) of the OS.
The ship domain is defined here by the lengths a1, a2, b1 and b2 (see Figure 8). The length a1 is the average distance to the 2σ line at 355°, 0° and 5° in order to obtain a smooth ship domain. Likewise, the length a2 is the average distance to the 2σ line at 175°, 180° and 185°; length b1 is the average distance to the 2σ line at 85°, 90° and 95°; and the length b2 is the average distance to the 2σ line at 265°, 270° and 275°.
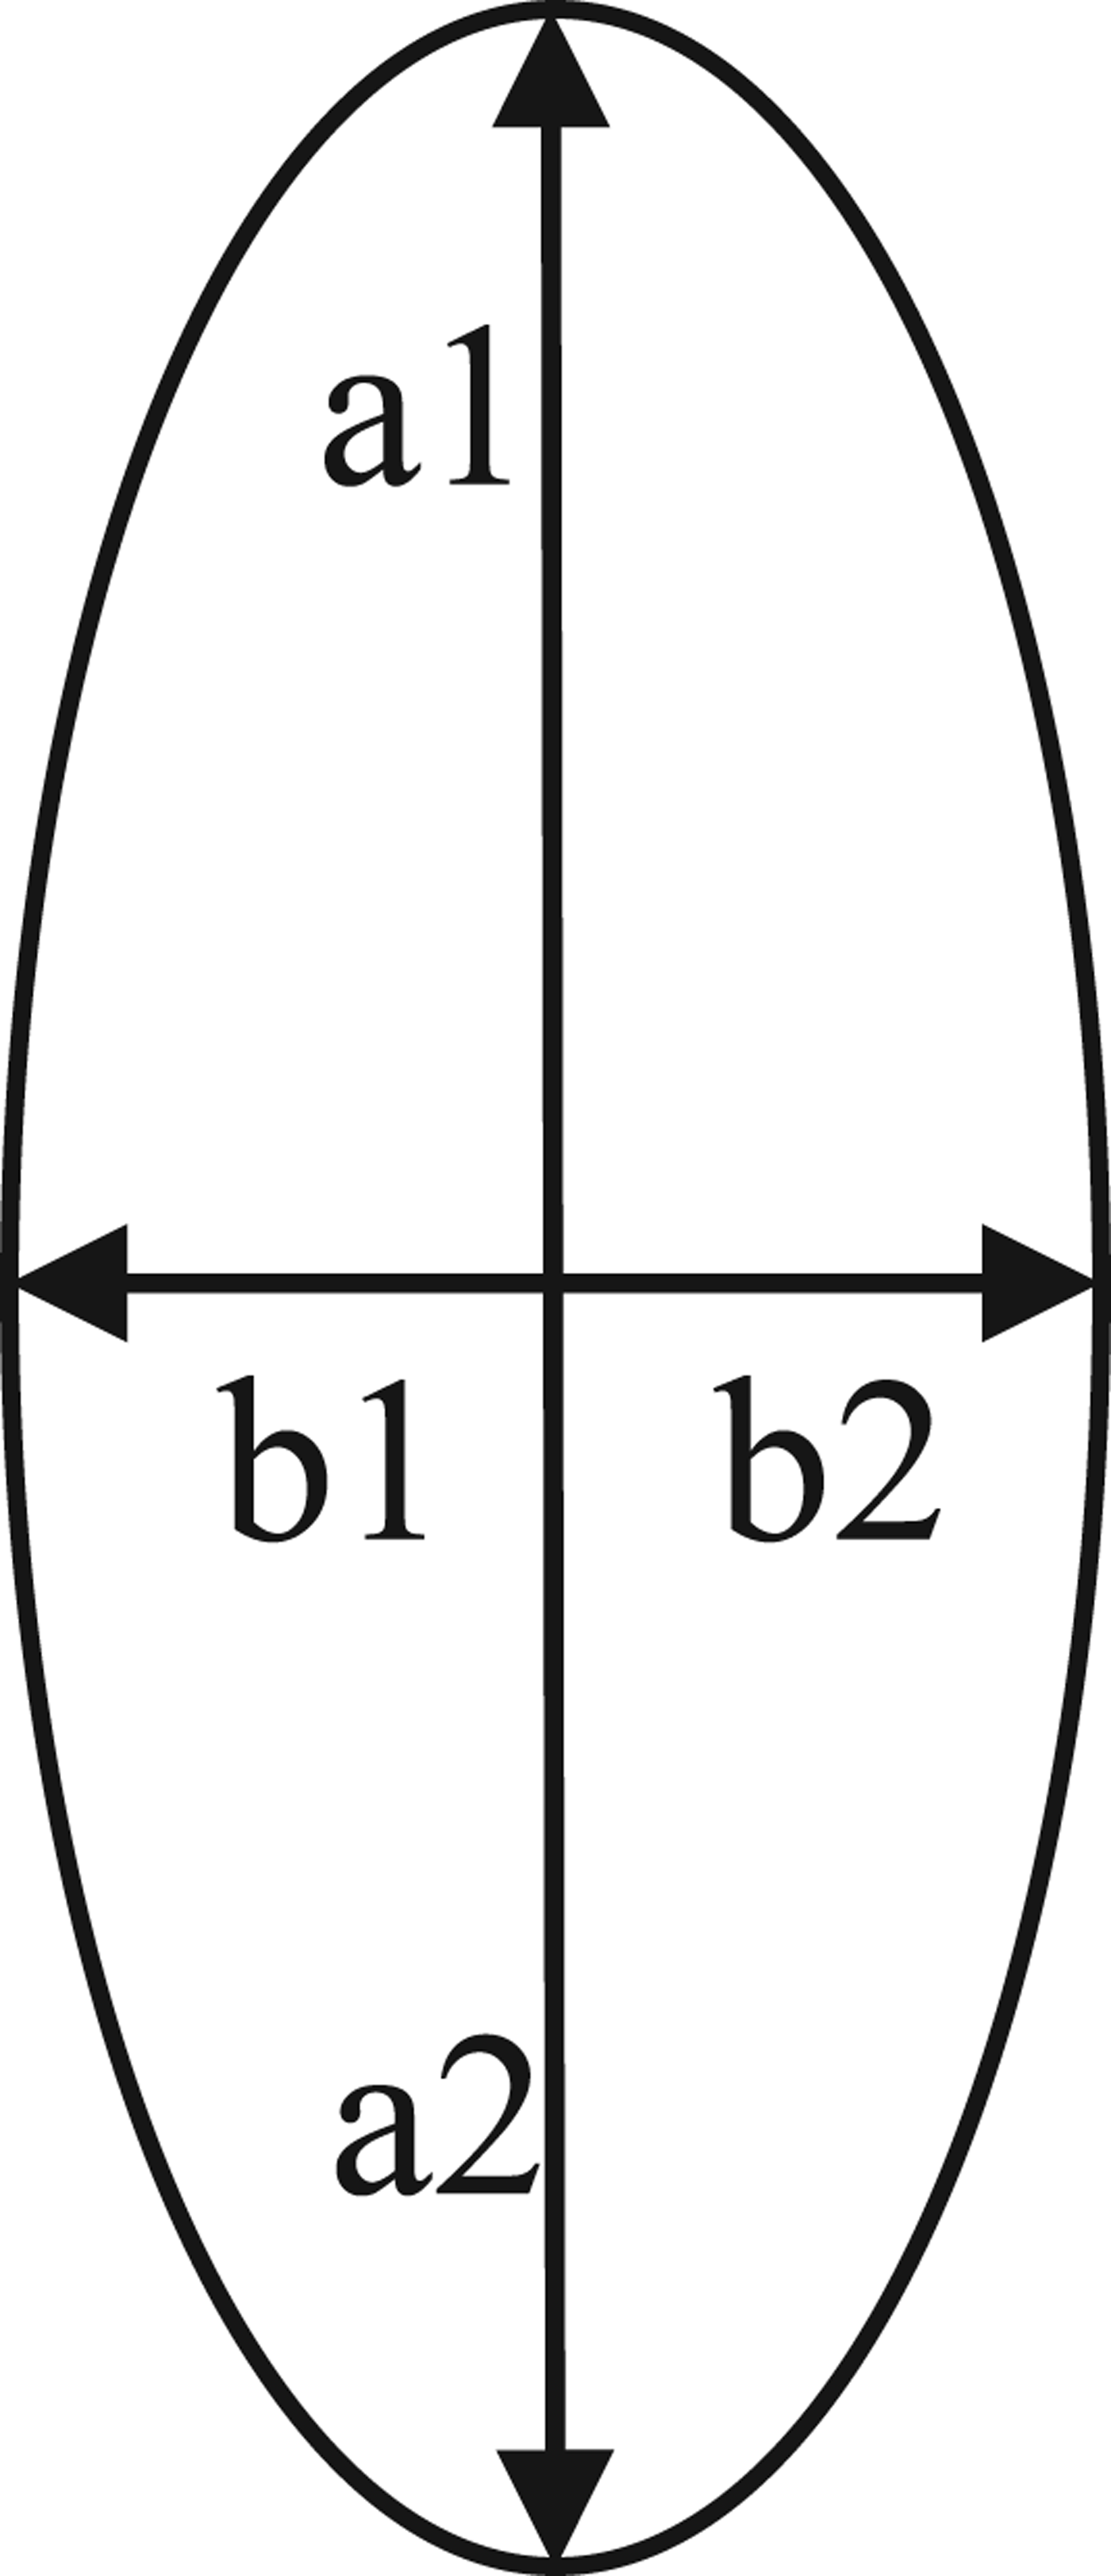
Figure 8. Ship domain with the variables a1, a2, b1 and b2.
3. CASE STUDY
To assess how ship domains vary under different geographical settings and in different types of meetings, a case study using the method developed was set up. In total, 36 different locations were studied, where there is potential for near ship situations, all near the Swedish coast within the SMA's AIS coverage (see Figure 9). The locations were chosen based on a sampling strategy to obtain a diversity of case characteristics in terms of different types of intersections, different amounts of open water, and a few unique cases, for example, with respect to a narrow passage under the Öresund Bridge, the inlet to the port of Gothenburg, and the Skagen junction, which is often argued as chaotic by mariners. The 36 locations are divided into seven areas: Skagerrak, Kattegat, Oresund, Bornholmsgatt, Baltic Sea, Sea of Åland and Bothnian Bay. In Table 12, each location is listed with coordinates and classified into crossings, junction, turns, channels and Traffic Separation Schemes (TSS).

Figure 9. Map showing the investigated areas.
In line with Chang et al. (Reference Chang, Hsiao and Wang2014) and Gucma and Marcjan (Reference Gucma and Marcjan2012), who made similar distinctions of intersection types, each location was studied in four different aspects: all types of intersections; only head-on meetings (intersections with a relative bearing of 170° − 190°); only overtaking situations (intersections with a relative bearing of +/- 67 · 5°), and only crossing situations (intersections with relative bearing 67 · 5° − 170° or 190° − 292 · 5°).
4. RESULTS
Ship domains have been calculated for each of the 36 locations, 24 in open waters and 12 in restricted waters; full numerical results can be seen in Table 1. First, the variation of ship domains depending on geographical characteristics is shown. Second, variations of ship domains depending on the type of intersections in open waters is shown. Finally, a parametric analysis has been performed.
Table 1. The ID, longitude, latitude, types of intersections, number of meetings and a1, a2, b1 and b2 of all investigated locations in Figure 9, NA = Not possible to draw conclusive results.

The average values of the parameters that define the ship domain, in locations referenced as open waters in Table 1, are 1,687 metres (A1); 1,615 metres (A2); 827 metres (B1); and 909 metres (B2). This indicates that the ship domain is approximately 0 · 9 × 0 · 45 NM. The ship domain has a slight offset with a longer distance ahead than astern, and a longer distance to starboard than to port. This offset is in line with Godwin (1975) as well as Gucma and Macjan (2012) who also observed an offset of the ship domain with smaller distances astern and to port. Quantification of the offset, observed in this article, can be addressed in future research.
4.1. Influence of geographical characteristics on shape and size of ship domain
The illustration of the 2σ lines for four cases (6, 15, 17 and 24) can be seen in Figure 10. The lines for the Kattegatt and Bornholmsgatt locations have a similar size and shape, and the locations represent what is typical for open waters with predefined routes and/or TSS. In contrast, the Öresunds – Drogdgen Channel is a narrow passage (in a channel), which illustrates that the 2σ line forms an oblong shape. Furthermore, Öresund – East of Ven represents a case with dense crossing traffic, which renders a 2σ line with a smaller, more circular shape. Thus, these cases illustrate that the ship domain is similar in open waters and decreases in restricted waters. This is, of course, expected since ships keep a closer distance rather than risk running aground; it also proves that the static shape and size of the ship domain becomes dynamic in restricted waters.

Figure 10. Example of ship domains in different locations.
4.2. Influence of type of intersections in open waters on the shape and size of the ship domain
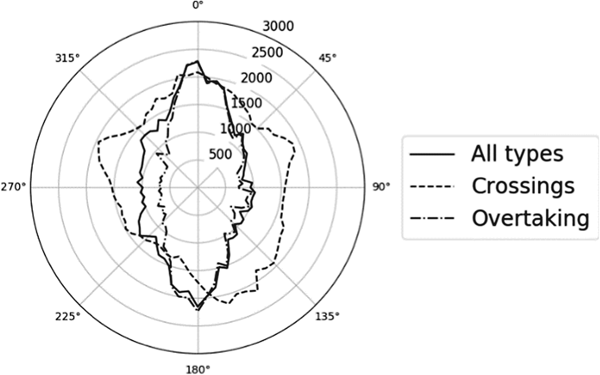
Figure 11, representing location 6, is used as an example to illustrate that the ship domain differs for different types of intersections in open waters (the same solid line as in Figure 10, 15,914 ship pairs and 2,399,886 distances). The dashed line illustrates the ship domain for crossing situations (179 ship pairs, generating 20,362 distances), and the dashed dotted line illustrates the ship domain for overtaking (7,030 ship pairs and 1,196,208 distances). The ship domain is formed as an ellipse in overtaking situations, and in crossing situations the ship domain is shaped as a circle.

Figure 11. Example of ship domains in different types of intersections.
Head-on meeting situations with ships on collision courses in open waters are rare, and only a few locations had a sufficient amount of ship passages in all 72 directions, according to Step 6 in the methodology. It is rare that ships are on head-on collision courses and pass each other starboard-starboard. The reason is that most traffic is organised in fairways separating ships with opposite courses.
4.3. Analysis of other factors
The Pearson correlation was calculated between the closest point of approach within the a1 (TS with a relative bearing between 355° and 5°), a2, b1 and b2 areas, and the ships' LOA, beam, draught and speed over ground for all open water areas. The results are presented in Table 2 where a Pearson correlation coefficient of 1·0 or −1·0 means that there is a perfect linear correlation. A coefficient of less than 0·3 means that there is low linear correlation, which indicates that the two variables are not correlated. There is no clear linear correlation between the distance and any of the ship dimensions or the ship speed.
Table 2. Pearson correlation between the passing distance and LOA; beam; SOG; draught for only OS and for OS and TS with similar values for all open water locations

Since the Pearson correlation is a measure of linear correlation between two parameters, it is plausible that a non-linear relationship exists. As an alternative to Pearson correlation of ship lengths, the ship domain is constructed for different sizes of vessels in Figure 12. In order to eliminate cases where the ship domain is determined by a smaller or a larger TS the “ship length” illustrated in Figure 12 is limited to when both OS and TS are within the same “40 metres bin”.

Figure 12. The ship domain for different ship sizes compiled from all open water locations. The length of the ships (both OS and TS) is binned into 40 metres intervals and the distance to the 5% line is plotted.
Some differences could be observed in the ship domain for different sizes of vessels: vessels between 60 and 100 metres tend to meet slightly closer than larger vessels. The difference between the other groups of ship size has no statistically significant difference in size of the ship domain.
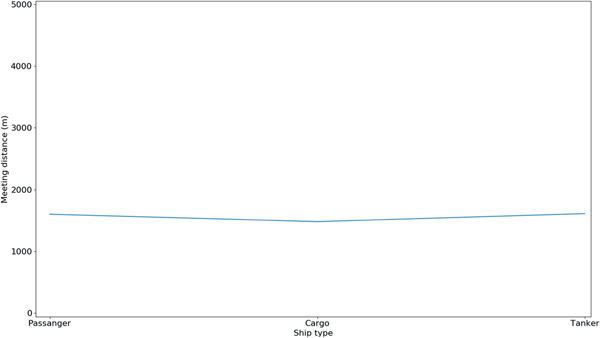
It is not possible to measure the type of ship as a correlation since it is not a continuous variable. Instead, type of ship is a list of groups such as container, cargo, tanker, etc, for which the Pearson correlation is not applicable. Figure 13 is an illustration of the minimum passing distances between OS and TS in one of the Kattegatt locations, grouped by OS ship type. The lack of offset between ship types shows that the ship type does not affect the ship domain. All the investigated areas in open waters have a similar lack of pattern, as illustrated in Figure 13. This confirms the work of Gucma and Majcan (2012) who concluded that the ship type does not influence the ship domain.

Figure 13. The a1 value (bow) value of the ship domain for three different types of vessels compiled from all open water locations.
5. DISCUSSION
This paper has shown that geographical characteristics, as well as the type of crossing, influence the shape and size of ship domains. Hence, this paper extends the research of Fujii and Tanaka (Reference Fujii and Tanaka1971). In contrast, through the use of AIS data, it has been shown that the sizes of both TS and OS do not influence ship domain. This does not imply that Fujii was wrong when he started this research field; the authors of this article believe that what is considered as normal has changed. The length of the ship is less important and does not influence the size of the ship domain. The reason for this might be due to the introduction of Electronic Chart Display and Information Systems (ECDIS) and AIS, which have improved the seaman's spatial awareness and ability to plan ahead. Another reason might be that navigation teaching has changed, promoting a larger passing distance. Therefore, it is recommended that LOA should not be used as a determinant of the ship domain, instead it is recommended to use a static ship domain in open waters and a dynamic ship domain in restricted waters.
The findings are, to some extent, in contrast with earlier research; for example, Hanssen et al. (2013) showed that a1 and a2 of the ship domain in the Drogden Channel were 440 metres (expressed as four times LOA with an average length of 110 metres), whereas this paper showed that the average length of a1 and a2 were 1,411 and 1,473 metres, respectively. The difference could be attributed to the methodological assumption of maximum distance to TS. The assumption affects the results since the 2σ line is dependent on it. A greater maximum distance to target ships increases the probability that the 2σ line increases since it is likely that more ships pass at a distance greater than the 2σ line. The effect of this will differ from location to location, that is, the distance to the 2σ line will be more affected at locations where there is a lack of traffic planning and the traffic is spread over a larger area than at locations where the traffic is more organised. Figure 14 illustrates that with a greater distance to maximum TS from OS, the larger the ship domain becomes. Hence, given that this paper used a maximum distance of 5,000 metres in comparison to the 3,500 metres in Hansen et al. (Reference Hansen, Jensen, Lehn-Schiøler, Melchild, Rasmussen and Ennemark2013), it shows that it is of significant importance to accurately choose the maximum distance to TS from OS, which will vary in different locations.

Figure 14. The same area, with all types of intersections, hence different maximum distances to the target ship.
The effect of maximum distance on the size of the ship domain may be considered as a weakness in statistical methods using percent-based measurements, which is highlighted in Figure 14. The results show a bulge between 270° and 315° for 7,000 and 10,000 metres and illustrate the effect when too large an area is included and unrelated data clutter the result. This needs further elaboration in future research.
A potential limitation of the methodology in this paper is the requirement of the number of ship pairs in each 5° group. In the methodology, there are two requirements on the lengths of a1, a2, b1 and b2: (1) the data has to be generated from more than five different ship pairs; and (2) the difference between each subsequent 5° group is a maximum of 500 metres. This is necessary to ensure that a few ship intersections define normal behaviour, which may not be representative for a normal population. In further research a local maximum criteria and a tilted ship domain proposed by Pietrzykowski and Magaj (Reference Pietrzykowski and Magaj2016) could be included in similar analysis.
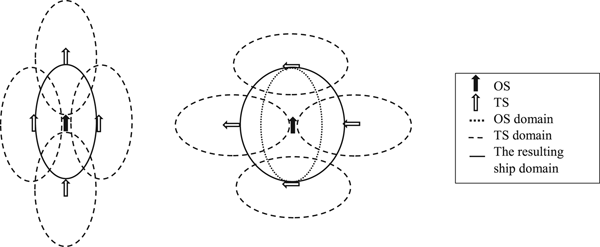
As this paper has shown, it is suggested that the ship domain in overtaking situations resembles an ellipse, whereas in crossing situations, the ship domain resembles a circle. The difference in the shape of the ship domain strongly indicates that there is one ship domain per ship in an intersection, one for the OS and one for the TS, which forms one resulting ship domain for the situation. This is illustrated in Reference Pietrzykowski and MagajFigure 15, where the OS and four different TS illustrate how their ship domains affect the resulting ship domain in the situation. In the overtaking situation (on the left-hand side in Reference Pietrzykowski and MagajFigure 15), the resulting ship domain has the same size as the OS ship domain; however, in the crossing situation, both the OS and TS ship domains affect the resulting domains (illustrated on the right-hand side in Reference Pietrzykowski and MagajFigure 15). The elliptical ship domain is similar, in both shape and size, to the ship domain proposed by Pietrzykowski and Magaj (Reference Pietrzykowski and Magaj2016).

Figure 15. The difference of the ship domain in an overtaking (left-hand side) and a crossing situation (right-hand side); the complete lines illustrate the resulting ship domains.
A path for future research is to analyse the impact of weather. Given that the AIS data used in this article is sampled from a complete year, it does not take into account how the ship domain may vary during different days as a function (effect of storms, visibility, wind, etc). Furthermore, the impact of daylight has not been analysed and is an interesting path for future research.
Another path for future research is to investigate how fairway restrictions influence the ship domain. Of particular relevance is to combine AIS data with fairway restrictions to assess how potential changes influence the ship domain. Additionally, understanding the impact of traffic density should be assessed, as it may influence the ship domain. Finally, of great interest is investigating to what extent fairways can be restricted before ship manoeuvrability endangers navigation safety, that is, when the concept of ship domains is not valid.
The practical use of the result of the research, what is considered as normal, can be used in studies focusing on spatial changes, such as building a bridge (for example, a more adaptive ship domain than proposed by IABSE) or implementation of a Traffic Separation Scheme, (TSS) (for example, what should be considered as a normal and required width of a TSS). Another application of the result could be in connection to failure simulations, for instance, how far away from another ship is it normal to be prior to a failure occurring. Furthermore, the principle of defining a ship domain, where everything that occurs outside is considered to be safe behaviour, is well in line with the concept of Safety II, used by Hollnagel (Reference Hollnagel2014), who focused on what goes right rather than what goes wrong as a measurement of safety.
6. CONCLUSIONS
In this paper, a methodology based on AIS data been developed in order to study how different parameters influence the ship domain. The first two major findings of this paper are: the geographical characteristics of different waters influence the shape and size of the ship domain; and the type of intersections influences the shape and size of the ship domain.
It has been shown that the ship domain has a static shape and size; in one of the more common situations at sea, an overtaking situation in open waters, it is formed as an ellipse with the half axes of 0.9 x 0.45 NM. However, it is observed that the ship domain decreases in restricted waters and adapts to the fairway restrictions. From the perspective of OS, the ship domain appears to change in a crossing situation, attaining a more circular shape. This, however, is an observatory issue, as when including the TS ship domain, the TS a1 and a2 have larger influence than the OS b1 and b2 on the resulting domain.
Furthermore, the intersection type where ships have opposite courses (head-on) does not generate a ship domain in most waters, as it is rare that ships are on head-on collision courses and pass each other starboard-starboard. The reason is that most traffic is organised in fairways separating ships with opposite courses.
Finally, one of the main findings, in contrast to earlier research, is that the size of the ship does not affect the size of the ship domain.
FINANCIAL SUPPORT
The authors are grateful for the financial support from the Swedish Governmental Agency for Innovation Systems; Interreg (ÖKS); the Norwegian Public Road Administration (NPRA); and Logistik och TransportStiftelsen (LTS).