


1. INTRODUCTION
The benefits of Global Navigation Satellite Systems (GNSS) and in particular GPS have been demonstrated worldwide, and continue to accrue in the form of new applications. Many of these applications are mission (e.g. safety) critical, in the sense that if the service fails (provides a significantly erroneous solution without annunciation within a given time) or is unavailable (provides no solution or one with an insufficient guarantee), users are either placed in danger or negative financial and/or social consequences may occur. Today, mission critical applications (largely driven by safety) mostly in aviation and to a less extent maritime, rely on one or more of Ground Based Augmentation Systems (GBAS), Space Based Augmentation Systems (SBAS) or Receiver Autonomous Integrity Monitoring (RAIM), and its variations for the provision of integrity monitoring services. However, for many applications such as those associated with the emergency services, road user charging and personal navigation devices, no such monitoring exists and service validation is limited due to technical and cost constraints. The problem is exacerbated by a recent increase in more challenging problems particularly in the security industry in which jamming devices have been used to disrupt the use of GPS. Furthermore, operations in challenging dynamic surroundings such as container bases and ports mean that the signal multipath and blockage environment is also dynamic. These complex situations make the detection, identification and isolation of failures a very difficult process.
The GNSS Availability Accuracy Reliability anD Integrity Assessment for timing and Navigation (GAARDIAN) system is designed to offer a cost effective local solution to these problems at the individual user level, by providing the user with information on Quality of Service (QoS). The system is based on the deployment of a single or network of probes supported by an existing regional network. The probes communicate with a central server and are designed to detect localised events whilst the regional network isolates space segment anomalies. The GAARDIAN system design includes novel techniques for the reduction of data transmitted between the probe network and server.
2. GAARDIAN SYSTEM DESIGN
2.1. High-Level System Architecture
The design of the GAARDIAN architecture consists of three main elements: probe, server and communication. The probe acts as a semi-portable station that executes specialised functions to detect failures, store data and reduce the amount of data to be transmitted to the central server. The server's role is to manage and process the data received from probes and external sources including the Ordnance Survey (OS) network. The server offers the users real-time access to the output of the probes (including anomalous events) and dedicated system (GPS and eLORAN) positioning/timing performance. Furthermore, it provides the probes with information on failures that have a regional impact. The GAARDIAN system schematic is shown in Figure 1.

Figure 1. GAARDIAN High level architecture.
GAARDIAN's QoS monitoring is designed to be flexible depending on the user application and the associated requirements. However, following a detailed review of user requirements, a minimum number of specific activities have been determined as:
• Interference Detection
• Failure Identification
• Required Navigation Performance (RNP) compliance
• Scientific data capture during interesting events
• eLORAN validation.
The specific functionality of the probes and the server, summarised above, are based on these activities. For example, the detection of local anomalies such as jamming is only possible if space segment borne failures are discounted. Similarly, space based failures contribute to user level (position domain) performance measured in terms of the relevant RNP parameters. For these two reasons, the server is designed to host the Space Segment Health Monitor (SSHM). It employs the UK regional OS network together with special algorithms to detect regional events. Section 2.2 provides an overview of the server architecture and functionality.
2.2. Server Design
The GAARDIAN server has a number of roles which it executes either in real-time or on demand. It provides a platform for the internet-based user interface or ‘dashboard’ from which users are able to access real-time monitoring updates, stored data and performance statistics. In addition to allowing access to events detected at the probes, the server engine amalgamates data from a number of sources to facilitate a decision based QoS algorithm, whose functions include:
• Notice Advisory to NAVSTAR Users Interface (NANUI)
• Navigation Message Check (NMC)
• Space Segment Health Monitor (SSHM)
• Ionospheric Monitor (IM) (proof of concept only)
The NANUI checks for NANUs from the US Coast Guard Navigation Centre (Navcen) on behalf of the GPS Wing/2SOPS. NANUs inform users of impending satellite maintenance due to planned manoeuvres, clock swaps and operational procedures, and associated changes to constellation health.
The NMC validates the navigation data utilised by the probes. Firstly, a reference navigation message is derived from the data received from the OS network, excluding any erroneously demodulated parameters as outliers. Then, as part of the SSHM, an arc of the estimated satellite trajectory is generated for this reference navigation message within its period of validity before being differenced from an arc computed from the International GNSS Service (IGS) Ultra-Rapid predicted orbits. Once the reference navigation message is verified, the probe navigation messages may be checked. This is achieved by computing a series of parity checks of the navigation message parameters, essentially reducing the data at each probe before communicating it back to the server. These checks are then compared at the server to the equivalent codes for the reference message.
Finally, the IM is included in the initial design to facilitate proof of concept in terms of the potential impacts of ionospheric anomalies which may be misinterpreted as space segment failures or localised effects.
3. SPACE SEGMENT HEALTH MONITOR
3.1. Failure Considerations
Underpinned by system requirements, the role of the Space Segment Health Monitor (SSHM) is to detect space and control segment borne anomalies and to provide a real-time estimate of the Signal-in-Space (SIS) errors (e.g. satellite orbit and satellite clock range). Failures which are the result of onboard events or errors in processing and uploading information to the satellite are either fully correlated or very highly correlated spatially. To facilitate the design of the SSHM, the relevant failure modes must first be identified together with their characteristics. The control segment failures may be the result of bad data from the monitor stations, software bugs, hardware malfunction, human error or incorrect upload. These failures would result in incorrect parameters being included in the navigation message transmitted to users, either in the ephemeris and clock correction values or the health and accuracy states. Satellite failures are also capable of impacting the orbit and clock directly due to unplanned physical effects within the active on-board atomic standard or potentially as a result of a satellite manoeuvre whose status is not updated in a timely fashion as part of the NANUs. Signal generation failures are also possible in the form of an evil waveform distortion which can have variable impacts on signals and their users. Table 1 summarises the relevant failure types.
Table 1. Space and Control Segment Failures (Milner, Reference Milner2009).

The majority of the space segment failures manifest as ramp/run-off or step-like errors. Therefore, the SSHM must be designed to protect against such failures and enable their early detection. To attain this goal, SSHM employs multiple monitors as described in section 3.3.
3.2. GPS Data Network
The UK based prototype implementation of the GAARDIAN system employs real-time GPS data from the OS network. Figure 2 shows all the OS network locations and those selected for use in the SSHM. The sites are chosen to maximise satellite coverage as they rise above and fall below the horizon (or mask angle). Implementations in other regions would likely follow the same methodology to maximise satellite coverage.
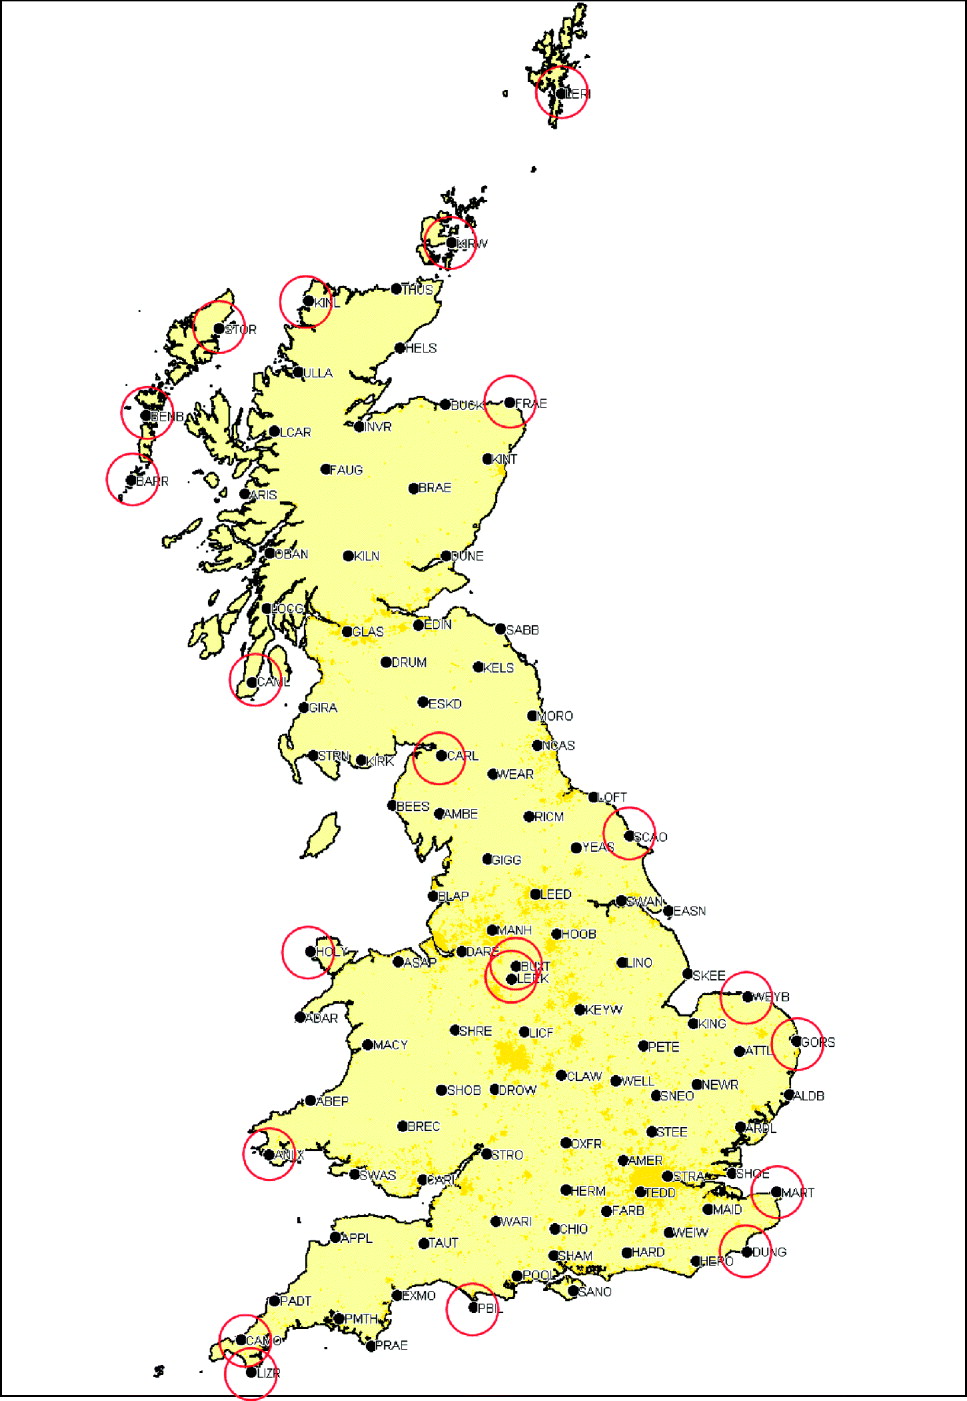
Figure 2. Ordnance Survey Network and GAARDIAN SSHM Sites (with permission of the OS).
3.3. Monitor Design
The failure modes in Table 1 form the basis for the design of the monitors to be employed to determine the health of the space segment. The first class of failures relates to the reliability of the navigation message. Sudden physical effects such as clock anomalies or manoeuvres of which users are not correctly informed (either as a result of wrong satellite health status or failure to issue the appropriate NANU) are not likely to impact the navigation message instantly. They are only indirectly influenced following signal reception at the monitoring stations. Although the use of the broadcast navigation message at the OS network within a positioning based monitoring solution would likely determine a failure within the navigation message had occurred, a simpler solution may be obtained using the International GNSS Service (IGS) Ultra Rapid orbit and clock products. The comparison between the two orbits and clock solutions forms the first monitor in the SSHM, as described in Section 3.3.1.
The second class of failures cause a sudden jump in the Instantaneous User Range Error (IURE). Such failures are step or bias like in nature and may be the result of a clock phase jump or other signal generation anomaly such as an evil waveform. To monitor such failures, real time processing is required. A simple code based step detector provides the necessary protection as described in Section 3.3.2.
Finally, ramp like or ramp rate errors are characterised by a progressive increase in the IURE. These failures may develop very gradually such that detection using the step detector is achieved only after a significant period of operation. To enable early detection of these errors, a ramp error detector has been developed using time-differenced carrier phase measurements. This is described in Section 3.3.3.
This parallel bank of three monitors is designed to enable early detection of failures with minimum false alerts. This is achieved by setting flexible thresholds, either from existing standards (DoD/DoT, 2008) or empirically on the basis of previous data, thereby automatically adapting to current performance.
3.3.1. Navigation Message Monitor (NMM)
A reference message is determined from the most recently received and demodulated message at the IGS and OS network. Each message is designed to be applicable for a period of two hours. Validation of the message is only undertaken once three separate OS stations have decoded the message and relayed it to the central GAARDIAN server. This is to ensure that the correct demodulation has been performed and to prevent possible false alerts from potentially less reliable data at low elevations (Beyerle et al., Reference Beyerle, Ramatschi, Galas, Schmidt, Wickert and Rothacher2009).
A satellite trajectory arc is computed from the resulting navigation message using the standard algorithm (e.g. Hofman-Wellenhof et al, Reference Hofman-Wellenhof, Lichtenegger and Collins2001) at regular intervals. The resulting Cartesian positions are compared to the equivalent positions determined from Lagrange interpolation of the IGS Ultra Rapid orbits, thereby producing an estimate of the 3D error vector. Similarly, an estimation of the satellite vehicle clock offset is determined from the three broadcast parameters and compared to the equivalent IGS Ultra Rapid clock product. An estimation of the User Equivalent Range Error (UERE) is derived from the Signal-In-Space Range Error (SISRE) formula, expressed in Malys et al. (Reference Malys, Lazeros, Gottschalk, Mobbs, Winn, Feess, Menn, Swift, Merrigan and Mathon1997) as:
where: R=radial ephemeris error; CLK=SV clock phase error (m); A=along track ephemeris error; C=cross track ephemeris error.
Alternatively, either the worst user location over the UK region (Feng and Ochieng, Reference Feng and Ochieng2006) or a fixed user location may be used to project the 3D position vector to the user range domain.
3.3.2. Code-Based Step Monitor (CBSM)
The design and development of the step detector initially considered a number of different approaches to estimate the user range error, i.e.:
• Independent stations, full positioning solution
• Independent stations, single satellite differences
• Network batch processing
The first approach uses the standard positioning algorithm and compares the ranges used in the final iteration to the known geometric ranges taking into account the necessary corrections. However, the observability of the range error is reduced due to the potential for a proportion of it to be assimilated within the estimated clock bias.
The second approach is formulated to overcome the shortcoming of the positioning solution approach. Instead of determining a position solution, it computes the difference between pairs of satellite ranges (single difference across satellites). These observables are then differenced from the corresponding ones from computed geometrical range pairs to generate an error estimation metric. In this approach, the receiver clock bias is eliminated through differencing. However, on detection of a gross error, the identification of the failed satellite would rely on analysing multiple pairs containing the satellite in question which would overcomplicate the failure detection process. Furthermore, the use of a differenced observable as the basis for a test statistic increases the variation in its values. This is as a result of the law of error propagation which accounts for the stochastic behaviour of both satellite measurements.
The network batch processing approach combines the measurements received from all stations in the network into a single least squares estimation or filter. However, the requirement for real-time operation adds a level of complexity. Furthermore, there is an added complexity associated with the detection and exclusion of malfunctioning stations.
The approach taken for the CBSM is to estimate the receiver clock bias while holding fixed the known coordinates of the stations. In addition, to avoid the dependency outlined above, this estimation is undertaken for a series of subsets, sequentially removing each satellite. The estimates for the user to satellite range in question are derived from the receiver clock bias estimation which does not utilise the pseudorange measurement concerned, thereby preserving the independence between the satellite-user range error to the receiver clock bias. This process is intended to maintain robustness and reliability of the monitoring scheme. Naturally, the removal of a satellite has a detrimental impact on the geometry. A measure of the magnitude of this impact can be obtained from the Dilution Of Precision (DOP), comparing the full and subset values. The (Time) DOP is defined from the scalar (as a result of constraining the solution) cofactor matrix Q as follows:
![$$A = \left[ {\matrix{ C \cr \vdots \cr C \cr}} \right]\quad or\quad A = \left[ {\matrix{ 1 \cr \vdots \cr 1 \cr}} \right]$$](https://static.cambridge.org/binary/version/id/urn:cambridge.org:id:binary:20151022041734343-0171:S0373463311000269_eqn4.gif?pub-status=live)
(expressing clock error parameter in seconds as opposed to metres)
From this analysis it is clear that the impact of degrading the geometry through removal of a single satellite is minimal and is bounded by a maximum factor of 1·2 relating to the drop from five to four satellites in view.
The error estimation is repeated for each station and the median of the derived metrics for each satellite is taken as the statistic for fault detection. A parallel assessment of the worst case station is performed to isolate poor performing stations as and when required.
3.3.3 Time Differential Carrier Phase Monitor (TDCPM)
In order to detect ramp errors it is possible to utilise the code measurements processed in the CBSM to detect accumulated errors. However, the lower noise level associated with carrier phase measurements presents the possibility of a more precise estimation. Carrier phase positioning usually involves integer ambiguity estimation required to enable the absolute range to be determined. This is a complex process which, given the aims of GAARDIAN, is unnecessary. However, detection of relative errors or temporally growing errors does not require knowledge of absolute ranges as time differenced measurements are sufficient. On this basis, time differenced carrier phase measurements are used in a similar fashion to the code-based step detector, estimating the rate of change in the clock bias between epochs.
Like its code-based counterpart, this detection function is immune to isolated receiver failures such as cycle slips. The use of the median operator over the station set maintains robustness against any errors which are not observed at the majority of stations. This should also reduce the impact of noise on the signal delay residual and receiver errors.
3.4. Threshold Setting and Detection
The aim of the SSHM is to detect gross errors and failures originating from the control and space segments. In order to set a detection threshold for the CBSM and TDCPM, estimates of the variances of the metrics are needed to relate performance to known predefined detection probabilities which are closely related to integrity. Standards have been defined for the Signal-In-Space (SIS) which account for range and range rate performance up to the point of transmission. The satellite broadcast User Range Accuracy (URA) quantifies the SIS ranging performance. However, as the GAARDIAN network is ground based, additional error variances must be included to estimate the accuracy of the UERE. The variance may be defined empirically through testing and characterisation or by the use of models. Models for the UERE variance are well defined in many applications (e.g. ICAO, 2006):
where σ iono2 is the variance of the ionospheric range residual after correction using the single frequency model, σ tropo2 is the variance of the tropospheric model and ![]() is a measure of the multipath and noise.
is a measure of the multipath and noise.
A definition of failure with a corresponding threshold is also specified in the GPS Standard Positioning Service (GPS) Performance Standard (DoD/DoT, 2008). A failure is defined to occur when the SIS error exceeds 4·42 times the User Ranging Accuracy (URA) variance and is expected to happen with an integrity risk (probability of occurrence) of 10−5 per hour per satellite. However, although this definition may be viewed as a potential basis for failure detection, it relates to the expected system performance and may not equate to specific user requirements. The flexibility of the GAARDIAN concept relies on the ability of users to set their requirements in terms of a prescribed integrity risk (p user). Therefore, the threshold for detection is defined as follows:
where Q −1( ) is the inverse Gaussian function. The metrics used in the CBSM and TDCPM may be overbounded by a Gaussian distribution function with zero mean and standard deviation σuser.
For the range rate measurement relevant to the TDCPM, expected variances are not well established. There is no specified standard for the User Range Rate Accuracy (URRA) but a 6-sigma upper bound of 0·02 m/s over three seconds at any Age of Data (AoD) is stated for design purposes (DoD/DoT, 2008). This equates to σURRA=0·0033 m/s. However, the impact of changes in the atmospheric delays, multipath and noise over the measurement interval are not accounted for. One study of ionospheric delay effects on the range rate measurement found that, at a low point in the solar cycle, variations of 0·005 m/s were observed, averaged over a minute. These values are expected to be three times greater at solar maximum (Doherty et al, Reference Doherty, Raffi, Klobuchar and El-Arini1994). Further variations may be expected from changes in the tropospheric delay, multipath components and receiver noise which varies over a 1 s period. The degree of temporal correlation which determines the variation of these error sources may also vary over time. For these reasons, it is more appropriate to utilise an empirical estimate of the expected magnitude and deviation of the TDCPM metric, determined from the previous day's data.
Figure 3 provides the schematic for the SSHM including the parallel operation of the CBSM and TDCPM. The green components refer to the treatment of the instantaneous user range error estimates for each satellite and each station. On taking the median over all stations, the metrics relate to a per satellite basis, highlighted in red.

Figure 3. SSHM Monitoring Process.
4. SSHM OFFLINE TESTING
4.1. Fault-Free Data Analysis
Initial testing of the monitoring network and algorithms involved the processing of the observed measurements to generate the required CDSM and TDCPM metrics. This checking and validation mechanism is first used to isolate any stations in the network which are not providing high quality data relative to the network. For October 2010, the “GORS” station (Figure 2) was found to most frequently give the highest results for the TDCPM metric as shown in Figure 4 (left). However, for the same period, a relatively even distribution of worst stations was found for the CDSM metric, shown clearly in Figure 4 (right).

Figure 4. Worst station TDCPM (left). Worst station CBSM (right).
The occurrence of such network anomalies may be easily overcome by using a neighbouring station such as “ALDB” (shown nearby in Figure 2) to replace the “GORS” stream.
In the following analysis, the median station values are used for the CBSM and TDCPM test statistics. An initial observation of the output data suggested that satellites at low elevations with low station coverage generated larger values for the test statistics, as expected from the impact of elevation dependent error sources. These two variables are highly correlated, although other data shortages can occur for satellites at high elevations. Figure 5 presents the TDCPM metric as a function of satellite coverage, i.e. the number of stations tracking and observing the respective satellite. It is clear that outliers are more prevalent when coverage is low. Similarly, Figure 6 shows that the majority of outliers in the TDCPM metric are at low elevations.

Figure 5. TDCPM vs. Satellite coverage.

Figure 6. TDCPM vs. Elevation.
On the basis of these results and the poor performance of satellites with low coverage and at low elevations, monitoring status levels can be defined to facilitate high usability and applicability to the GAARDIAN dashboard user interface. Specifically, four possible categories are identified. These are No Coverage, Observed, Monitored and Gold Monitored, defined as follows:
• No Coverage: Satellite is below the horizon and invisible to all stations in the network.
• Observed: The satellite is visible and measurements are being received by at least one station in the network.
• Monitored: The satellite is above a 5° mask angle for at least three stations in the network at which measurements are being received.
• Gold Monitored: The satellite is above a 30° mask angle for over half the network stations (nominally >7).
The gold monitoring cut-off of 30° was chosen as improvements in the CBSM and TDCPM test statistics begin to tail off or even worsen beyond this elevation as shown in Table 2.
Table 2. Elevation statistics.

The motivation of multiple monitoring states (for each satellite) is to facilitate a more informed failure detection and annunciation process whilst reducing the number of false alerts issued to users. This is achieved by deriving thresholds based on different error variance over-bounds for each monitoring status. The tightest of these will be implemented for gold monitoring due to the excellent observability of any gross errors in this state. This relationship is shown in Figure 7. In the optimal case of gold monitored, the detection threshold (between amber and red regions shown in Figure 7) is low as a result of the tight bound on error estimation. An even tighter threshold is used to warn of a potential problem but which could also be due to noise and small biases, including those originating at the station. For monitored satellites these bounds are both relaxed to higher values. An observed satellite is one from which measurements have been received but, due to low station coverage, reliability cannot be assured and as such a warning must be given even for low error detection metrics.

Figure 7. Monitoring Status.
4.2. Fault Detection
4.2.1. Failure Tests
To evaluate the ability of the monitors to detect the relevant failures, a number of tests were performed. Real data were used from the selected OS stations shown in Figure 2 with the addition of simulated failure modes used to reflect those listed in Table 1. Table 3 lists the failure models applied.
Table 3. Applied Failure Models.

In order to capture a large sampling size, 15 days of 1 Hz data (10/2010) were used over the 15 station network. This equates to around 108 measurements. The failure model is applied to a satellite until detection by either algorithm occurs, following which the failure is reset and the detection process recommenced. The tests were performed for each visible satellite sequentially to capture all available modes.
4.2.2. Fault Detection Performance
The CBSM may utilise an empirically derived variance or the value defined by equation (1). In the case of the TDCPM, an empirical value is used, formed from the previous 24 hours data for the entire constellation. The step error tests 1 to 4 in Table 3 produced the intuitive results of a step-like form in the CBSM and a spike in the TDCPM. It is natural that in the online implementation, a moving window of a few samples is employed for the TDCPM to protect against large noise spikes. The CBSM is able by design to efficiently protect against step failures of magnitudes above the user-derived threshold. This has been verified for all tests listed in Table 3 using the selected data set described.
The large ramp errors employed in tests 5 to 6 in Table 3 (10 m/s and 1 m/s) show a clear signature in both the step and ramp detectors, with early detection occurring in both monitors. Results obtained from repeated application of the 0·1 m/s failure in test 7 show clearly the benefit of the TDCPM in terms of early failure detection. The time series of the two detection metrics for one such case are shown in Figure 8. The TDCPM in Figure 8 (right) provides early detection within the moving window time frame (∼5 s), whilst the code based step detector may take up to a minute to reach 6 m.

Figure 8. Ramp error (0·1 m/s): (left) CBSM (right) TDCPM.
At the more sensitive level of a ramp of 0·01 m/s for test 8, the observability of failure in the ramp detector reduces as the signal approaches the nominal noise levels of 0·002–0·005 m/s for the majority of geometrical configurations. During nominal performance, when only very small biases are present in the range rate observables, a marked change in the detection metric is observed as shown in Figure 9. However, when performance is degraded, the detection metric can exceed 0·01 m/s without the addition of the simulated failure. Therefore, these very slowly growing errors would likely only be detected if the user requirements are such that false alerts may be accepted in order to implement tight detection bounds, coupled with a preceding period of good performance leading to a tight estimation of the empirical variance over-bound.
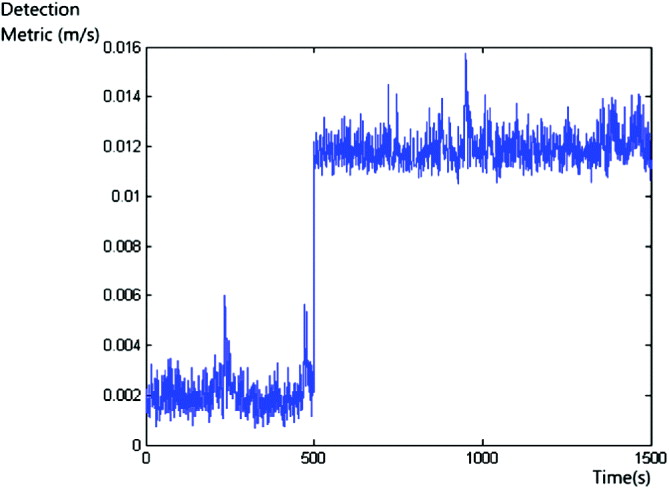
Figure 9. Ramp Error 0·01 m/s.
5. CONCLUSIONS
This paper has presented a regional space segment health monitoring solution to support the GAARDIAN project. The monitors presented in the proposed approach facilitate the identification of space and control segment borne failures to enable alerts to users to be issued and to assist the locally installed GAARDIAN probe network. The SSHM utilises multiple detection functions to maximise the probability of detection and to ensure early detection of all relevant failure modes. A robust approach to the design of a test statistic is taken to minimise the impact of receiver-based errors and immunise against cycle slips. Furthermore, the algorithm feeds into the GAARDIAN's high-level Quality of Service algorithm to generate a health quotient on a per satellite basis. This is a useful service for users that do not possess a RAIM functionality or require customisable monitoring.
The regional monitoring solution as part of GAARDIAN has been demonstrated for a subset of the UK Ordnance Survey network. Results show that ramp errors as low as 0·1 m/s are detected reliably by the system which may feasibly detect more subtle failures dependent upon user requirements.
ACKNOWLEDGEMENTS
The authors would like to thank the Ordnance Survey for the provision of monitoring network data.


