1. INTRODUCTION
In the context of maritime navigation, R-mode refers to the use of existing or new maritime radio communications infrastructure for ranging. The aim is to mitigate the impact of disruptions to Global Navigation Satellite System (GNSS) services on maritime navigation, while minimising the deployment costs.
Ranging systems work by measuring the time of flight or time of arrival of radio signals to estimate the distance between the user and multiple known transponder/transmitter stations. If sufficient stations are available, the user's position can be calculated by multilateration. Measurements from different, complementary, radio navigation systems, including GNSS and terrestrial systems such as R-mode and eLoran, can be combined to form a single resilient position, velocity and time solution, as envisaged in International Maritime Organization (IMO) Resolution MSC.401(95) (IMO, 2015).
Two concepts for R-mode are currently being studied by the international maritime community, based on the medium-frequency signals of the International Association of Marine Aids-to-navigation and Lighthouse Authorities (IALA) Marine Beacon Differential Global Positioning System (DGPS) system, and the use of base station networks of the Automatic Identification System (AIS) and its planned successor, the Very High Frequency (VHF) Data Exchange System (VDES). The focus of this paper is on the VDES variant of R-mode.
An initial feasibility study of AIS R-mode was carried out by the European Union-funded Accessibility for Shipping, Efficiency Advantages and Sustainability (ACCSEAS) project (Johnson et al., Reference Johnson, Swaszek, Alberding, Hoppe and Oltmann2014; Johnson and Swaszek, Reference Johnson and Swaszek2014a; Reference Johnson and Swaszek2014b). ACCSEAS explored four potential approaches to AIS R-mode, based around different ranging waveforms (ranging off standard AIS transmissions; use of additional VHF channels in conjunction with pulsed, continuous wave or ‘two-tone modulation’ ranging signals; adding ranging signals on the AIS channels; and the use of spread-spectrum signals). All options assumed that the R-mode stations would be accurately synchronised to support passive pseudoranging. Theoretical bounds on ranging and positioning precision were derived (ignoring the effects of multipath propagation, propagation biases and synchronisation errors) and a recommendation was made to take the first approach (that is, ranging off standard AIS transmissions) forward for further analysis.
AIS R-mode has also been studied by a group of researchers at the Dalian Maritime University (DMU), China. The DMU researchers augmented the preferred ACCSEAS architecture with a real-time propagation correction subsystem, as described in Hu et al. (Reference Hu, Jiang, Zhang, Sun and Zhang2015). A prototype R-mode system was developed termed ‘AIS Autonomous Positioning System’ (AAPS), and sea trials were conducted in the Xinghai Bay area, Dalian, China. DMU reported that, in areas of good transmitter-receiver geometry (characterised by Geometrical Dilution of Precision (GOP) of less than 1·5), Two-Dimensional Root Mean Square (2DRMS) positioning accuracy of 100 m was achieved without using propagation corrections and 10 m with corrections applied. The DMU papers (Zheng et al., Reference Zheng, Hu and Zhang2016; Wang et al., Reference Wang, Zhang and Sun2017) provide additional detail on the signal processing algorithms used in the AAPS.
An alternative ranging algorithm for AIS R-mode was presented in Zhang et al. (Reference Zhang, Zhang and Wang2017). A prototype ranging system was developed and field trials were conducted in the same area as had been used in the AAPS trials. Tests were carried out over ranges of approximately 7 km to 9 km. It was reported that the ranging precision for the 9 km baseline was 61 m (one sigma) when using one-slot AIS messages and 28 m (one sigma) with five-slot messages. It is not clear from the paper whether any propagation corrections were applied.
R-mode Baltic is an ongoing European Union-funded project, which builds on the results of the ACCSEAS study and aims to set up an R-mode testbed in the Baltic Sea by 2020. The project considers both Marine Beacon DGPS and AIS R-mode, with a view to investigating the possibility of using VDES. An overview of the project, its objectives and initial findings can be found in Gewies et al. (Reference Gewies, Dammann, Ziebold, Backstedt, Bronk, Wereszko, Rieck, Gustafson, Eliassen, Hoppe and Tycholiz2018).
This paper contributes to the emerging body of work on R-mode by extending the theoretical analysis of ranging precision carried out by ACCSEAS to VDES R-mode.
2. VDES R-MODE WAVEFORM DESIGN
This section summarises assumptions regarding the VDES R-mode signal structure. The assumptions made here are largely based on the recommendations of the ACCSEAS AIS R-mode study (Johnson and Swaszek, Reference Johnson and Swaszek2014a) and the most recent version (as of April 2018) of the VDES Technical Specification (IALA, 2018). The waveform design for VDES R-mode is an active area of research and other proposals may emerge in the future as the concept continues to develop.
2.1. VDES components and subsystems
VDES has terrestrial and satellite components. This work is concerned only with the former; the satellite component, in its current form, is not considered suitable for R-mode, not least because this would require the position of the VDES satellites to be accurately measured and known to the users at all times.
The terrestrial component consists of four subsystems dedicated to different functions and using different radio waveforms over different frequency channels:
(1) The Automatic Identification System (AIS) uses two 25 kHz simplex channels in the upper part of the maritime mobile VHF band for ship position reporting and other safety-related applications; it has the highest priority within the system and all other subsystems are organised such that the AIS is not adversely affected;
(2) Long Range AIS (AIS-LR) uses an additional two 25 kHz simplex channels in the lower part of the maritime VHF band to enhance the long-range detection of vessel position reports by high-sensitivity shore-based AIS stations (and by satellite); since AIS-LR uses the same waveforms as ordinary AIS, no distinction will be made in this paper between the two;
(3) Two 25 kHz simplex channels are dedicated for existing and new IALA and IMO-defined Application Specific Messages (ASMs); the ASM subsystem gives a high reliability of message delivery and message acknowledgement support;
(4) The Terrestrial VHF Data Exchange (VDE-TER) subsystem comprises a 100 kHz bandwidth duplex channel which is available for data exchange that requires higher capacity than the ASM; the VDE-TER channel can be split into two 50 kHz channels, or four 25 kHz channels; the corresponding three possible configurations of the VDE-TER waveform will be referred to here as VDE-TER 100K, VDE-TER 50K, and VDE-TER 25K, respectively.
2.2. VDES Modulations
The AIS and VDES technical specifications (ITU, 2014; IALA, 2018) refer to four types of modulation, as shown in Table 1. The following sections provide a mathematical description of the modulated signal for each of the modulations shown here.
Table 1. VDES modulations.

2.2.1. GMSK
The GMSK modulation used in AIS belongs to the family of Continuous Phase Modulations (CPM). A CPM-modulated signal can be written as followsFootnote 1 (Sykora, Reference Sykora2003):
 $$s(t)=\sqrt{\displaystyle{2E_{{\rm S}} \over T_{{\rm S}}}} e^{\,{\rm j}\phi (t,{{\bf d}})}$$
where d = {d n}n∈ℤ is a vector of data symbols from the alphabet { ± 1, ± 3, …, ± (M − 1)}, E S is the average energy per symbol of the real modulated signal, T S is the symbol period, ![]() ${\rm j}=\sqrt{-1}$ is the imaginary unit, and ϕ(t, d) is the instantaneous phase:
${\rm j}=\sqrt{-1}$ is the imaginary unit, and ϕ(t, d) is the instantaneous phase:
The parameter κ in Equation (2) is commonly referred to as the modulation index. β (t) is the phase response of the modulator, which is related to its frequency response, μ (t), by:
For GMSK, M=2, κ=1/2 and the frequency response is obtained as a convolution of a rectangular pulse and a Gaussian-shaped pulse (hence the name of the modulation); the frequency response is given by the following expression (Mengali and D'Andrea, Reference Mengali and D'Andrea1997):
 $$\mu (t)=\displaystyle{Q\left( \displaystyle{{2}\pi B}{\sqrt{\ln 2}}\lpar t-\displaystyle{L+1}{2}T_{{\rm S}} \rpar \right)-Q\left(\displaystyle{2\pi B}{\sqrt{\ln 2}} \lpar t-\displaystyle{L-1}{2}T_{{\rm S}} \rpar \right) \over 2T_{{\rm S}}}$$
where B (bandwidth parameter) and L (correlation length) are system design parameters and Q(x) is the complementary cumulative distribution function of the standard Gaussian distribution:
The AIS specification (ITU, 2014) requires that BT S = 0 · 4; however, it does not appear to state any requirements on the correlation length, L. Johnson and Swaszek (Reference Johnson and Swaszek2014a) state that, for GMSK, typically L=4 or 5; therefore L=4 is assumed in this document.
2.2.2. PSK/QAM
The Pi/4-QPSK, 8-PSK and 16-QAM modulations used in VDES all belong to the class of linear modulations; therefore, the modulated signal has the form:
where q n are complex-valued channel symbols and h(t) is a suitable modulation pulse, as discussed further below.
In the case of the Pi/4-QPSK modulation, the channel symbols can be determined from the data symbols, d n, and internal states of the modulator, σn, as follows (IALA, 2018):
 $$\eqalign{q_{n} &= d_{n}e^{\,{\rm j} \displaystyle{\pi \over 4} \sigma_{n}} \cr \sigma_{n} &= \left\{\matrix{1, \hfill & n=0 \hfill\cr (\sigma_{n-1}+1)\hbox{mod } 2, \hfill & n \gt 0 \hfill}\right.}$$
where ![]() $a\ \hbox{mod}\ b$ denotes the remainder of a after division by b. The data symbols are taken from the alphabet:
$a\ \hbox{mod}\ b$ denotes the remainder of a after division by b. The data symbols are taken from the alphabet:
 $$d_{n}\in \left\{e^{\,{\rm j}\displaystyle{\pi \over 2}i}\right\}_{i=0}^{3}$$
and consequently, the channel symbol alphabet (also referred to here as the constellation) has the following eight members:
 $$q_{n}\in \left\{ e^{\,{\rm j}\displaystyle{\pi \over 4}i}\right\}_{i=0}^{7}$$
In other words, the channel symbols are alternately drawn from two QPSK constellations, rotated with respect to each other by π/4 rad (which gives the modulation its name). This arrangement reduces the peak-to-average power ratio of the modulated signal by ensuring that its envelope never collapses to zero. A low peak-to-average power ratio is desirable as it allows the use of more efficient transmitter power amplifiers (Raab et al., Reference Raab, Asbeck, Cripps, Kenington, Popovic, Pothecary, Sevic and Sokal2002).
For 8-PSK, the channel symbols are equal to the data symbols and are given by:
 $$\eqalign{& d_{n}\in \left\{ e^{\,{\rm j}\displaystyle{\pi \over 4} i}\right\}_{i=0}^{7}\cr & q_{n}=d_{n},}$$
For 16-QAM, the symbols are given by:
 $$\eqalign{& d_{n}\in \{ ( 2i_{1}-5)+{\rm j}(2i_{2}-5)\}_{i_{1}=1,i_{2}=1}^{4,4}\cr & q_{n}=d_{n}}$$
Arguably the most common modulation pulse, h(t), used in digital communication systems is the Root-Raised Cosine (RRC) pulse, which is defined in the frequency domain as followsFootnote 2:
 $$H(f) = {\cal F}\{ h(t)\} = \left\{\matrix{\sqrt{T_{\rm S}}, \hfill & \vert\,f \vert \lt \displaystyle{1-\alpha \over 2T_{{\rm S}}} \hfill \cr \sqrt{T_{\rm S}} \cos \left( \displaystyle{\pi T_{{\rm S}} \over 2\alpha} \left( \vert\,f \vert -\displaystyle{1-\alpha \over 2T_{{\rm S}}} \right)\right), \hfill & \displaystyle{1-\alpha \over 2T_{{\rm S}}}\le \vert\,f\vert \lt \displaystyle{1+\alpha \over 2T_{{\rm S}}} \hfill \cr 0,\hfill & \displaystyle{1+\alpha \over 2T_{{\rm S}}}\le \vert\,f\vert \hfill}\right.$$
The coefficient α, 0<α<1, is referred to as the “roll-off factor” and is a measure of the excess bandwidth, that is, the bandwidth occupied by the modulated signal beyond the Nyquist bandwidth of 1/(2T S). The VDES specification (IALA, 2018) does not explicitly specify the type of the modulation pulse; however, it does specify the roll-off factors for the different modulations, implying the RRC pulse should be used. The values of α stated in the specification (and used in this document) are summarised in Table 2.
Table 2. RRC roll-off factor values used in VDES.

As will become clear later, the two variants of PSK and the QAM modulation are equivalent as far as the ranging performance is concerned; therefore these modulations will be treated in the following sections as one case (referred to as ‘PSK/QAM’).
2.3. Symbol rate
The symbol rate, R S, is related to the symbol interval by: R S = 1/T S. As will be seen later, the symbol rate is one of the key factors determining the achievable ranging performance, with higher symbol rates promising improved ranging precision. The values of R S used in VDES are summarised in Table 3.
Table 3. Symbol rates for different VDES waveform configurations.

2.4. Transmission duration and number of symbols used for range estimation
The number of VDES symbols used in the range estimation process is another important parameter that affects the achievable ranging performance. The VDES uses the same Time-Division Multiple Access (TDMA) frame structure as the AIS, with 2,250 time slots per minute; however, the VDES specification sets different limits to the maximum duration of transmissions for different VDES subsystems. In addition, a certain number of symbols in a transmission are reserved for the transmitter ramp-up/down and as a guard interval to account for propagation delays; therefore these symbols cannot be used for ranging.
Table 4 shows two potential VDES R-mode transmission configurations that will be considered in this paper:
1. One-slot Bursts – range estimates are made based on R-mode transmissions occupying one VDES time-slot;
2. Maximum-length Bursts – R-mode uses the maximum transmission duration allowed by the VDES specification (IALA, 2018); note from Table 4 that different VDES subsystems have different maximum transmission durations.
Table 4. Potential VDES R-mode transmission configurations.

For each configuration, Table 4 shows the number of time slots occupied by an R-mode transmission and the corresponding number of symbols that are potentially available for range estimation.
2.5. Data Sequence
There appear to be two options with regards to the data sequence transmitted by VDES R-mode stations:
(1) R-mode base-stations transmit an agreed, fixed sequence of symbols. The advantage of this approach, apart from implementation simplicity, is that the sequence could be optimised to provide the best ranging coverage and performance. A disadvantage is that dedicated time slots would have to be reserved for R-mode transmissions, adding to the VDES data link loading.
(2) Another option is that R-mode will use ordinary user data transmissions for ranging. The obvious advantage of this approach is that R-mode would not add to the VDES data link loading. The disadvantages are that the data sequence could not be optimised, the receiver implementation would be more complex than if a fixed sequence was used and the user would need to be located within the data coverage area of the R-mode base station (as the receiver would need to be able to demodulate the user data to enable accurate ranging).
For the purpose of the analysis in this document, it will be assumed that option (2) is used. No effort will be made here to establish the optimal data sequence that would provide the highest ranging precision if option (1) was used.
Further, it will be assumed that the data symbols can be modelled as zero-mean, mutually uncorrelated random variables (this is a standard assumption made in digital communications and should be satisfied in any well-designed digital communications system)Footnote 3:
 $$\eqalign{&{\rm E}\lcub d_{n} \rcub =0,\cr &{\rm E}\lcub d_{n}d_{m}^{{\ast}} \rcub = \left\{\matrix{{\rm E}\lcub \vert d_{n} \vert^{2} \rcub \equiv D, \hfill & n=m \hfill \cr 0, \hfill & n\neq m. \hfill}\right.}$$
It is easy to show that under these assumptions the channel symbols for the linear modulations defined in Section 2.2.2 also are zero-mean and mutually uncorrelated.
3. VDES PROPAGATION CHANNEL MODEL
This paper establishes bounds on the VDES ranging performance in an Additive White Gaussian Noise (AWGN) channel; accordingly, the received signal is modelled as:
where s(t) is the modulated baseband signal as defined in the preceding section, τ is an unknown propagation delay (the quantity of interest for ranging) and w(t) is a complex white Gaussian noise process with a power spectral density of 2N 0 (representing real white Gaussian noise with a two-sided power spectral density of N 0/2).
Note that in practice, the received signal will also have an unknown carrier frequency and phase offset (due to a mismatch between the transmitter and receiver oscillators and receiver motion). It can be shown that these offsets have no impact on the performance bounds derived in this document and are therefore omitted for clarity; however, they will have some impact on the service provided.
Real-world VDES R-mode performance will also likely be affected by multipath propagation. The achievable ranging performance in a maritime multipath fading channel will be investigated in a future paper. Additional signal propagation delay may occur due to tropospheric effects and terrain elevation. Quantifying these effects would require conducting a measurement campaign in representative maritime environments.
4. BOUNDS ON RANGING PERFORMANCE
The ranging precision is directly related to the precision of estimating the signal propagation delay, τ. Estimation theory offers several methods of establishing bounds to the achievable precision of signal parameter estimators. Perhaps the most widely used of these methods is the Cramér-Rao Bound (CRB) which provides a lower bound to the variance of any unbiasedFootnote 4 estimator (Kay, Reference Kay1993). The CRB can easily be applied to the problem of estimating the delay of a deterministic signal waveform in AWGN. However, its application to practical estimation problems is often complicated by the presence of random nuisance parametersFootnote 5, such as the data symbols in a modulated signal.
A simplified version of the CRB, referred to as the Modified Cramér-Rao Bound (MCRB), was introduced in D'Andrea et al. (Reference D'Andrea, Mengali and Reggiannini1994). The MCRB provides a lower bound to the CRB and can be readily evaluated even in the presence of random nuisance parameters. It can be shown that the MCRB coincides with the CRB when the nuisance parameters are perfectly known (this case corresponds to using a fixed data sequence in the R-mode transmissions). The MCRB was previously used in Johnson and Swaszek (Reference Johnson and Swaszek2014a) to evaluate the ranging performance of AIS R-mode and will therefore serve as the starting point for the current analysis. For a more detailed discussion of the theory of the MCRB and its relationship to the CRB, the reader is referred to D'Andrea et al. (Reference D'Andrea, Mengali and Reggiannini1994) and Mengali and D'Andrea (Reference Mengali and D'Andrea1997).
4.1. Modified Cramér-Rao Bounds for AIS/VDES R-mode
The MCRB for signal delay estimation in AWGN has the form (Mengali and D'Andrea, Reference Mengali and D'Andrea1997):
 $$var\lcub \hat{\tau } \rcub =\displaystyle{N_{0} \over {\rm E}_{{{\bf d}}}\left\{ \int_{0}^{T_{{\rm o}}} {\left\vert \displaystyle{\partial s\lpar t,\tau,{{\bf d}}\rpar \over \partial \tau } \right\vert^{2}dt} \right\}}$$
where τ̂ is the estimate of the true signal delay τ, T o is the observation interval over which the estimation is performed, and E d{.} denotes statistical expectation with respect to the data symbols, d. The bound will now be evaluated first for the AIS and then the VDES waveforms.
4.1.1. GMSK (AIS)
For a GMSK signal (see Section 2.2.1), the denominator in Equation (15) can be written as:
 $$\eqalign{&{\rm E}_{{{\bf d}}}\left\{\int_{0}^{T_{{\rm o}}} {\left\vert \displaystyle{\partial \over \partial \tau }\sqrt{\displaystyle{2E_{{\rm S}} \over T_{{\rm S}}}} e^{\,{\rm j}\phi \lpar t-\tau, {{\bf d}} \rpar } \right\vert^{2}dt}\right\}\cr &\quad ={\rm E}_{{{\bf d}}}\left\{ \int_{0}^{T_{{\rm o}}} {\left\vert \displaystyle{\partial \over \partial \tau }\sqrt{\displaystyle{2E_{{\rm S}} \over T_{{\rm S}}}} e^{\,{\rm j}\pi \sum_n {d_{n}\beta \lpar t-\tau -nT_{{\rm S}} \rpar } } \right\vert^{2}dt} \right\} \cr &\quad =\displaystyle{2E_{{\rm S}} \over T_{{\rm S}}}E_{{{\bf d}}}\left\{ \int_{0}^{T_{{\rm o}}} {\left\vert e^{{\rm j}\pi \sum_n {d_{n}\beta \lpar t-\tau -nT_{{\rm S}} \rpar } }{\cdot {\rm j}}\pi \sum_n {d_{n}\mu \lpar t-\tau -nT_{{\rm S}} \rpar } \right\vert^{2}dt} \right\}\cr &\quad =\displaystyle{2{\pi^{2}E}_{{\rm S}} \over T_{{\rm S}}}\int_{0}^{T_{{\rm o}}} {E_{{{\bf d}}}\left\{ \left\vert \sum_n {d_{n}\mu \lpar t-\tau -nT_{{\rm S}} \rpar } \right\vert^{2} \right\}dt,}}$$
where ![]() $\mu (t)=\displaystyle{\partial \beta \over \partial t}$ is the GMSK frequency response, as defined in Section 2.2.1.
$\mu (t)=\displaystyle{\partial \beta \over \partial t}$ is the GMSK frequency response, as defined in Section 2.2.1.
Using the assumption of uncorrelated data symbols (see Section 2.5), the linearity of the expectation operator and the fact that, for GMSK, E{|d n|2} = 1, the expression above can be simplified to:
 $$\displaystyle{2{\pi^{2}E}_{{\rm S}} \over T_{{\rm S}}}\int_{0}^{T_{{\rm o}}} \,\sum_n {\mu^{2}\lpar t-\tau -nT_{{\rm S}} \rpar } dt.$$
Further, by using the Poisson summation formula (Pinsky, Reference Pinsky2008) and assuming that the observation interval, T o, is an integer multiple of the symbol interval, T o = L oT S, L o ∈ ℕ, the expression can be rewritten as:
 $$\displaystyle{2{\pi^{2}E}_{{\rm S}}L_{{\rm o}} \over T_{{\rm S}}}\mathop{\underbrace{\int_{-\infty}^{\infty}\mu^2(t)\,dt.}}\limits_{\xi}$$
By substituting into Equation (15), the MCRB can now be expressed as:
 $$var \lcub \hat{\tau } \rcub = \displaystyle{T_{{\rm S}} \over 2\pi^{2}{\xi L}_{{\rm o}}\displaystyle{E_{S} \over N_{{0}}}}$$
Note that this result is a factor of two smaller than the expression presented in the ACCSEAS AIS R-mode study (Johnson and Swaszek, Reference Johnson and Swaszek2014a). The reason appears to be that the ACCSEAS study modelled the modulated signal as a real signal (centred on a Radio Frequency (RF) carrier), instead of using the complex envelope representation assumed by the MCRB expression given by Equation (15).
The variance of the pseudorangeFootnote 6 estimation error is given by:
 $$var\lcub \hat{\rho } \rcub =c^{2}\cdot var\lcub \hat{\tau } \rcub =\displaystyle{c^{2}T_{{\rm S}} \over 2\pi^{2}{\xi L}_{{\rm o}}\displaystyle{E_{S} \over N_{{0}}}}$$
where c is the signal propagation speed (assumed to be equal to the speed of light in free space in this paper). Denoting:
the expression above can be rewritten as:
 $$var \lcub \hat{\rho } \rcub =\displaystyle{\eta_{{\rm GMSK}} \over L_{{\rm o}}\displaystyle{E_{{\rm S}} \over N_{{0}}}}$$
The standard deviation of the pseudorange estimation error is then given by:
 $$\sigma_{\hat{\rho},{\rm GMSK}}=\sqrt{var\lcub \hat{\rho}\rcub } =\sqrt{\displaystyle{\eta_{{\rm GMSK}} \over L_{{\rm o}}\displaystyle{E_{{\rm S}} \over N_{{0}}}}}$$
Alternatively, the bound can be expressed in terms of the Carrier-power-to-Noise-density ratio, C/N 0, using the identity E S = CT S, where C is the carrier power (equal to the average power of the real modulated signal):
 $$\sigma_{\hat{\rho },{\rm GMSK}}=\sqrt{\displaystyle{\eta'_{{\rm GMSK}} \over L_{{\rm o}}\displaystyle{C \over N_{{0}}}}}$$
For the AIS waveform as defined in Section 2.2.1, ηGMSK is equal to 3 · 13 · 108 m2 and η′GMSK = 3 · 00 · 1012 m2/s. Suitable values for L o were provided in Table 4, Section 2.4.
As may be intuitively expected, the ranging error decreases with increasing number of data symbols used in the R-mode transmission and increasing Signal-to-Noise Ratio (SNR).
4.1.2. PSK/QAM (VDES)
For a PSK or QAM signal (as defined in Section 2.2.2), the denominator in Equation (15) can be written as:
 $${\rm E}_{{{\bf d}}}\left\{ \int_{0}^{T_{{\rm o}}} {\left\vert \displaystyle{\partial \over \partial \tau }\sum\limits_n q_{n} h\lpar t-\tau -nT_{{\rm S}} \rpar \right\vert^{2}dt} \right\}=\int_{0}^{T_{{\rm o}}} {{\rm E}_{{{\bf d}}}\left\{ \left\vert \sum\limits_n q_{n} p\lpar t-\tau -nT_{{\rm S}} \rpar \right\vert^{2} \right\}dt}$$
where ![]() $p(t)\equiv \displaystyle{dh(t) \over dt}$.
$p(t)\equiv \displaystyle{dh(t) \over dt}$.
Using the assumption of uncorrelated data/channel symbols (see Section 2.5) and the linearity of the expectation operator, the expression above can be simplified to:
 $$\int_{0}^{T_{{\rm o}}} D\sum_n {p^{2}\lpar t-\tau -nT_{{\rm S}} \rpar } dt,$$
where D ≡ E{|d n|2}.
By using the Poisson summation formula (Pinsky, Reference Pinsky2008) and assuming that the observation interval, T o, is an integer multiple of the symbol interval, T o = L oT S, L o ∈ ℕ, the expression can be simplified to:
where ![]() $P_{2}(f)\equiv {\cal F}\{ p^{2}(t)\}$. Using the following identities:
$P_{2}(f)\equiv {\cal F}\{ p^{2}(t)\}$. Using the following identities:
in which ![]() $P\lpar \,f \rpar \equiv {\cal F}\lcub p(t) \rcub $ and
$P\lpar \,f \rpar \equiv {\cal F}\lcub p(t) \rcub $ and ![]() $H\lpar \,f \rpar \equiv {\cal F}\lcub h(t) \rcub $, and considering that h(t) ∈ ℝ and therefore H( − f) = H*( f), the Fourier transform P 2(0) can be expressed as:
$H\lpar \,f \rpar \equiv {\cal F}\lcub h(t) \rcub $, and considering that h(t) ∈ ℝ and therefore H( − f) = H*( f), the Fourier transform P 2(0) can be expressed as:
 $$P_{2}\lpar {0} \rpar = {\cal F}\lcub p^{2}(t) \rcub \vert _{f=0}=\int_{{-\infty }}^{\infty } \left( \displaystyle{dh(t) \over dt}\right)^{2}dt=4\pi^{2}\int_{-\infty}^{\infty } {f^{2}\vert H\lpar \,f \rpar \vert ^{2}df}$$
Substituting for P 2(0) in the expression for the denominator gives:
For further analysis, it is desirable to express the MCRB in terms of the SNR. It can be shown that the average energy per symbol of the linear modulations defined in Section 2.2.2, under the assumptions made in Section 2.5, is given by (Mengali and D'Andrea, Reference Mengali and D'Andrea1997):
The expression for the denominator can therefore be rewritten as follows:
 $${8}\pi^{2}L_{{\rm o}}E_{{\rm S}}\displaystyle{\int_{{-\infty }}^{\infty } {f^{2}\vert H\lpar \,f \rpar \vert ^{2}df} \over \int_{{-\infty }}^{\infty } {\vert H\lpar \,f \rpar \vert ^{2}df} }=\displaystyle{{8}\pi^{2}L_{{\rm o}}E_{{\rm S}}\zeta \over T_{{\rm S}}^{2}}$$
where:
 $$\zeta \equiv T_{{\rm S}}^{2}\displaystyle{\int_{{-\infty }}^{\infty } {f^{2}\vert H(\, f ) \vert^{2}df} \over \int_{{-\infty }}^{\infty } {\vert H\lpar \,f \rpar \vert ^{2}df} }$$
is a dimensionless factor related to the shape of the modulation pulse. For an RRC modulation pulse with a roll-off factor α (see Section 2.2.2), ζ can be shown to be equal to (Mengali and D'Andrea, Reference Mengali and D'Andrea1997):
By substituting into Equation (15), the MCRB can then be expressed as:
 $$var\lcub \hat{\tau } \rcub =\displaystyle{T_{{\rm S}}^{2} \over {8}\pi^{2}{\zeta L}_{{\rm o}}\displaystyle{E_{{\rm S}} \over N_{{0}}}}$$
 Denoting ![]() $\eta_{\rm PSK-QAM}\equiv \displaystyle{c^{2}T_{{\rm S}}^{2} \over 8\pi ^{2}\zeta }$, the variance of the pseudorange estimation error can be written as:
$\eta_{\rm PSK-QAM}\equiv \displaystyle{c^{2}T_{{\rm S}}^{2} \over 8\pi ^{2}\zeta }$, the variance of the pseudorange estimation error can be written as:
 $$var \{\hat{\rho}\} =c^{2} {\cdot} var \{\hat{\tau} \} = \displaystyle{c^{2}T_{\rm S}^{2} \over 8\pi^{2} {\zeta L}_{\rm o}\displaystyle{E_{\rm S} \over N_0}} = \displaystyle{\eta_{\rm PSK-QAM} \over L_{\rm o} \displaystyle{E_{\rm S} \over N_0}}$$
Finally, the standard deviation of the pseudorange estimation error is given by:
 $$\sigma_{\hat{\rho},{\rm PSK-QAM}} = \sqrt{var\{ \hat{\rho}\}} = \sqrt{\displaystyle{\eta_{\rm PSK-QAM} \over L_{\rm o} \displaystyle{E_{\rm S} \over N_0}}} = \sqrt{\displaystyle{\eta_{\rm PSK-QAM}^{\prime} \over L_{\rm o} \displaystyle{C \over N_0}}}$$
 The values of ![]() $\eta_{\rm PSK-QAM}$ and
$\eta_{\rm PSK-QAM}$ and ![]() $\eta'_{\rm PSK-QAM}$ for the different modulations and symbol rates used in VDES are provided in Table 5. Suitable values for L o were provided in Table 4, Section 2.4.
$\eta'_{\rm PSK-QAM}$ for the different modulations and symbol rates used in VDES are provided in Table 5. Suitable values for L o were provided in Table 4, Section 2.4.
Table 5. Ranging error coefficients for different VDES waveform configurations.

Note from Section 2.2.2 that the PSK and 16-QAM modulations are defined by practically identical mathematical expressions, differing only in the data/channel symbol alphabets. Although the two modulation types have a different mean square value of the data symbols, E{|d n|2} = D, this term does not appear in the MCRB expressions derived above; therefore, all other waveform and channel parameters being equal, the PSK and 16-QAM modulations are expected to provide equivalent levels of ranging performance.
4.2. GMSK (AIS) versus PSK/QAM (VDES) performance comparison
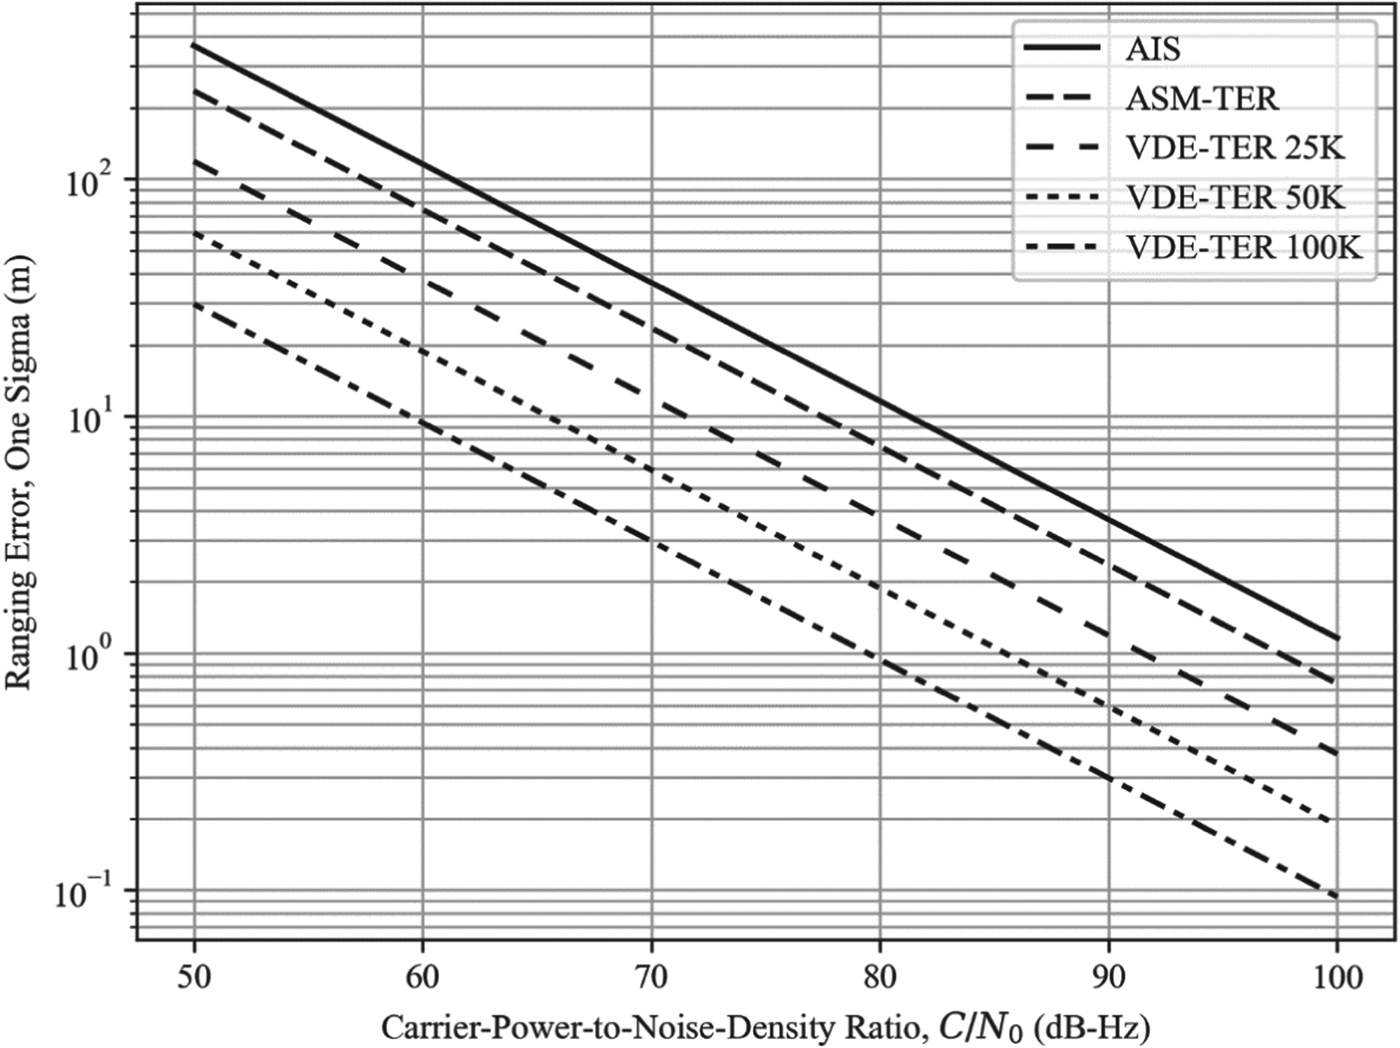
By comparing the values of η′PSK-QAM in Table 5 with the value of η′GMSK determined in Section 4.1.1, it can be seen that all of the new VDES waveforms can be expected to provide better ranging performance in AWGN than the AIS waveform. It can also be seen from the table that the ranging performance improves with increasing waveform bandwidth. The best performance is achieved using the 100 kHz bandwidth VDE-TER waveforms which provide approximately twelve times better ranging precision than the AIS (assuming the same observation interval length, L oT S, is used).
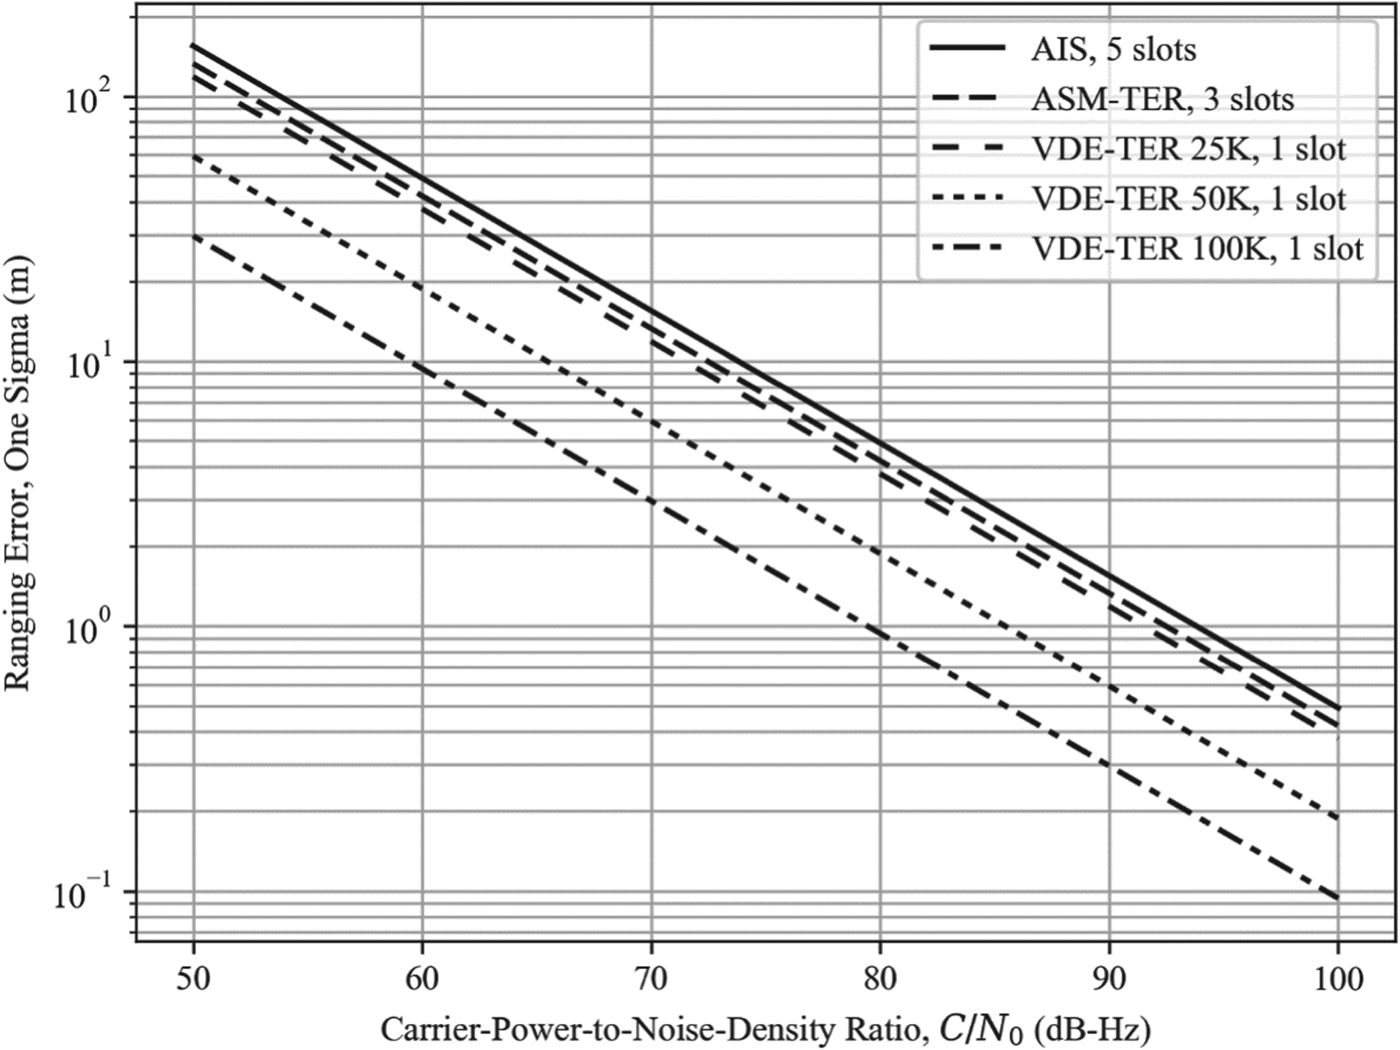
As may be expected, the ranging performance also improves with increasing SNR, as illustrated in Figure 1 for one-slot transmissions and in Figure 2 for maximum-length transmissions.
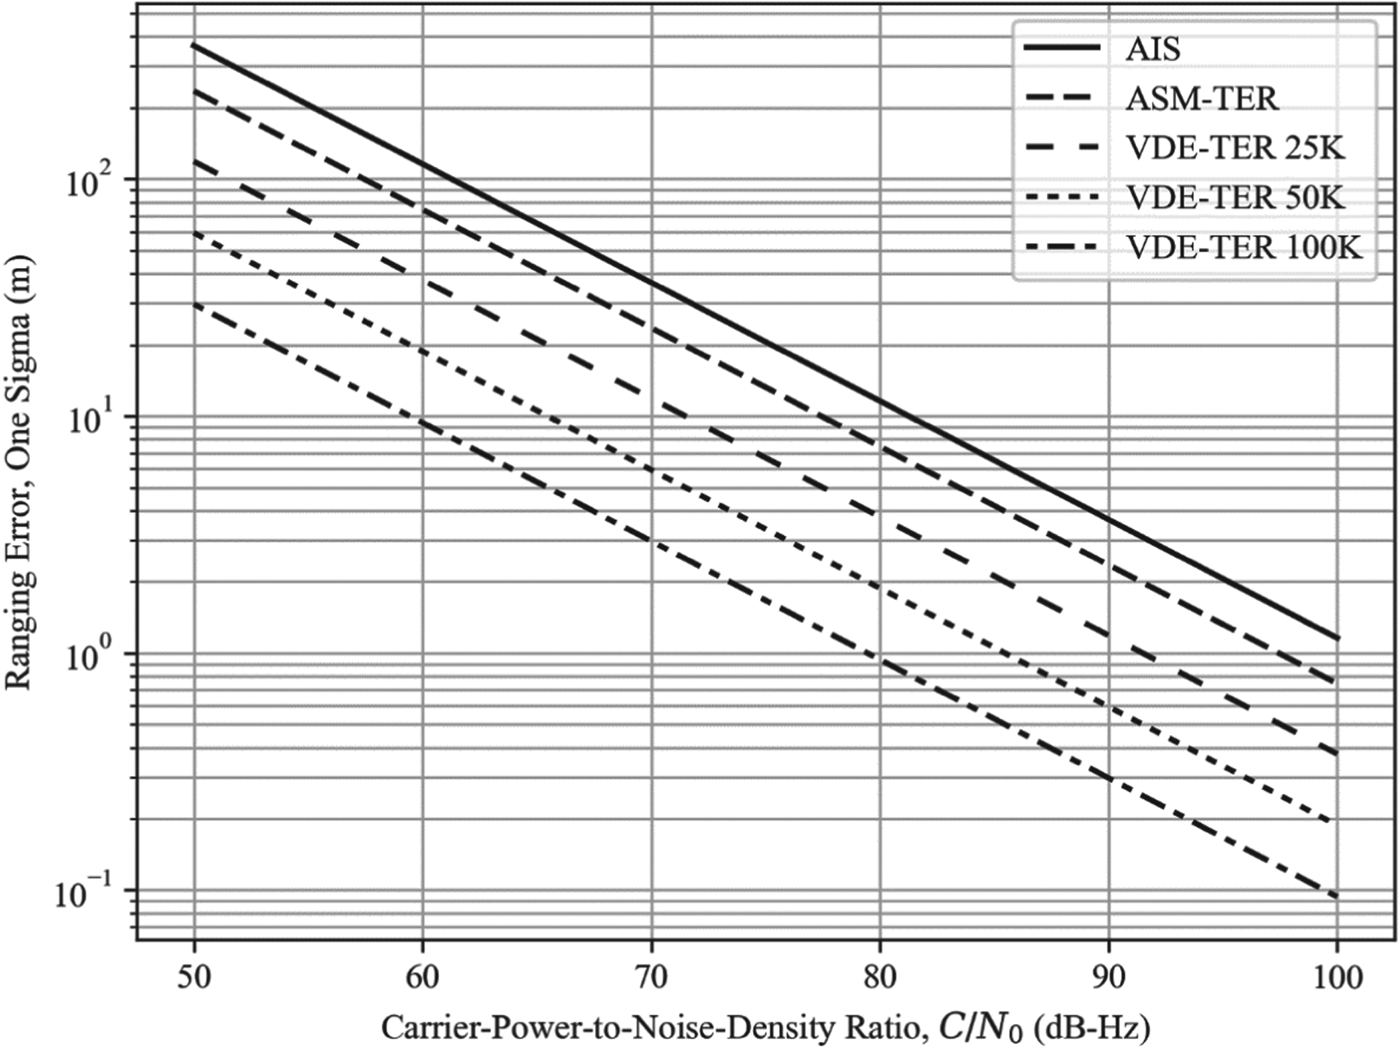
Figure 1. AIS/VDES ranging error vs. carrier-power-to-noise-density ratio assuming one-slot transmissions.
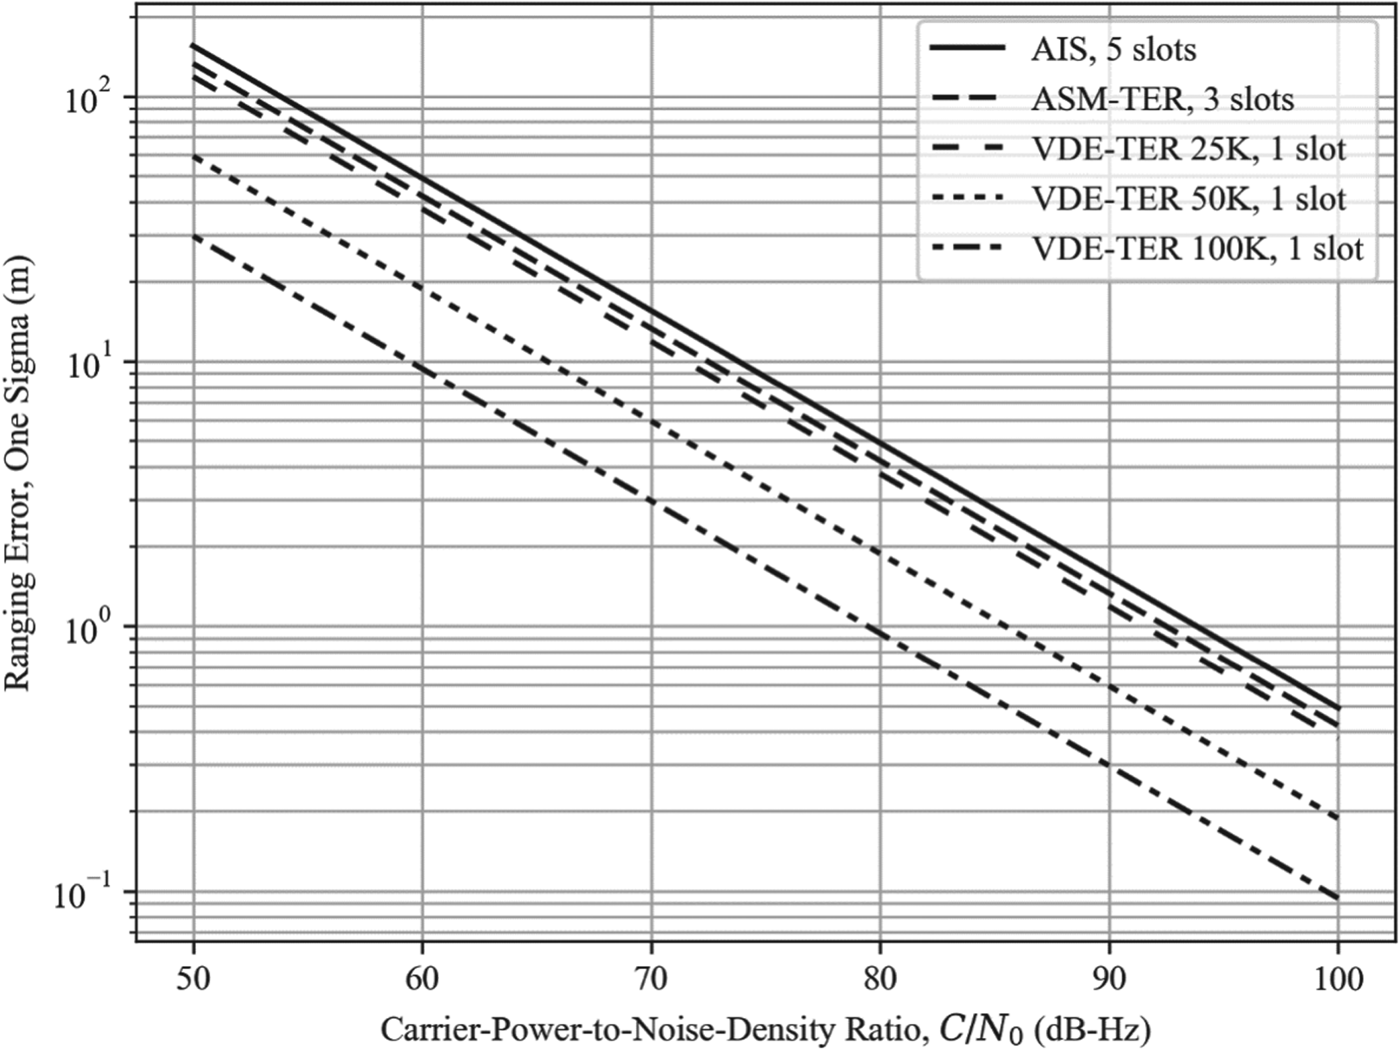
Figure 2. AIS/VDES ranging error vs. carrier-power-to-noise-density ratio assuming maximum-length transmissions.
4.3. Receiver integration
A further improvement in performance could be obtained by combining several successive R-mode transmissions at the receiver end. Different combination methods may be considered, such as coherent integration of the received transmissions, or some form of filtering of the range measurements. Coherent integration is expected to provide the highest processing gain but would either require the transmitter to maintain carrier phase coherence between the successive R-mode transmissions that are integrated over, or the receiver would have to estimate and compensate for the carrier phase offset on a per transmission basis.
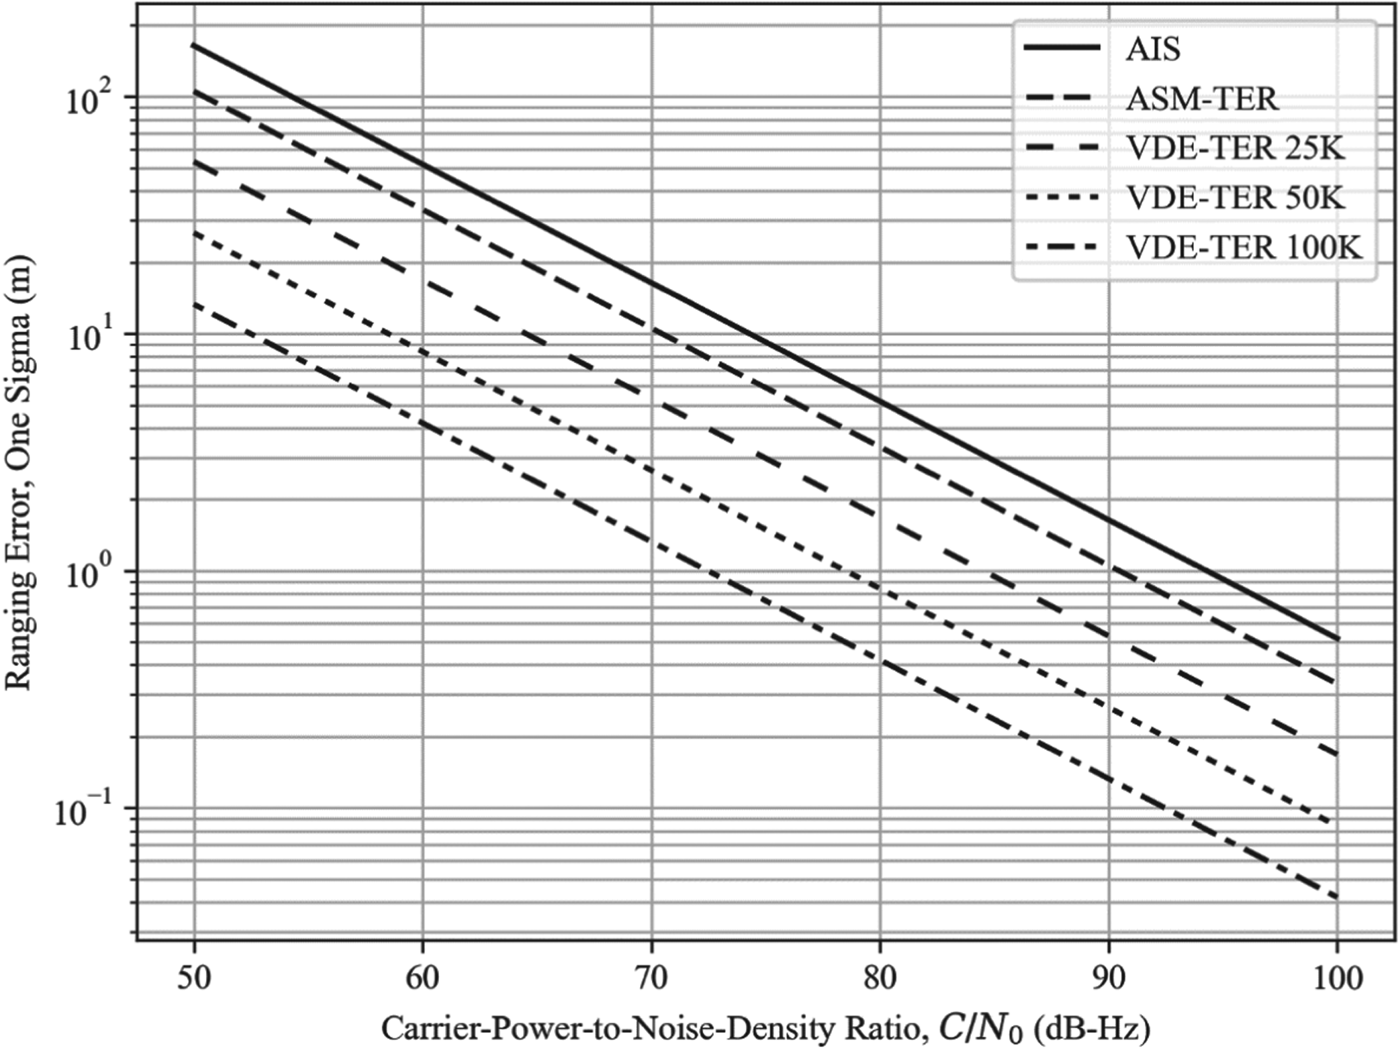
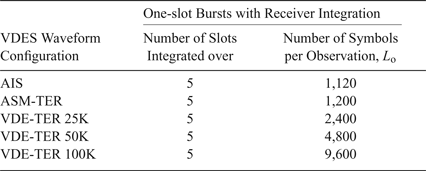
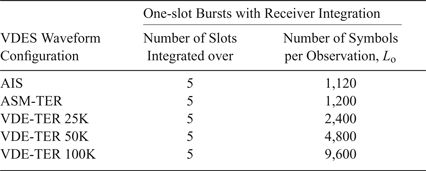
For illustration, Figure 3 shows the achievable ranging performance when five successive one-slot R-mode transmissions are coherently combined in the receiver (see also Table 6); as expected based on the MCRBs derived earlier, increasing the number of symbols per observation by a factor of five results in the ranging error being reduced by a factor of ![]() $\sqrt{5} \approx 2{\cdot}2$.
$\sqrt{5} \approx 2{\cdot}2$.
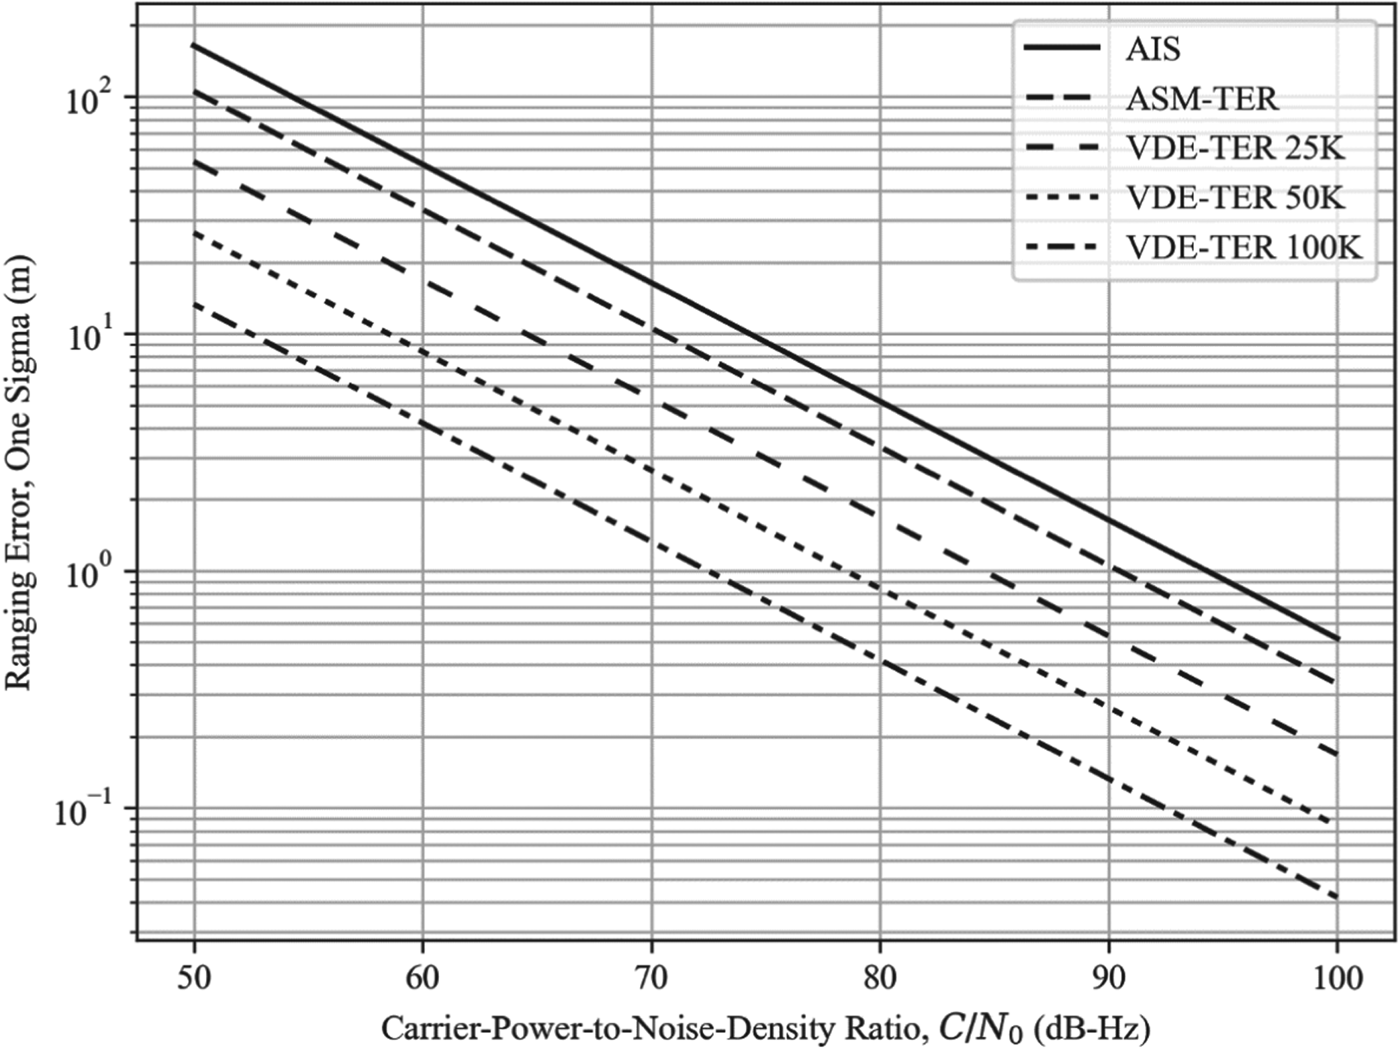
Figure 3. AIS/VDES ranging error vs. carrier-power-to-noise-density ratio assuming one-slot transmissions and receiver integration over five slots.
Table 6. Number of symbols per observation for the one-slot burst transmission configuration with receiver integration.
4.4. Ranging performance versus distance
Translating the performance bounds derived in the preceding section to a measurement error expected at a given distance from the R-mode base station requires a model for the received signal power versus distance and estimates of the radio noise levels likely to be present on maritime vessels. These aspects are addressed in the following two sub-sections.
4.4.1. Received power versus distance
The average received signal power at a given distance from the base station, equivalent to the carrier power C in the preceding section, can be modelled as follows (all quantities are expressed using a logarithmic scale):
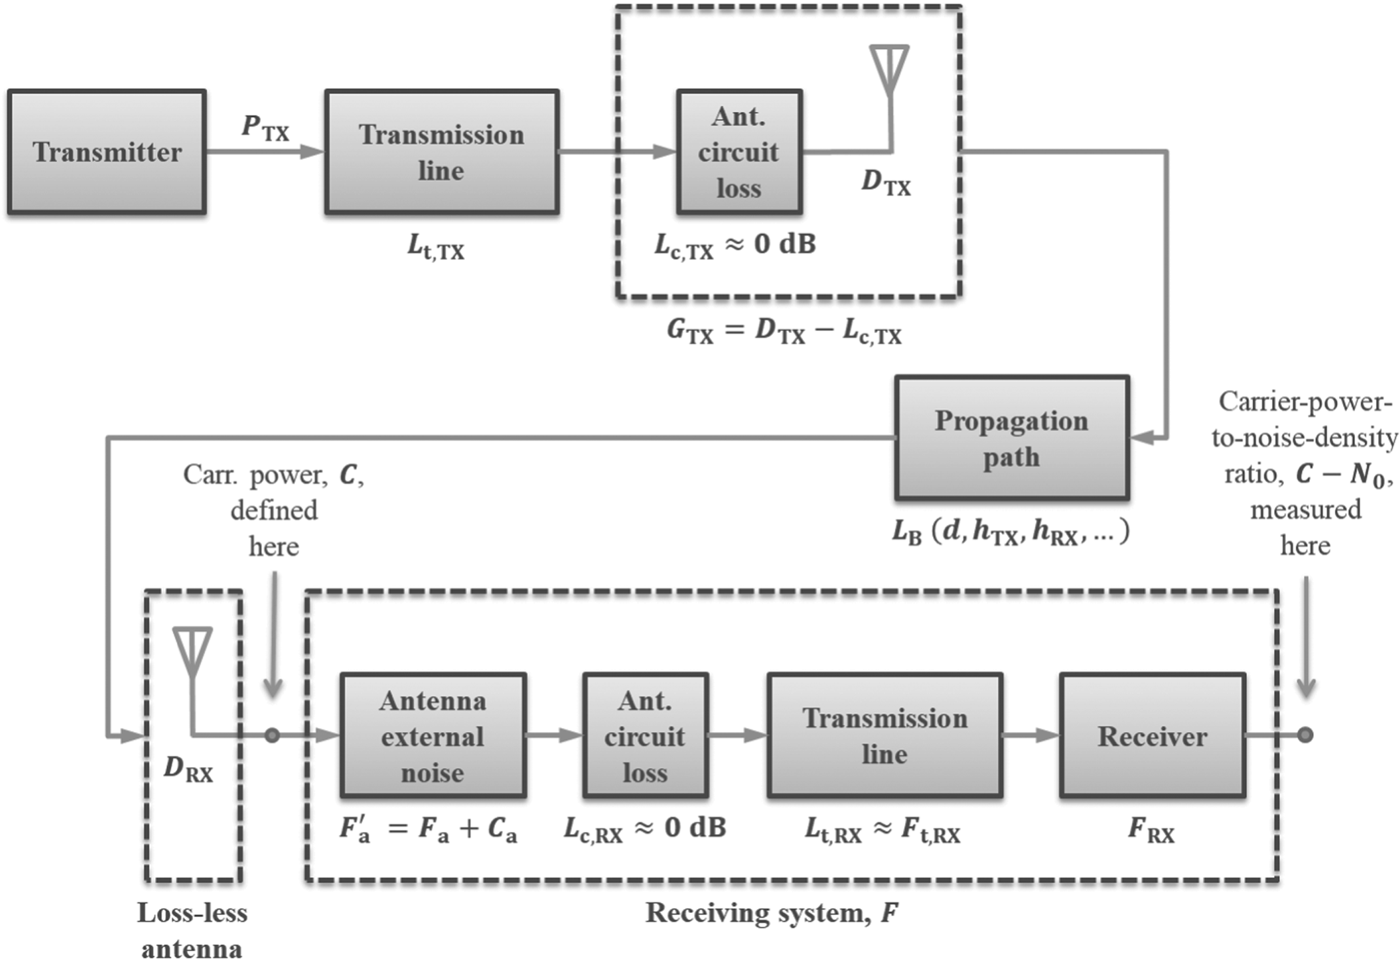
In the above equation, P TX is the base station transmitter output power, L t,TX represents the transmission line loss incurred at the transmitter, G TX is the transmitting antenna gain, D RX is the receiving antenna directivity (that is, the gain, G RX, plus the antenna circuit loss), and L B is the basic path loss which is a function of the transmitter-receiver distance, d, antenna heights above the sea level h TX, h RX and other factors (see also Figure 5).
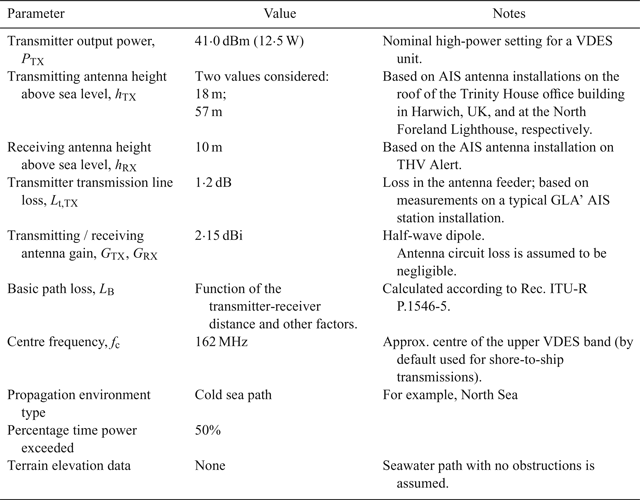
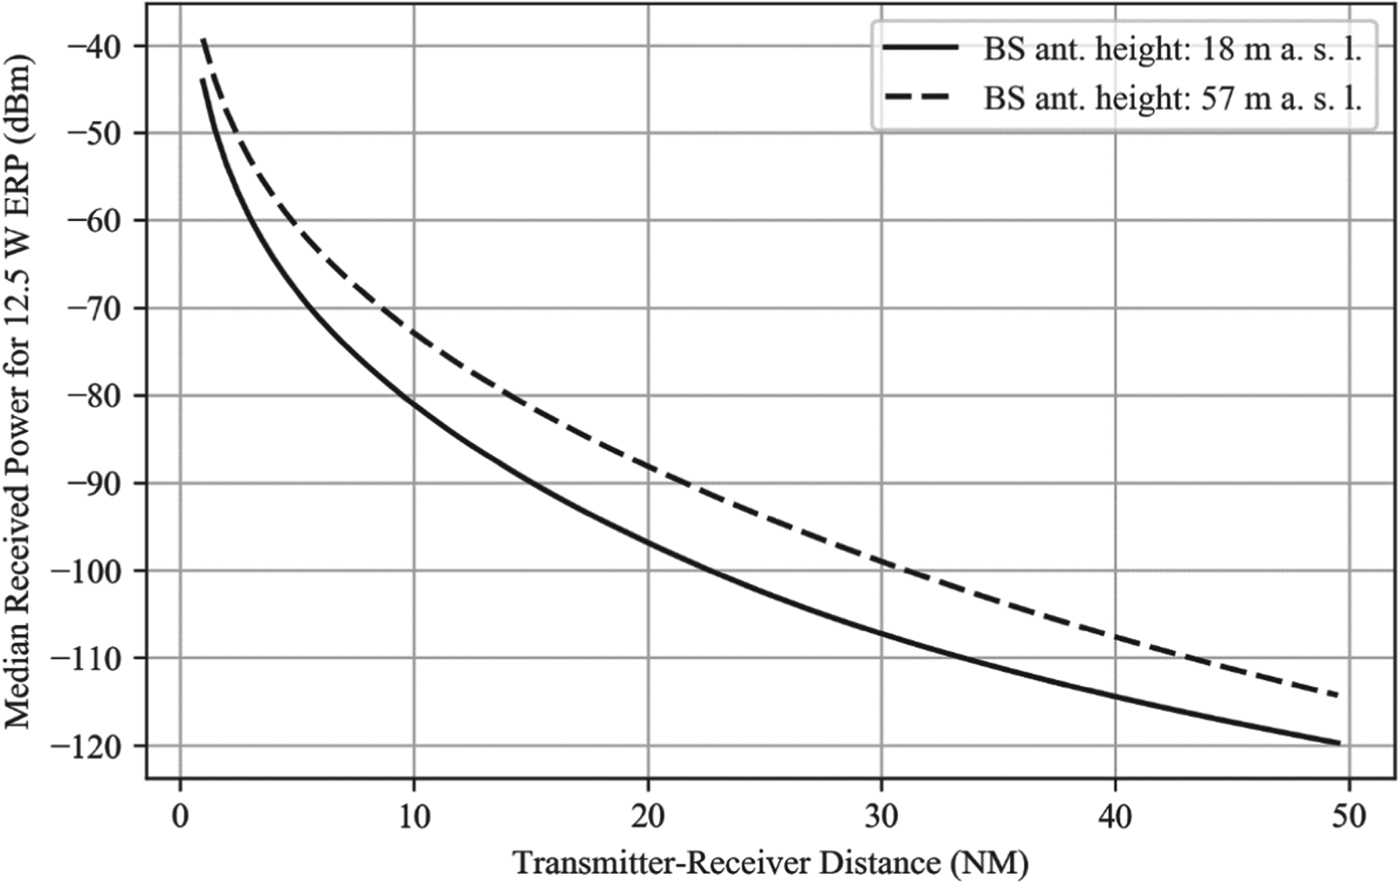
There are multiple path loss models for the VHF band available in the literature. In this study, the method described in Recommendation ITU-R P.1546-5 (ITU, 2013) is used to estimate the path loss for an all seawater path, free of obstructions. This method is based on interpolation/extrapolation from a set of empirically derived field strength curves as functions of distance, transmitting antenna height, operating frequency, propagation environment type and percentage time for which the stated signal strength is exceeded. The estimated field strength values are then corrected for the height of the receiving antenna and converted to path loss. A summary of assumptions made when modelling the VDES signal strength is provided in Table 7. Figure 4 then shows the predicted received power as a function of distance for the two representative transmitting antenna heights given in Table 7.
Table 7. Assumptions related to received power modelling.
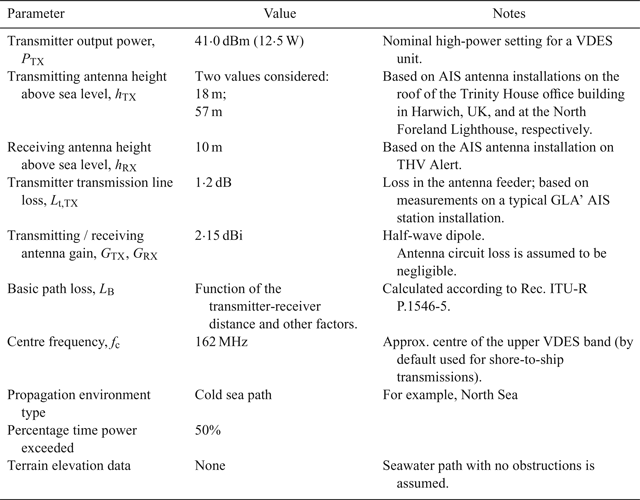
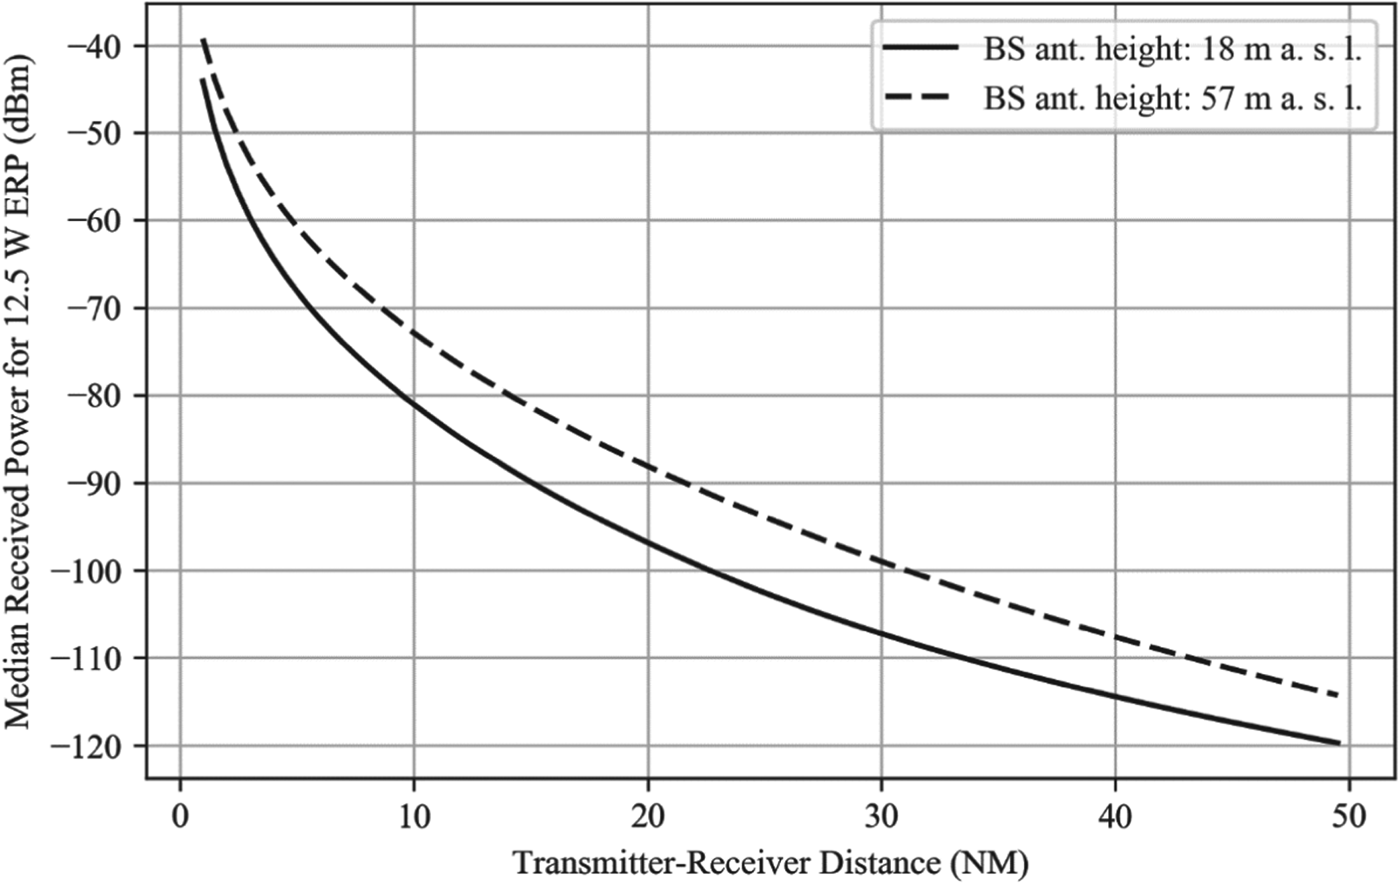
Figure 4. Received power vs. distance for a 12·5 W ERP VHF transmission, using a receiving antenna with a gain of 2·15 dBi (0 dBd).
4.4.2. Radio noise
The radio noise experienced by an R-mode receiver has two principal components: (1) external, or environmental noise received through the antenna from sources external to the receiving system; (2) internal noise generated by the receiving system itself. Assuming the receiver is installed on a vessel, the environmental noise can further be sub-divided into man-made noise generated by sources external to the vessel, and the vessel's topside noise generated by onboard machinery and electronic systems. This section aims to quantify the contributions of each of the mentioned categories of noise.
The amount of noise generated by a component in a radio system is commonly specified in terms of the noise factor, f. The noise factor is defined as the ratio of the noise power available at the output terminals of the component to the portion thereof attributable to thermal noiseFootnote 7 in the input termination at a reference temperature of 290 K. Equivalently, it can be defined as the ratio of the input signal-to-noise ratio to the output signal-to-noise ratio when the input termination is at the reference noise temperature of 290 K. The noise factor expressed in decibels is referred to as the noise figure, F=10log f. The concept of noise factor/figure can also be applied to the receiving antenna, as discussed below.
The International Telecommunication Union (ITU) provides statistical data on various types of external radio noise in Recommendation ITU-R P.372 (ITU, 2015). The recommendation specifies the noise levels in terms of the external noise figure, defined by:
where p a is the noise power available from a reference antenna when placed in a given type of environment, k is Boltzmann's constant, T 0=290 K is the reference temperature, and B is the measurement bandwidth.
According to Recommendation ITU-R P.372, man-made noise levels are expected to vary depending on the type of environment and the frequency band. For a given environment type, the median value of the external noise figure associated with man-made noise, F am,m, was found to be a linear function of the logarithm of frequency, f c:
With f c expressed in MHz, the constants c and d take the values given in Table 8.
Table 8. Parameters of the linear model of the median man-made noise (ITU, 2015).

For f c = 162 MHz, the median man-made noise is estimated to be 15·6 dB, 11·3 dB and 6·0 dB above the thermal noise floor (kT 0B) for city, residential and rural environments, respectively. For coastal navigation, the rural environment value, F am,m = 6 · 0 dB, appears appropriate from the standpoint of low density of potential sources of man-made noise while at sea and will be used in this study.
The vessel's topside noise is expected to vary depending on the type of vessel and voyage phase. Recommendation ITU-R M.1467 (ITU, 2006) gives representative figures of the topside noise, P a,v, for three types of vessel as follows (see also Table 9): the Australian Advisory Group for Aeronautical Research and Development (AGARD) figure represents a naval vessel under normal cruise conditions, while the Department of Defense (DOD) figure represents the maximum noise level under battle conditions. The figure adopted by the Ionospheric Prediction Service of the Australian Department of Industry (IPS) is generally accepted as representing the noise level encountered on container vessels, pleasure cruisers and utility ships, and is also the value that will be used in this document.
Table 9. Parameters of the linear model of the vessel's topside noise.

The values of P a,v given in Table 9 are referenced to an operating frequency of f c = 3 MHz and a bandwidth of 1 Hz. The table also shows the corresponding external noise figure values, F a,v, at this operating frequency. Assuming that the topside noise follows the same linear model used for the man-made noise above, with the parameters c and d given in Table 9, these figures can be converted to the VHF band. The values of c in the table were calculated from the value of F a,v at f c = 3 MHz assuming that d (that is, the slope of the noise figure versus log-frequency curve) takes the same value as for the man-made noise curves provided in Recommendation ITU-R P.372. (ITU, 2015) For the IPS vessel and f c = 162 MHz, the topside noise can then be estimated to be 14·0 dB above the thermal noise floor.
Combining the topside noise with the median man-made noise value for rural areas gives an external noise figure of ![]() $F_{{\rm a}}=10\log {\lpar {10}^{F_{{\rm a,v}}/10}+{10}^{F_{{\rm am,m}}/10} \rpar =14{\cdot}6\,{\rm dB}}$.
$F_{{\rm a}}=10\log {\lpar {10}^{F_{{\rm a,v}}/10}+{10}^{F_{{\rm am,m}}/10} \rpar =14{\cdot}6\,{\rm dB}}$.
The noise figure values in Recommendation ITU-R P.372 (ITU, 2015) (and presumably in Recommendation ITU-R M.1467 (ITU, 2006) too) are referenced to a (hypothetical) short, lossless, vertical monopole antenna above a perfectly conducting ground plane (referred to in the following as the ITU monopole antenna). At VHF, a half-wave dipole antenna may be used rather than a monopole; in that case, the external noise figure values may need to be corrected. Recommendation ITU-R P.372-12 (ITU, 2015) and the report by Skeie and Solberg (Reference Skeie and Solberg2016) published by the Norwegian Defence Research Establishment suggest that the external noise figure values should be increased by C a = 3 · 4 dB if a half-wave dipole is used instead of the reference monopole antenna.
The noise levels seen by the receiver are further influenced by the receiving antenna circuit loss, L c,RX, (representing the conductive and dielectric losses in the antenna) and transmission line loss, L t,RX. It is assumed here that a tuned antenna is used and therefore the antenna circuit loss is negligible L c,RX ≈ 0 dB. The receiver transmission line loss is assumed to have the same value as on the transmitting side, L t,RX = L t,TX = 1 · 2 dB.
The noise contribution from the receiver itself is given by the receiver's noise figure, F RX. A value of F RX = 10 dB is assumed based on reference (True Heading, 2018).
With reference to Figure 5, the definition of the noise factor and the Friis formula (Friis, Reference Friis1944), the overall median noise factor of the receiving system, including the effects of the external/environmental and receiver internal noise, can be expressed as follows:
where: ![]() $f_{{\rm a}}={10}^{F_{{\rm a}}/10}$ is the external noise factor referenced to the ITU monopole antenna;
$f_{{\rm a}}={10}^{F_{{\rm a}}/10}$ is the external noise factor referenced to the ITU monopole antenna; ![]() $f_{{\rm am,m}}={10}^{F_{{\rm am,m}}/10}$ is the component of the external noise factor associated with man-made noise;
$f_{{\rm am,m}}={10}^{F_{{\rm am,m}}/10}$ is the component of the external noise factor associated with man-made noise; ![]() $f_{{\rm a,v}}={10}^{F_{{\rm a,v}}/10}$ is the component of the external noise factor associated with the vessel's topside noise;
$f_{{\rm a,v}}={10}^{F_{{\rm a,v}}/10}$ is the component of the external noise factor associated with the vessel's topside noise; ![]() $c_{{\rm a}}={10}^{C_{{\rm a}}/10}$ is the external noise conversion factor for the half-wave dipole antenna; f t,RX is the noise factor associated with the transmission line loss;
$c_{{\rm a}}={10}^{C_{{\rm a}}/10}$ is the external noise conversion factor for the half-wave dipole antenna; f t,RX is the noise factor associated with the transmission line loss; ![]() $l_{{\rm t,RX}}={10}^{L_{{\rm t,RX}}/10}$ is the loss factor corresponding to the transmission line loss and
$l_{{\rm t,RX}}={10}^{L_{{\rm t,RX}}/10}$ is the loss factor corresponding to the transmission line loss and ![]() $f_{{\rm RX}}{=10}^{F_{{\rm RX}}/10}$ is the receiver noise factor.
$f_{{\rm RX}}{=10}^{F_{{\rm RX}}/10}$ is the receiver noise factor.
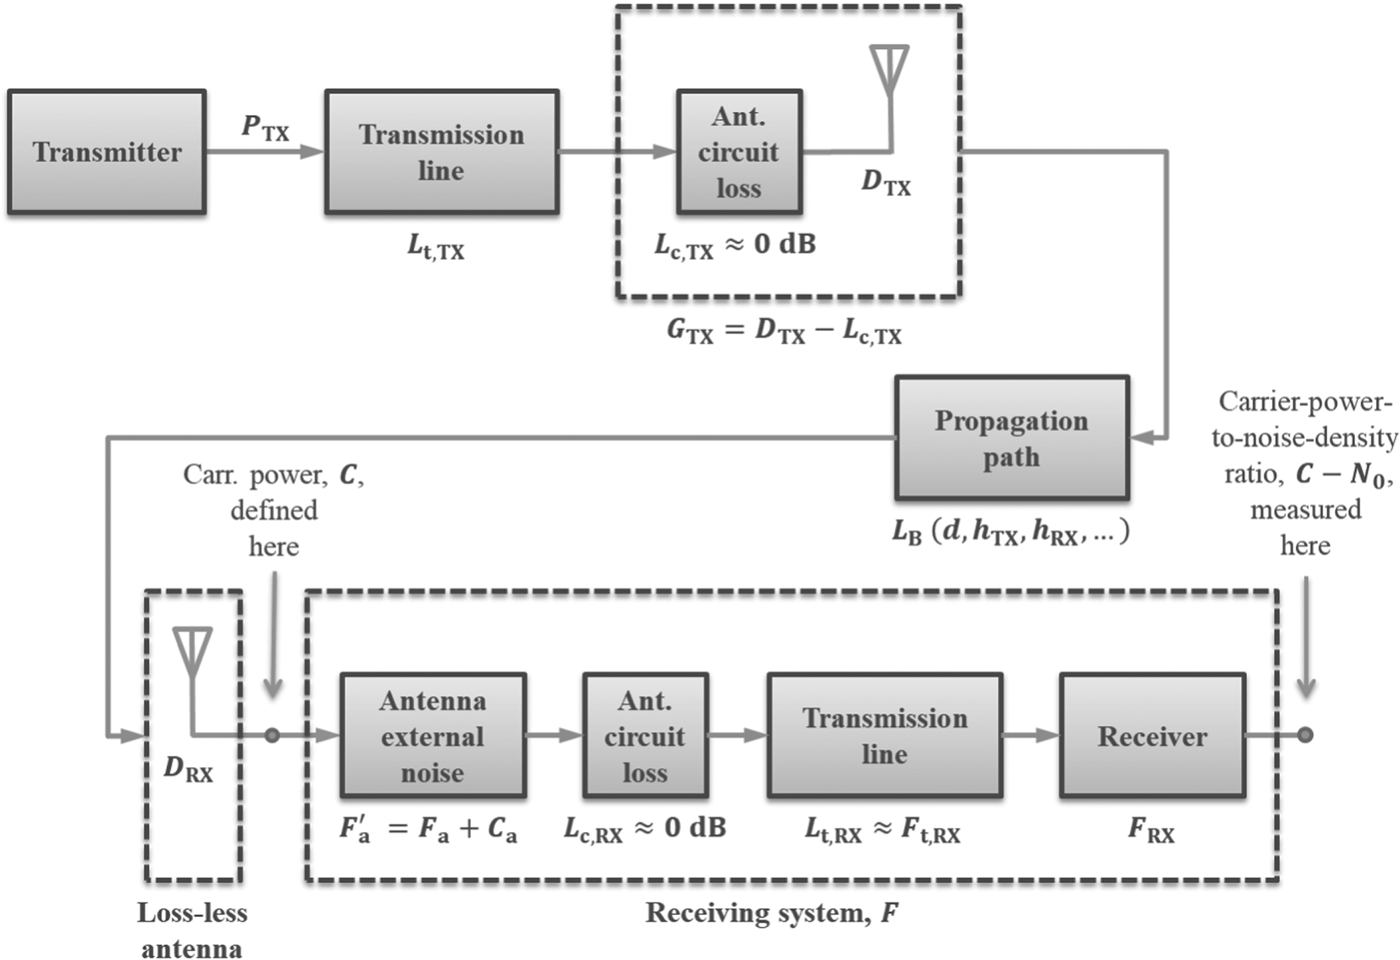
Figure 5. Noise-equivalent model of the system.
It can be shown that if the actual physical temperature of the transmission line is equal to the reference temperature T 0 = 290K, then f t,RX = l t,RX, and the above expression can be simplified to:
Substituting for the variables in Equation (43) (assuming F am,m = 6 · 0 dB, F a,v = 14 · 0 dB, C a = 3 · 4 dB, L t,RX = 1 · 2 dB and F RX = 10 dB, as discussed above) yields an overall system noise factor f=75·8, corresponding to a system noise figure F = 18 · 8 dB.
Although taking a different approach, the ACCSEAS AIS R-mode study (Johnson and Swaszek, Reference Johnson and Swaszek2014a) arrived at a similar conclusion with respect to the radio noise levels on ships. The study argued that the AIS requirement of 20% Packet Error Rate (PER) at the minimum signal strength of −107 dBm stated in the AIS technical specification (ITU, 2014) is equivalent (under certain simplifying assumptions) to requiring E S/N 0 = 9 · 8 (or 9·9 dB) at the output of the receiver when a signal with the minimum signal strength is applied at its input. In the presence of thermal noise only, the minimum input signal level corresponds to an E S/N 0 of 27·2 dB at the receiver input, which implies a receiver noise figure of F RX = 27 · 2 − 9 · 9 = 17 · 3 dB. In the ACCSEAS study, this figure was effectively used as an estimate of the system noise figure, F. It should be noted that a receiving system using a receiver that just meets the AIS requirement will have a system noise figure that is somewhat higher than 17 · 3 dB due to the transmission line loss and external noise, as discussed above.
For the purpose of the current study, the overall system noise figure (including the effects of the environmental noise) will be assumed to be F=19 dB. This corresponds to a (one-sided) noise power spectral density of ![]() $N_{{0}}=kT_{{0}}{\cdot}10^{\displaystyle{F \over 10}}=3{\cdot}18\cdot 10^{-19}\,{\rm W/Hz}$ (or −155 dBm/Hz), which is the value that will be used in calculating the received carrier-power-to-noise-density ratio, C/N 0.
$N_{{0}}=kT_{{0}}{\cdot}10^{\displaystyle{F \over 10}}=3{\cdot}18\cdot 10^{-19}\,{\rm W/Hz}$ (or −155 dBm/Hz), which is the value that will be used in calculating the received carrier-power-to-noise-density ratio, C/N 0.
4.4.3. Maximum range for data reception
As discussed in Section 2.5, it is assumed that in order to be able to measure the range to a VDES base station, the user must be located within the data coverage area of the station. It will therefore be useful to determine the maximum communication ranges for the different VDES waveform configurations.
Table 10 shows the minimum received power (also referred to here as sensitivity), C min, required to demodulate each of the five waveforms considered in this study, allowing a Bit Error Rate (BER) of at most 10−6. It can be shown that this level of BER is sufficient to ensure the successful reception of four statistically independent VDES messages with a probability of greater than 99%, which is consistent with the 99% service availability requirement for a GNSS back-up stated in IALA Recommendation R-129 (IALA, 2012). The assumption is made here that the lowest-order modulation and lowest Forward Error Correction (FEC) rate available within the given VDES subsystem, as defined in the draft VDES specification (IALA, 2018), are used. If a higher-order modulation or weaker FEC coding is used, the required power will be increased, and maximum ranges reduced compared to the values given in Table 10.
Table 10. Estimated maximum transmitter-receiver range for successful data demodulation (BER of 10−6).

The minimum required power in dBm was calculated as follows:
where: γb,min is the minimum energy-per-bit-to-noise-power-density ratio, expressed in dB, required for the demodulation of the given waveform with a BER of 10−6, ignoring gains from FEC; the values shown in Table 10 were determined from BER curves published in Middlestead (Reference Middlestead2017); G c is the coding gain of the FEC code in dB, obtained from Bronk et al. (Reference Bronk, Mazurowski, Rutkowski and Wereszko2016); k is the number of bits per symbol for the given waveform (1 for GMSK, 2 for Pi/4-QPSK) and the remaining terms have been defined before. The last two columns of Table 10 then show the corresponding maximum communication ranges for two representative base station antenna heights, as determined from Figure 4.
4.4.4. Ranging error versus distance
Using the theoretical bounds on the ranging performance derived in Section 4.1, the received power versus distance curves provided in Section 4.4.1, and the R-mode receiver noise floor established in Section 4.4.2, it is now possible to estimate the VDES ranging error as a function of distance from the VDES R-mode base station.
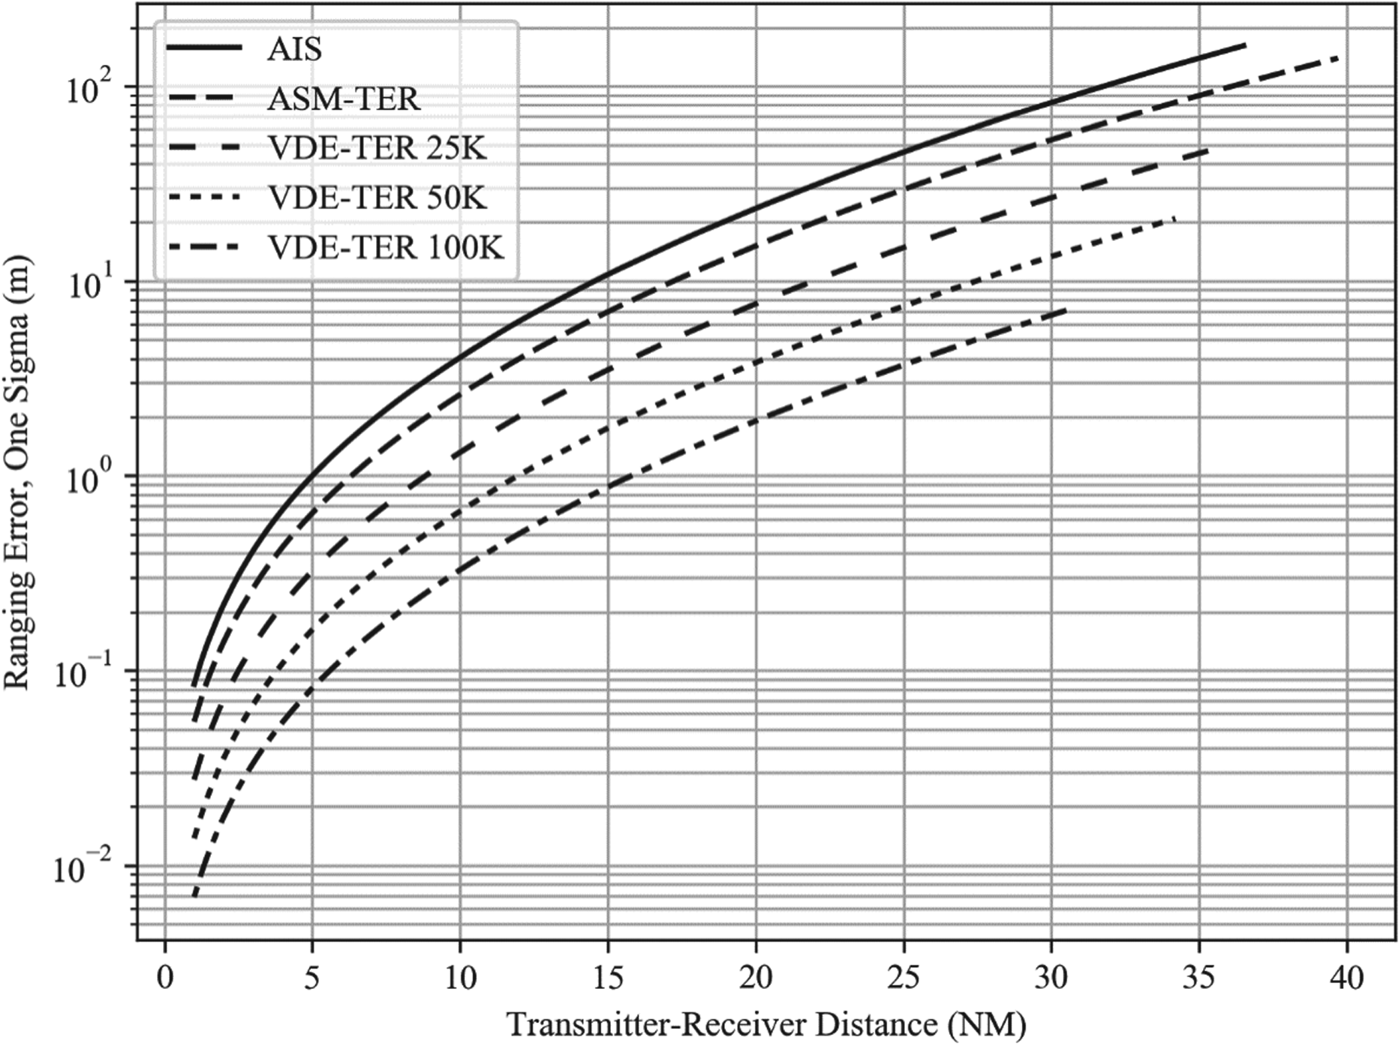
Sample plots are provided below, showing the estimated ranging error for the five VDES waveform configurations and two representative base station antenna heights (18 m versus 57 m) considered previously. Figure 6 shows the error for one-slot R-mode transmissions and Figure 7 assumes that the R-mode receiver combines five successive one-slot transmissions during the pseudorange estimation process (other combinations of antenna heights, transmission and receiver configuration are omitted due to lack of space). Maximum range limits were applied to the plots as per Table 10.

Figure 6. Ranging error vs. distance; one-slot transmissions; no receiver integration; base station antenna height: 18 m.

Figure 7. Ranging error vs. distance; one-slot transmissions; receiver integration over 5 slots; base station antenna height: 57 m.
Caveat: the ranging error predictions shown in this section do not include the effects of transmitter synchronisation error and jitter, multipath propagation and propagation delay biases due to tropospheric effects and terrain topography.
4.5. Maximum usable station range
Assuming that AIS/VDES R-mode is realised as a standalone passive ranging system with a horizontal position precision target, p DRMS, in the low tens of metres, and that favourable base station geometry can be guaranteed across the target coverage area (HDOP<2)Footnote 8, then the ranging error for each station included in the position solution must be no greater than approximately p DRMS/HDOP ≈ 20/2 = 10 m.
Table 11 shows the estimated maximum transmitter-receiver separation at which a 10 m ranging error can be achieved, for the AIS (worst performance) and the VDE-TER 100K (best performance) R-mode waveform configurations, three observation interval lengths and two representative base station antenna heights. As can be seen from the table, the maximum usable range for AIS-based R-mode is expected to be between 10 NM and 15 NM. If one of the new VDE-TER 100K waveforms is used instead of AIS, the maximum range is expected to increase to about 23 NM to 31 NM.
Table 11. Estimated maximum transmitter-receiver separation for 10m ranging error.

5. CONCLUSIONS
This work has shown that, under the assumption of an AWGN propagation channel, all of the new VDES waveforms provide better ranging performance than the AIS waveform. The best performance is achieved using the 100 kHz bandwidth VDE-TER waveforms, which provide approximately five to 12-times lower one-sigma ranging errors than the AIS (depending on the transmission configuration). Assuming a horizontal positioning precision target in the low tens of metres, the maximum usable station range for AIS R-mode is expected to be between 10 NM and 15 NM (depending on the antenna heights) and between approximately 23 NM to 31 NM if the 100 kHz bandwidth VDE-TER waveforms is used. It is therefore recommended that future work in this area focus on VDES rather than AIS-based R-mode.
The results presented in this paper can be used as a basis for the development of an AIS/VDES R-mode coverage and performance model, as demonstrated by the authors in Safar and Grant (Reference Safar and Grant2018), and as a benchmark for the assessment of engineering implementations of R-mode. However, it should be noted that the models derived here do not include the effects of transmitter synchronisation error and jitter, multipath propagation and propagation delay biases due to tropospheric effects and terrain topography. Future work will focus on quantifying these effects.
Immediate future work will include research into performance bounds for multipath fading channels and the development of a measurement system to assess the variability of VHF signal propagation delay due to the various environmental factors mentioned above.


