1. INTRODUCTION
Around 20 million tons of laterite and saprolitic nickel ores are shipped to smelters in China each year (Lei Hai, Reference Lei2011). This number is growing with the needs of a strong economy, driving the shipment of ores from Indonesia, Philippines and New Caledonia to China.
Recently, however, there have been a number of reported instances where these cargoes have liquefied, possibly as a result of excessive water content, during shipment. After researching marine casualty databases, we found there had been several incidents where ships were lost while carrying nickel ores to China.
On 27 October, 2010, the Panama flagged, 45000-dwt Jian Fu Star, built in 1981 in Japan, carrying laterite nickel ore from Indonesia to Qingdao, sank off south of Taiwan with the loss of one crew member, 12 missing and 12 rescued.
On 9 November, 2010, a brand new Chinese vessel, the 56000-dwt Nasco Diamond, built in 2009, carrying laterite nickel ore from Indonesia to Lianyungang in China, developed a list and subsequently foundered off Okinawa with two killed, 20 missing and only three survivors.
On 22 November, 2010, just two weeks later, the Panama flag vessel, 6500-dwt Haixing, capsized near Lianyungang port carrying nickel ore from Indonesia to China with no loss of lives because an SOS signal was sent out immediately.
On 3 December, 2010, the Panama vessel Hongwei, fully laden with 40000 ton cargo, sank off the southwest of Taiwan while carrying nickel ore from Indonesia to Shandong in China, with 10 missing and 14 rescued.
The latest incident was on 25 December, 2010. The Vinalines Queen, flying the Vietnamese flag, on a voyage from Morowali to Ningde, carrying laterite nickel ore, was northeast of Luzon in the Philippines when contact was lost. The only survivor confirmed that the 56000-dwt vessel, built in 2005, sank off the Philippines after developing an 18 degree list. 22 crew members lost their lives.
The loss of the Vinalines Queen was at least the fourth bulk carrier within 36 days carrying nickel ore, a cargo at the centre of major concern about its potential for liquefaction (Lei Hai, Reference Lei2011). Although the cause of the sinkings has not yet been definitively determined, the nickel ore, like iron ore fines and many concentrates, is a cargo that may liquefy if the moisture content of the cargo exceeds the Transportable Moisture Limit (TML) when loaded. Liquefaction of such a cargo may result in loss of stability that in turn can lead to a vessel capsizing. There are a number of comments and analyses about liquefaction of laterite nickel ore in previous literatures, but there is little information as to how the loss of the stability could be attributed to the liquefaction of cargo. The mechanisms of capsizing due to liquefaction of nickel ore still remain uncertain.
2. THEORETICAL FOUNDATIONS
To understand how the liquefaction of nickel ore leads to the loss of stability, we investigated a number of vessels including those carrying liquefied nickel ore that did not result in loss of the ship. The initial investigation shows that all incident vessels, including sunken vessels, were in good working condition but experienced Force 6–8 (Beaufort Scale) beam winds and 2–4 m waves or swells while sailing. Some of the vessels lost were almost new; therefore, the possibility of ship fracture is markedly reduced.
According to the accounts of survivors, all sunken vessels had developed a list before capsizing; this has led to a speculation that the sinkings are possibly attributable to the loss of stability. How does this happen for vessels carrying ores with huge GM (metacentric height) values?
2.1. Free Surface Effect
There is a wide range of mineral cargoes that may liquefy, and they vary in their appearance and physical properties (Wang, et al., Reference Yongzhi, Lu, Liu and Guan2010). Liquefaction of those ore cargoes, such as lateritic and saprolitic nickel ores, can be caused by normal incidents during a sea voyage, for example, the motions of the ship in the seaway or vibrations caused by the running of the main engine or other on board machinery.
Investigations indicate that only the upper part of the nickel ore is involved in liquefaction. The depth of liquefaction is determined by the length of journey, structure of the vessel, types of engine and propulsion, course and speed set, physical and chemical properties of the nickel ore and the sea condition, etc.
Liquefied cargo becomes a glutinous thick slurry, can move freely, create free surface and may result in the loss of stability. The calculation for the GM value change in the previous literature (Lei Hai, Reference Lei2011) reveals that the loss of the GM value is only 0·38 m for a 50000-dwt bulk carrier with five cargo holds based on the following formula:
 $$\Delta GM = (LB^3 \times \gamma ) \times 1/12 \times D$$
Where L is the length of cargo hold, B is the beam, D is the displacement and γ is the density of “fluid”.
Such loss of the GM value is not likely to lead to a loss of stability for a vessel with high GM value in carrying ore cargo. More importantly, the liquefied nickel ore is highly viscous, but the above formula is applicable for non-viscous fluid only.
2.2. Numerical Simulation
There is currently a lack of methods for calculating the effect of free surface of the viscous fluid. In an effort to counter the flaws of the formula, a numerical simulation method has been developed and applied to the analysis. The simulation has shown that under the influence of cross winds and waves or swells, the viscous fluid can create considerable negative effects on a ship's stability, and may result in capsizing if the course, speed and winds are in favour of developing a list.
Ship motion in irregular waves may be described by non-linear equations of motion written in the non-inertial reference system (Krata, Reference Krata2010). Normally, the forces generated by winds and sea waves and inertia determine equations of ship motions. However, in the case of liquefied cargo with viscosity carried by ships with partly filled holds, sloshing induces additional forces acting on the ships, which have been taken into account in these equations.
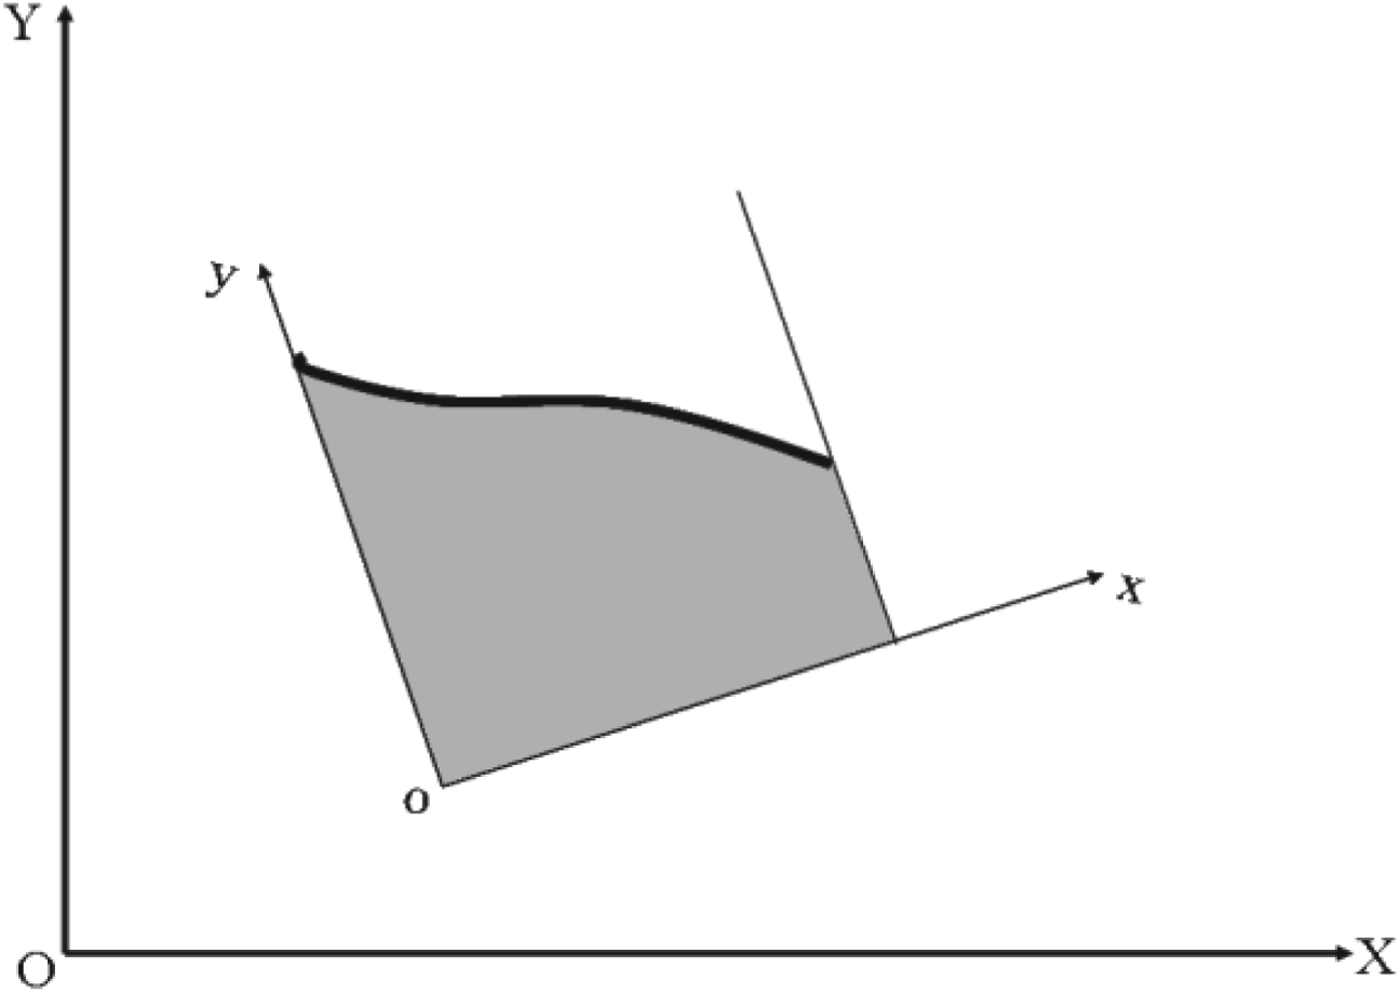
This study considers rolling motion in beam seas of a ship with rectangular holds. For simplicity, the parameters of liquefied cargo are assumed to be the same in all parallel cross sections of the holds and can be represented by flow in a 2D cross section. The hold is assumed to be under forced translational and rotational excitation, and two coordinate systems are defined: at the centre of rotational motion O and on the hold bottom; see Figure 1.

Figure 1. Coordinate system for a two dimensional tank under the forced excitation.
To construct the governing equations, the following assumptions are made:
• The fluid flow is incompressible and laminar.
• All fluid properties are assumed to be unchanged with time.
• The depth of the fluid is sufficient.
2.2.1. Equations of ship motions
The equations of ship motions in irregular waves are written in the non-inertial reference system. The system Q is fixed to the ship in the centre of its mass and the equations of ship rolling motion assume the following form in the time domain (Zhu, et al., Reference Renqing, Ziyong and Zhaogang2008):
 $$(M + m)\ddot \xi + C\dot \xi + K\xi = - \int_0^t {\vec R} (t - \tau )\dot \xi (\tau )d\tau + { \vec f{\dot}}$$
Where
- M
is mass matrices of ship without fluid;
- m
is additional mass matrices,
- C
is linear damping matrices,
- K
is restoring moment matrices,
- R
is pulse response function,
- f
is external force.
The pulse response function R(t) can be obtained from the wave damping matrices C W calculated in frequency domain:
 $$\vec R(t) = \displaystyle{2 \over \pi} \int_0^\infty {C_w} (\omega )\displaystyle{{\sin \omega} \over \omega} d\omega $$
2.2.2. Mathematical model of sloshing motion
In this study, a numerical model is developed for solving the two-dimensional sloshing motion. The viscous fluid flow theory is adopted to build up the mathematical model. The Level Set Method (LSM) is then used to predict the behaviour of free surface (Colicchio, et al., Reference Colicchio, Landrini and Chaplin2005). For the numerical method, the Finite Volume Method (FVM) is also used to solve the governing equations, and the fully implicit scheme is used to treat the LSM (Wang, et al., Reference Chung-Yueh, Jyh-tong and George2011).
When the hold is partially filled, the motion excites a sloshing flow that is governed by the continuity and Euler equations, in addition to a proper set of boundary conditions. If the effects of surface tension, compressibility, and the elastic response of the hold structure are neglected, the fluid motion is expressed by the following equations (Wang, et al., Reference Chung-Yueh, Jyh-tong and George2011):
 $$\int\limits_V {\rho \vec V} \cdot \vec n dA = 0$$
 $$\displaystyle{\partial \over {\partial t}}\int\limits_V {\rho d\vec VdV + \int\limits_S {\rho \vec V}} \vec V \cdot \vec n dA = - \int\limits_S {P\vec n} dA + \int\limits_S {\mu (\nabla \vec V + \nabla \vec V} ^T ) \cdot \vec n dA + \int\limits_r {\rho \vec f} dV$$
where V(u,v) is the velocity vector of fluid, defined in the hold fixed coordinates, and ρ,p and  $\vec f$ are the fluid density, pressure and external force vectors, respectively. μ is the viscosity coefficient of liquefied cargo. In addition,
  $\vec n$ is normal vector. The external force vector
  $\vec f$ includes the change of gravitational force and inertia forces due to translational and rotational motions. This vector can be expressed in format as (Das, et al., Reference Das, Shiraishi and Das2010):
 $$\vec f = \vec g - {\vec \xi {\dot}}{_{1,2}} - {\vec \omega {\dot}} \times \vec r - 2\vec \omega \times {\vec r {\dot}}- \vec \omega \times (\vec \omega \times \vec r)$$
where  $\vec g$,
  $\vec \xi $ and
  $\vec \omega $ denote the gravitational acceleration vector, the translational motion vector (ξ 1,ξ 2) and rotational velocity vector of the ship, respectively. In addition,
  $\vec r $ is the position vector of the considered point with respect to the ship centre, as shown in Figure 1.
The  $\vec f$ consists of two parts, the force
  $\vec f_w $ generated by the winds and waves, and the force
  $\vec f_s $ created by the sloshing. The later is a function of the additional mass.
Despite the existence of various numerical schemes that are available today to solve the boundary value problem, this study focuses on a numerical scheme capable of impact simulation due to violent sloshing flows. As is well known, the sloshing flow becomes strongly nonlinear, particularly near resonance between the sloshing flow and excitation. Furthermore some local flows may not be of primary concern from the viewpoint of engineering application. Therefore, the free surface boundary is assumed to be a single-valued function. The kinematic free surface boundary condition can then be written as follows (Kim, et al., Reference Yonghwan, Yung-Sup and Kwang Hyun2004):
 $$\displaystyle{{\partial \eta} \over {\partial t}} + \vec V \cdot \nabla (\eta - y) = 0$$
where η is the free surface elevation. In the LSM, the free surface is defined as the one with a level set function η=0. The LSM is often expressed as advection equation so that this equation is expressed as (6).
For the LSM, the level set function η is a primitive variable. The locus of free surface can then be determined by the level set function. The spatial derivative term in Equation (6) is treated by the second-order upwind scheme. The level set function on the cell face is approximated by the Taylor series expansion. The temporal derivative term in Equation (6) is approximated by using a third-level second order scheme. Through the FVM or finite difference method (FDM) in solving the level set function, the variation of free surface can be evaluated.
3. NUMERICAL METHOD
To develop numerically simulated methodology, the governing equations of sloshing motion can be written by using dimensionless variables (for the sake of brevity, the details of the formula transformation are omitted). By substituting dimensionless variables into the governing equations, the dimensionless form of governing equations can be rewritten. The numerical discretization schemes are naturally employed to evaluate the governing equations.
In this study, the FVM was utilized to solve the governing equations. All variables were defined at the centre of the cell. The second-order upwind scheme was adopted to discretize the convection term, and the central difference scheme was used to discretize the diffusion term. The third-level second order scheme (Ferziger and Peric, Reference Ferziger and Peric2002) was employed to discretize the temporal derivative term. In addition, the momentum interpolation method was used to avoid the checkerboard error (Rhie and Chow, Reference Rhie and Chow1983). Numerical solutions of velocity and pressure associated with the fluid flow of the sloshing motion were done by the cell-centred pressure-based SIMPLE scheme (Chen and Nokes, Reference Chen and Nokes2005).
Considering the discretization of the tank volume into (imax, jmax), the concept of the Cartesian staggered grid is adopted. Numerical solutions of velocity and pressure associated with the fluid flow of the sloshing motion are done by the SIMPLE scheme. The velocity components are defined on the cell boundaries, while the pressure is computed at the centre of each cell. In the SIMPLE scheme, an iterative method is applied to the computation of instantaneous pressure and velocities. The first step of the iteration is to compute the pseudo velocity such that (Kim, et al., Reference Yonghwan, Yung-Sup and Kwang Hyun2004):
 $$\vec V_{ij}^ * = \vec V_{ij}^n + \Delta t[ - \displaystyle{1 \over \rho} (\hat \nabla p_{ij}^{(n)} + (\vec f)_{ij}^{(n + 1)} ] - \Delta t\{ \vec V \cdot \hat \nabla \} _{ij}^{(n)} \vec V_{ij}^{(n)} $$
where Δt is the temporal segment, and ^ indicates the discrete gradient. The subscript, ij, indicates the cell index for x and y directions and the superscript (n) denote the n-th time step. Substituting Equation (7) into the continuity equation, we can compute the pressure correction Δp ij as follows (Popov, et al., Reference Popov, Vatistas, Sankar and Sankar S1993, Kim, et al., Reference Yonghwan, Yung-Sup and Kwang Hyun2004):
 $$\Delta p_{ij} = - \displaystyle{{\rho (\hat \nabla \cdot \vec V_{ij}^ * )} \over {2\Delta t(1/\Delta x_i^2 + 1/\Delta y_j^2 )}}$$
where Δ(x,y) are the spatial segments. Then, the actual velocity can be written as
 $$\vec V_{ij}^{(n + 1)} = \vec V_{ij}^ * + \Delta p_{ij} \displaystyle{{\Delta t} \over {\rho \{ \Delta x_i, \Delta y_j \}}} $$
Correction of pressure and velocity using Equations (8) and (9) should be carried out for all the cells in the fluid domain. Again, the corrected velocity can then be substituted into Equation (8) for another pressure correction, and this iteration can be continued until the pressure correction is obtained within a specified error criteria.
The solution is sensitive to the finite difference formulation for the convection term. A combination of the second-order central difference and the first-order upwind difference was proposed by Hirt and Nichols (Reference Hirt and Nichols1981). Adopting a weight parameter α, this combination can be written as:
 $$\left( {\displaystyle{{\partial f} \over {\partial s}}} \right)_i = \{ 1 + {\rm\alpha} \, {\mathop{\rm sgn}} (\,f_i )\} \left( {\displaystyle{{\,f_i - f_{i - 1}} \over {\Delta s}}} \right) + \{ 1 - {\rm\alpha} \, {\mathop{\rm sgn}} (\,f_i )\} \left( {\displaystyle{{\,f_{i + 1} - f_i} \over {\Delta s}}} \right)$$
It is obvious that more numerical damping is induced when greater weight is given to the first-order upwind difference, i.e. as α approaches 1.
The discrete form of Eq. (6) takes the following form:
 $$\eta _{ij}^{(n + 1)} = \eta _{ij}^{(n)} - \Delta t\left\{ {u_\eta ^{(n + 1)} \left( {\displaystyle{{\partial \eta} \over {\partial x}}} \right)_{ij}^{(n)} + v_\eta ^{(n + 1)} \left( {\displaystyle{{\partial \eta} \over {\partial y}}} \right)_{ij}^{(n)}} \right\}$$
where u η,vη are the velocity components on the free surface, which can be obtained by interpolation. The surface slope terms, (∂η/∂(x,y)), can be approximated also to the finite difference form of Eq. (10). In particular, a numerical filtering can be applied to avoid the instability due to sawtooth waves.
4. RESULTS AND DISCUSSION
The scheme of undertaken research comprises numerical simulations and physical model validations. To evaluate the consistency of the numerical solution, a small experimental ship 4·5 m in length, 2·6 m in breadth and 1·8 m in depth has been used in this study. The small ship with a single cargo hold is equipped with pressure transducers that are installed evenly alongside the vertical wall of the hold, an accelerator and a lateral inclinometer in the bridge centre. The elevation of free surface in transverse section can be documented dynamically by the elevation sensors mounted on the wall. This vessel is forced by the electronic irregular wave generators into an oscillating motion that excites the sampled nickel ore movement inside it. The rolling motion can be recorded every second.
Normally, liquefaction takes time under the impact of waves and vibrations. In a bid to achieve the results in a limited time, we intentionally set the moisture content at 38·2% for the sampled nickel ore, which is greater than that (35·7%) recommended by The International Maritime Organization's (IMO) Code of Safe Practice for Solid Bulk Cargoes (BC Code), but very close to that one being carried by the incident vessels. The kinematic viscosity at room temperature varies ranging from 0·00332 m2/s to 0·00756 m2/s with the change of its states (from near solid to mixture), and the Reynolds number varies from 3,953 to 1,736 (Re=(b 3g)1/2/v) accordingly, but we choose the mixture state as the worst condition for our simulations. The boundary condition is no-slip on the wall. The initial excitation amplitude, A, is 0·23 m and the initial excitation frequency, ω, is 1·731 rad/s. The resonant frequency is 2·164 rad/s.
4.1. Effect of Excitation Frequency on Free Surface Displacement
The variation of free surface displacement depends on various factors, such as excitation amplitude, excitation frequency, tank geometry, and viscosity of liquid. This paper performed parametric studies with regard to excitation frequency, excitation amplitude, and viscosity of fluid.
The ship is excited by a number of excitation frequencies. For a given excitation amplitude, A=0·23 m, together with a sufficient liquid depth, the free surface displacement increases when the excitation frequency is less than the resonant frequency of the tank. However, the free surface displacement decreases when the excitation is greater than the resonant frequency of the tank. It is noted that the maximum free surface displacement is generated under the circumstance for which the excitation frequency approaches the resonant frequency. The excitation frequency has a substantial effect on the impact pressure on the wall of the tank being investigated. Figure 2 shows that the simulated results are in good agreement with that measured. All graphs are smoothed in the same manner.
Figure 2. The free surface displacement vs. time. The excitation amplitude is 0·23 m.
4.2. Effect of Excitation Amplitude on Free Surface Displacement
For the case study, the excitation frequency is assumed to be 2·059 rad/s; the free surface displacements are evaluated by the LSM for three excitation amplitudes of 0·25, 0·3 and 0·35 m, respectively. As shown in Figure 3, the frequencies of occurrence of free surface displacements are the same for various excitation amplitudes. In addition, as shown in Figure 3 for a fixed excitation frequency of 2·059 rad/s, the free surface displacement is nearly linearly proportional to the excitation amplitude. In other words, as the excitation amplitude increases, the free surface displacement also increases. As a result of the excitation amplitude increases, the kinetic energy of liquid also increases; this means that the free surface displacement also increases. However, the validation for higher amplitudes has not yet been done due to the constraints of the test field and equipment.
Figure 3. The free surface displacement vs. time. The excitation frequency is 2·059 rad/s.
It is noticed that the simulated and measured results are broadly in agreement. Any significant discrepancy may be attributed to the impact of the higher amplitudes on the instruments because of the size of the small craft.
4.3. External Moment
The external moment exerting on the ship includes two parts: the moment from the waves and winds, and the moment from the liquid sloshing. Here, only the latter is demonstrated as we wish to see the variations of the critical factor.
The excitation frequency is 2·137 rad/s and the amplitude is 0·32 m. The pressure on the sidewall is obtained from the pressure sensors. The moment can be evaluated after the pressure has been integrated and calculated; see Figure 4.
Figure 4. The external moments vs. time. The excitation frequency is 2·137 rad/s and the amplitude is 0·32 m.
The moment generated by the viscous liquid has an obvious upward trend which is quite different from that created by the non-viscous fluid. The likely explanation is that the acceleration produced by the righting moment is much bigger than that produced by the waves and winds, and the sloshing lags the rolling motion of the ship, therefore, the fluid takes less time to move from stable position (centre) to one side (against the waves and winds) than from the side to the centre. As a result, part of the fluid remains on the side in the first counting cycle. The remnants on this side keep growing in the subsequent cycles, and finally lead to capsizing.
Alternatively, huge forces created by the righting moment pull the fluid moving against the waves and winds in the first half cycle, and the fluid ultimately frees itself from the shear force to the side in the subsequent half cycle provided that the force generated by the righting moment is much bigger than the shear force. Therefore, the collapse of the shear force of the fluid may be blamed for the sudden fluid sliding (cargo shift) and capsizing and sinking (Popek, Reference Popek2010).
Before losing contact, the Vinalines Queen, loaded with nickel ore, developed an 18 degree list suggesting, there had been a cargo shift that is consistent with the results we obtained. The vessel Padang Hawk, also carrying nickel ore, with southerly winds and waves, on passage from New Caledonia to Australia near the Great Barrier Reef developed a list of 15 degrees to port, was found to have suffered a cargo shift to port (against the waves and winds) in all holds except the aftermost hold no 5. The conclusions made by Australian Transport Safety Bureau (2000) after their investigation into the said vessel are highly in line with our results.
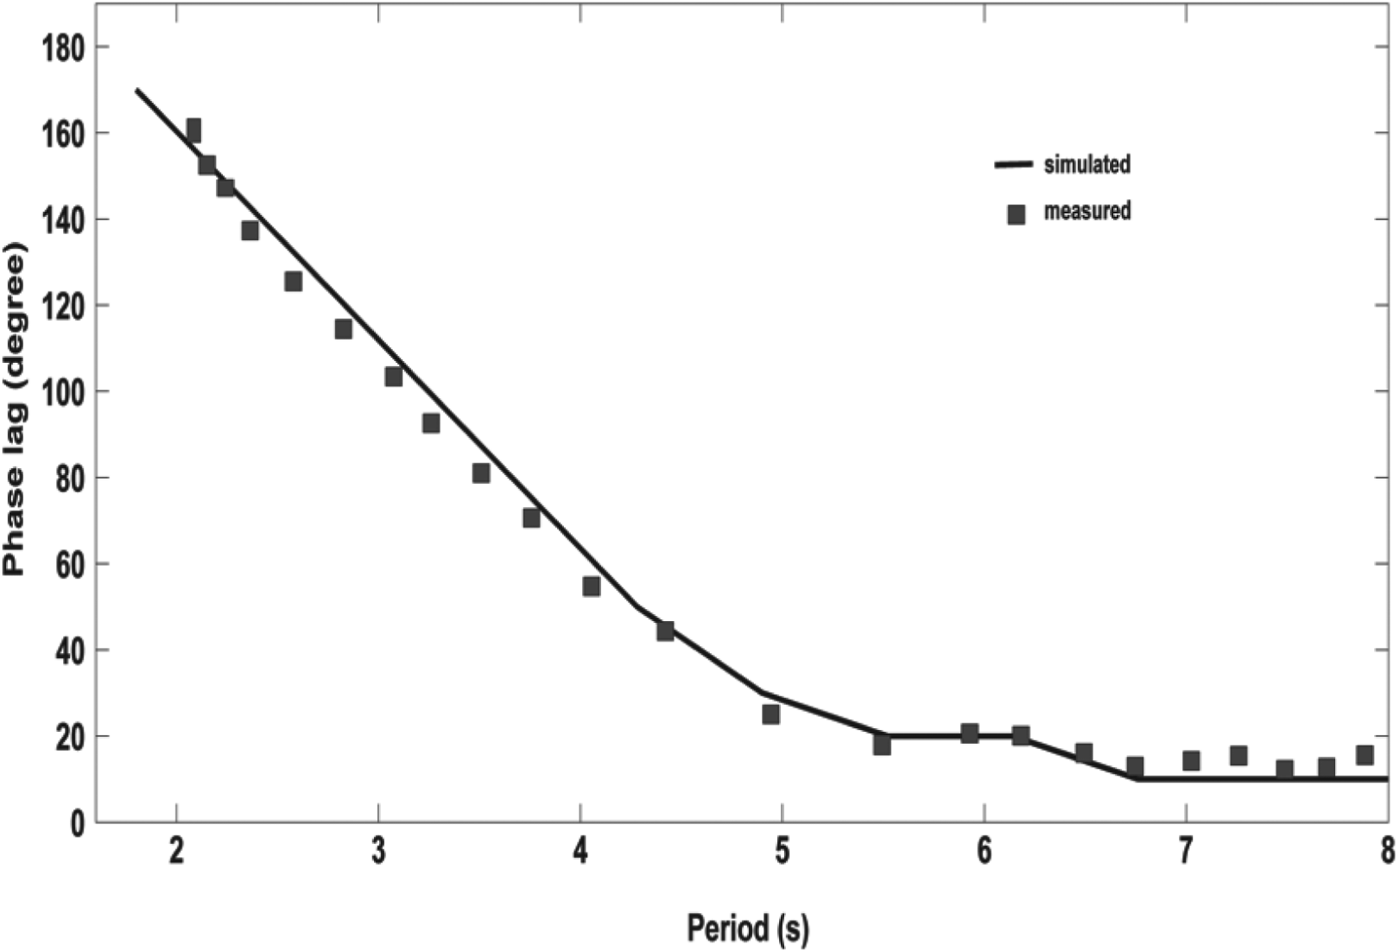
4.4. Phase Lag
For the rectangular tank without baffles, the results demonstrate good agreement for a wide range of frequencies (periods) including the zone close to the ship's resonance period. Figure 5 presents the results for the phase lags in different frequencies but the amplitude of the rolling motion is the same. It can be seen that a period of 3·5 s can produce a phase lag of nearly 90 degrees for the nickel ore. The higher the frequency, the bigger the phase lag. For the viscous fluid, the greater the viscosity, the bigger the phase lag. A “favourable” phase lag can not only put the structures of the ship at risk but also result in capsizing and sinking when the sea conditions give rise to violent rolling motions (Iglesias, et al., Reference Souto Iglesias, Pérez Rojas and Zamora Rodríguez2004).
Figure 5. Phase lag, rectangular tank without baffles, amplitude of the roll motion is 6°.
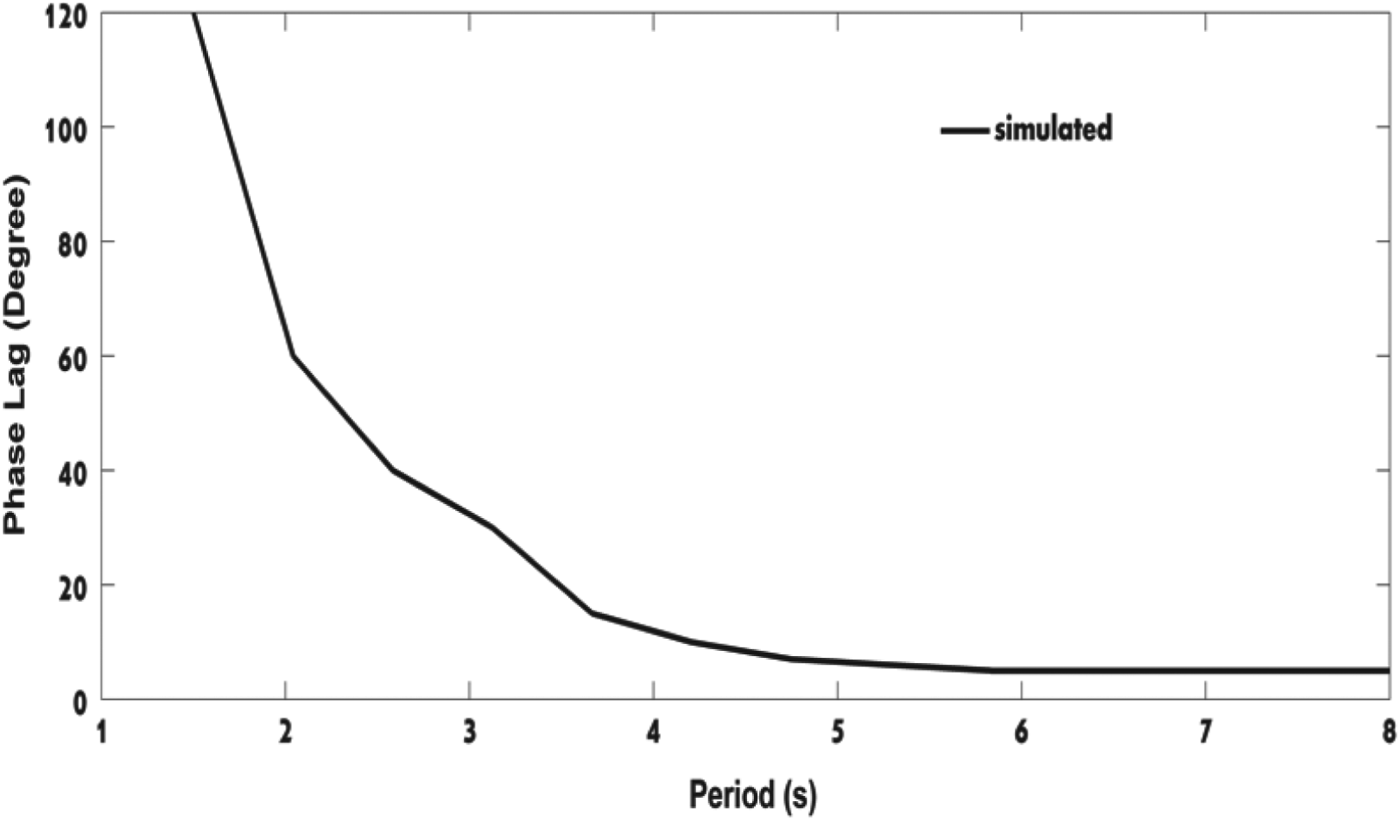
The greatest improvement of the phase lag can be achieved if a single longitudinal baffle is set along the centre line. Figure 6 indicates that the phase lag reduces to about 15 degrees while the period is 3·5 s if the other conditions remain unchanged. The external moment acquired by the ship can be greatly restrained. The simulations have revealed that the longitudinal baffles can effectively prevent the fluid from violently sloshing and reduce the phase lag as well. Regrettably we have been unable to validate this due to lack of a necessary equipment.
Figure 6. Phase lag, rectangular tank with a single centre longitudinal baffle, amplitude of the roll motion is 6°.
5. CONCLUSIONS
A numerical simulation methodology, using the Level Set Method for the sloshing motion of fluid in a rectangular tank has been developed. Predictions of the behaviours of the fluid sloshing have been made. The qualitative and quantitative results as free surface displacements and results as phase lags of the rolling motion with respect to the rolling axis have been presented. The following conclusions have been reached:
• Numerically simulated results obtained in this study have been validated by the real time experiments in situ. Good agreements have been achieved with the simulated results obtained in this paper compared to those obtained in the experiment.
• For a given excitation amplitude together with a sufficient liquid depth, the free surface displacement increases when the excitation frequency is less than the resonant frequency of the tank. However, the free surface displacement decreases when the excitation frequency is larger than the resonant frequency of the tank. It is noted that the maximum free surface displacement is generated under the circumstance for which the excitation frequency approaches the resonant frequency.
• The excitation amplitude and the excitation frequency have substantial effects on the impact pressure on the wall of the tank under investigation.
• The collapse of the shear resistance of the fluid or increasing heeling moment acquired from the fluid sloshing may account for the capsizing and sinking of the ship.
The simulations and experiment both show that fluid with viscosity, especially with high viscosity, can have a negative effect on the stability of ships under the circumstances of beam waves and winds. We believe it is therefore very possible that all bulk carriers with nickel ores have been lost as a result of the loss of stability after cargo shift with the moisture content above the safe limits recommended by the International Maritime Solid Bulk Cargoes (IMSBC) Code.