


1. INTRODUCTION
The ultimate goal of geodesy is to determine the position of a point on or near the Earth as precisely as possible (Plag et al., Reference Plag, Altamimi, Bettadpur, Beutler, Beyerle, Cazenave, Crossley, Donnellan, Forsberg, Gross, Hinderer, Komjathy, Ma, Mannucci, Noll, Nothnagel, Pavlis, Pearlman, Poli, Schreiber, Senior, Woodworth, Zerbini and Zuffada2009). A global reference frame can be realised by the development of space geodetic techniques such as Global Navigation Satellite Systems (GNSS), Very Long Baseline Interferometry (VLBI), and Satellite Laser Ranging (SLR) (Altamimi et al., Reference Altamimi, Collilieux and Meìtivier2011). The International Terrestrial Reference Frame (ITRF) consists of coordinates and velocities at reference stations (Rülke et al., Reference Rülke, Dietrich, Fritsche, Rothacher and Steigenberger2008). Since the first announcement of ITRF88, it has been continually renewed to enhance accuracy and consistency by adding an observation network and analysis techniques (Altamimi et al., Reference Altamimi, Angermann, Argus, Blewitt, Boucher, Chao, Drewes, Eanes, Feissel, Ferland, Herring, Holt, Johannson, Larson, Ma, Manning, Meertens, Nothnagel, Pavlis, Petit, Ray, Ries, Scherneck, Sillard and Watkins2001). The latest realisation (ITRF2014) was released in January 2016 (Altamimi et al., Reference Altamimi, Rebischung, Métivier and Collilieux2016). The difference between World Geodetic System 1984 (WGS84) and ITRF is at a level of only a few centimetres (ITRF, 2015). The International GNSS Service (IGS) also publishes a global reference frame, called IGS/IGbyy (yy represents a two-digit year) based only on GNSS networks (Ray et al., Reference Ray, Dong and Altamimi2004).
Until the land survey act was amended in December 2001, the Tokyo datum with Bessel ellipsoid was used as a national geodetic reference frame for Korea. Due to the local reference frame, surveying could not be conducted with the accuracy requested by users, and various problems arose in transforming the coordinates of Geographic Information Systems (GIS) and other applications (Kwon, Reference Kwon2012). The Korean government decided to introduce a global geodetic reference frame as a standard by revising Article 5 of the survey law, which was published to be the Korean Geodetic Datum of 2002 (KGD2002). It is based on the ITRF2000 and a static datum at a specific reference epoch (1 January 2002) with no consideration of crustal movement. The National Geographic Information Institute (NGII) of Korea, being in charge of the national geodetic datum, announced the updated results in 2002, 2008, and 2010 after the introduction of KGD2002. A new product was recently released to address the effect of the 2011 Tohoku earthquake on the Korean peninsula. Many previous studies show that the Korean peninsula is moving towards the southeast at a speed of approximately 3 cm per year (Cho et al., Reference Cho, Yun and Lee2011). In addition, it was reported that both the Korean peninsula and even some areas in China were influenced by the earthquake, and the tendency of the crustal movement changed when analysed by the United States Geological Survey (USGS) Finite Fault Model (FFM) (Kim and Bae, Reference Kim and Bae2012).
These continuous and/or discontinuous crustal movements accumulate over time, and can also cause a distortion of the geodetic network. Therefore, it is necessary to establish a geodetic reference frame that reflects these changes and assures continuity. However, the static datum, fixed to a specific epoch, makes it difficult to actively apply the crustal movements and the unpredictable sudden displacement. Several studies were conducted to make up for the drawbacks mentioned above. It was claimed that a dynamic reference frame should be introduced along with the estimation of velocity vector based on GNSS Continuously Operating Reference Station (CORS) data between 2000 and 2007. Sung et al. (Reference Sung, Yun, Hwang and Cho2012) used the Precise Point Positioning (PPP) technique to estimate the amount of crustal movement, and to develop an adjustment model based on results for more than ten years (2000·0 to 2011·5) of 14 GNSS CORS’ data. Some experimental GNSS CORS networks were configured to determine the best observing network of IGS stations in the Asia-Pacific region for monitoring crustal deformation patterns. In addition, based on the time series of GNSS processing results (2003–2008 and 2011·7–2013·5), the absolute velocity was calculated in order to analyse the crustal movement of the Korean peninsula after the earthquake (Ha et al., Reference Ha, Lee and Cho2013).
In this study, the local reference frame was determined by analysing continuous and/or discontinuous crustal movement of the Korean peninsula using NGII CORS data from 2007 to 2014 (total eight years). Based on this result, a new dynamic geodetic reference frame of Korea was proposed to resolve the previously mentioned problems in the local reference frame.
2. METHODOLOGY OF DATA PROCESSING
2.1. Data Collection
This study proposes a local geodetic reference frame by analysing continuous and/or discontinuous crustal movement including the effect of the 2011 Tohoku earthquake. To this end, we collected Receiver Independent Exchange format (RINEX) data at 30 second intervals from 54 permanent GNSS stations operated by NGII (http://gnss.ngii.go.kr). The period ranges from 2007 to 2014, which covers four years before and after the earthquake. Figure 1 shows the location of domestic CORS stations used in this research.

Figure 1. Location of the domestic GNSS CORS used in this research. The stations were categorised by the historic transition.
A minimum of three IGS stations are necessary to connect the calculated local reference network to a global geodetic reference frame such as ITRF. Although more stations are desirable for reliability and stability, a suitable number of stations can be involved for the efficiency of the computation. According to Hu (Reference Hu2009), at most 2 mm of difference is claimed for different numbers of stations used in the calculation of the transformation parameters. It was demonstrated that different sets of reference stations barely affect the resulting coordinates (Tregoning and Jackson, Reference Tregoning and Jackson1999). As a result, a total of 12 IGS stations were chosen as control points in case of missing RINEX files and/or inconsistency for Helmert transformation. Four selection criteria are suggested in this study as follows:
-
• Evenly distributed, within the GNSS network as well as the surrounding area, in terms of geometry
-
• Both Global Positioning System (GPS) and GLONASS observations are available (at least as of 2015)
-
• Fully consistent with IGb08 reference frame in Helmert transformation
-
• Being in operation with stability for at least three years
The candidate stations were not restricted to the Korean peninsula since longer baseline lengths produce the best possible ambiguity resolution. Consequently, the reference stations are distributed throughout the globe; China (BJFS, LHAZ), Australia (DARW, TOW2), North America (GOLD, STJO), Europe (HERT, MAS1, MATE, TIXI, TLSE), and Africa (NKLG). For the spatial distribution of the stations, see Figure 2.
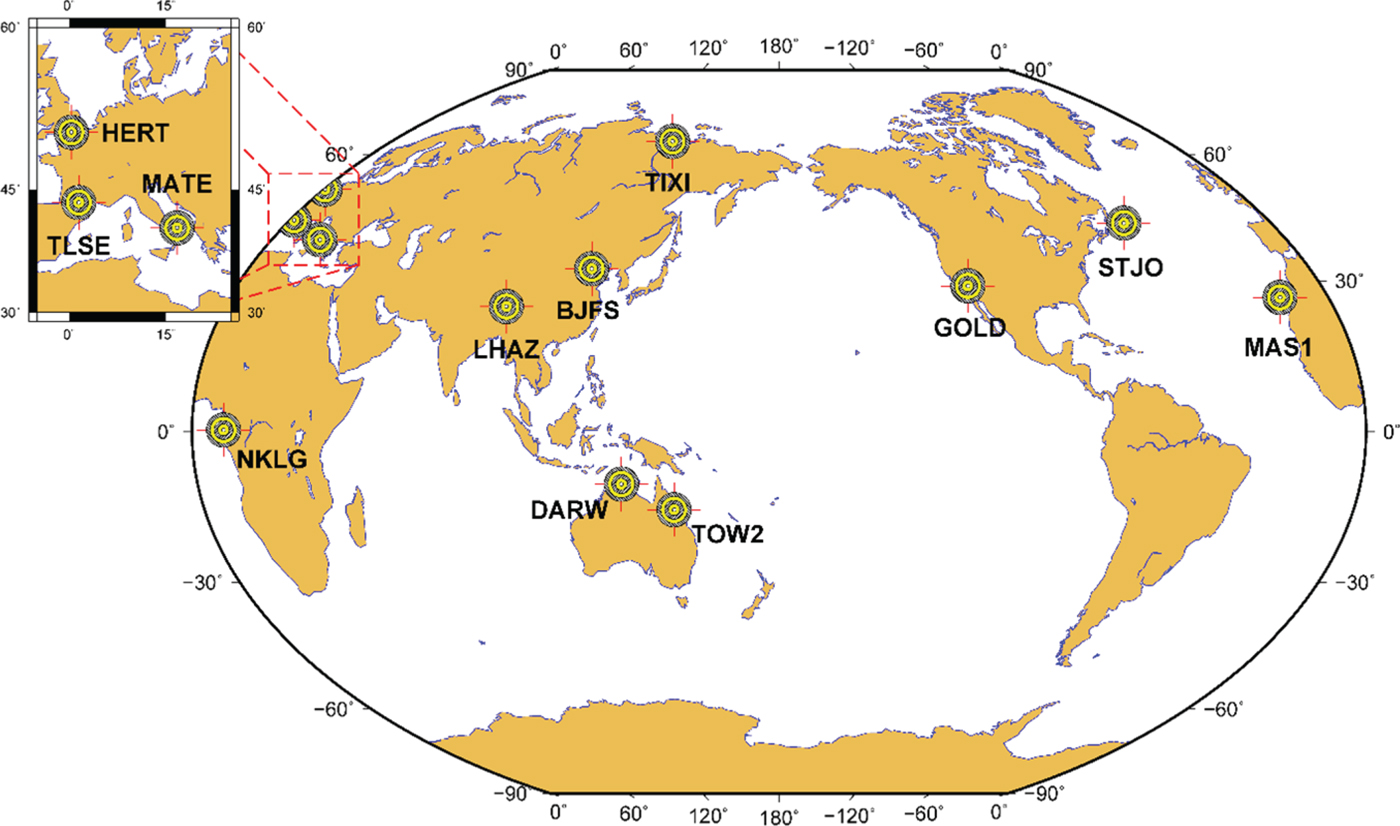
Figure 2. Location of IGS stations used in this study. Four selection criteria were applied.
To minimise the errors in the GNSS observables, several external information files (e.g., precise orbit/clock, Earth Orientation Parameters (EOPs), global ionospheric model, etc.) were downloaded from the Crustal Dynamics Data Information System (CDDIS) and the Centre for Orbit Determination in Europe (CODE). The ocean tide model, FES2004, was obtained from Onsala Space Observatory.
2.2. Data Processing
A differential GNSS data processing technique was applied with constraints at known stations for high accuracy positioning at the millimetre level. For an efficient analysis of the crustal movements in the Korean peninsula, two scenarios were devised; Scenario 1 constraining IGS permanent stations to confirm the plate motion of the entire Korean peninsula and Scenario 2 constraining SUWN (a reference station for the Korean datum) to effectively identify the geodetic distortion within the local network. The global terrestrial reference frame (IGb08) was used for Scenario 1 along with the velocity information, and the local reference frame for Scenario 2. Since only minor updates are available for discontinuous stations, it is not necessary to transform IGb08 into IGS08 reference frames (or vice versa) (Rebischung, Reference Rebischung2012). In addition, both IGS05 and IGS08 adopt the same EOPs to transform between the Terrestrial Reference Frame (TRF) and the Celestial Reference Frame (CRF) (Ray, Reference Ray2011). Therefore, several millimetres of difference between reference frames can be cancelled out during differential GNSS processing for long data spans.
Bernese GNSS Software V5.2 (hereafter Bernese) was used for precise baseline processing, which is known to have a capability of fixing ambiguities for baseline lengths up to 2,000 km (Dach et al., Reference Dach, Simon, Walser and Fridez2015). Figure 3 shows a schematic diagram of data processing used in this study, which is generally adopted by many GNSS applications. On top of typical processing, an additional process was applied to constrain the local reference frame based on the Korean reference station.

Figure 3. Schematic diagram of typical data processing using Bernese GNSS Software.
3. ANALYSIS OF THE PROCESSING RESULTS
3.1. A Continuous Movement of the Plate
A total of 2,921 daily solutions (Cartesian coordinates at noon each day) were obtained for 54 stations between 2007 and 2014 by constraining the IGS stations. Figure 4 shows the horizontal and vertical components (North, East, and Up) of SUWN and CHJU, where CHJU is the farthest station from the origin of Korean geodetic datum (SUWN). It can be shown that both stations are apparently moving in a southeast direction at a rate of about 3 cm per year. On the other hand, the vertical component does not show any particular tendency except with larger variations, which is typical behavior of GNSS data processing.

Figure 4. Time series plot by fixing IGS stations (Scenario 1): (a) SUWN; (b) CHJU. The grey dots represent the outliers of the daily solutions.
A sudden break in horizontal components near March 2011 (denoted as ② in the figures) was commonly observed for all 54 stations, which is the effect of the Tohoku earthquake with a magnitude of 9·0. An extensive analysis was conducted for the discontinuity by the earthquake, and is explained in detail in the following sections.
To identify any internal distortion within the peninsula, the second scenario was analysed as well by constraining one of the CORS in Korea. As can be seen in Figure 5, two cases of time series are plotted in the local coordinate system; CHJU makes up the longest baseline with respect to the constrained station (Figure 5(a)), and BOEN represents the vertical displacement from the antenna change (Figure 5(b)). Since the differential processing technique was applied in this study, there should be no displacement during the entire period without a distortion inside the plate. Except the minor effect by the earthquake in 2011, CHJU moves southward continuously although the magnitude is not large. In the end, the crustal movement is not uniform for the entire peninsula, and the long-term movement should be considered to prevent the geodetic distortion of the network. The vertical displacements of BOEN, denoted as ③, ④, and ⑤ in the figure, represent the changes of the Antenna Reference Point (ARP) by +4·9 cm, -7·0 cm, and -4·9 cm, respectively. The antenna replacements, including physical shift of the ARP, should be immediately announced for the integrity of the geodetic reference frame.

Figure 5. Time series plot of domestic GNSS permanent stations used in this research (Scenario 2). The grey dots represent the outliers of the daily solutions.
3.2. A Discontinuity due to the Earthquake
A massive earthquake with a magnitude of 9·0 occurred in the northeast of Japan on 11 March 2011 (14:46 local time). The time series analysis shows that all stations experienced a discontinuity from the earthquake, thus it is necessary to investigate the displacement of each station. The coordinate differences before (mean coordinates of 8–10 March) and after (mean coordinates of 12–21 March) the earthquake are summarised in Table 1 (also in terms of local coordinate system). Observations on the day of the earthquake were excluded because it was in the middle of the displacement. Two additional stations, DOKD and ULLE, were also processed because these are the closest stations in Korea to the epicentre.
Table 1. Displacement of each station before and after the earthquake [unit: cm].

The Kriging technique was used to interpolate horizontal displacement in the Korean peninsula based on the estimated coordinates at each station (Figure 6). In Scenario 1, the three-dimensional displacements from the Tohoku earthquake range between 1·7–5·9 cm (2·9 cm on average), and the east-west direction accounts for most of the displacements (about 2·6 cm). The annual movement of the Korean peninsula was calculated to be about 3 cm using three IGS stations in Korea (SUWN, DAEJ, and OSN1) (Freymueller, Reference Freymueller2011). This means that the abrupt displacement occurred due to the earthquake corresponds to the usual change for one year. As can been in Figure 6(a), the displacement is clearly dependent on the distance to the epicentre with a predominantly north-eastern direction. Figure 6(b) shows a relative displacement inside the Korean peninsula with respect to SUWN. Interestingly enough, the directions for the relative displacement are opposite from the centreline at 45° (northwest to southeast). It can be assumed that an internal distortion had occurred with different magnitudes and directions.
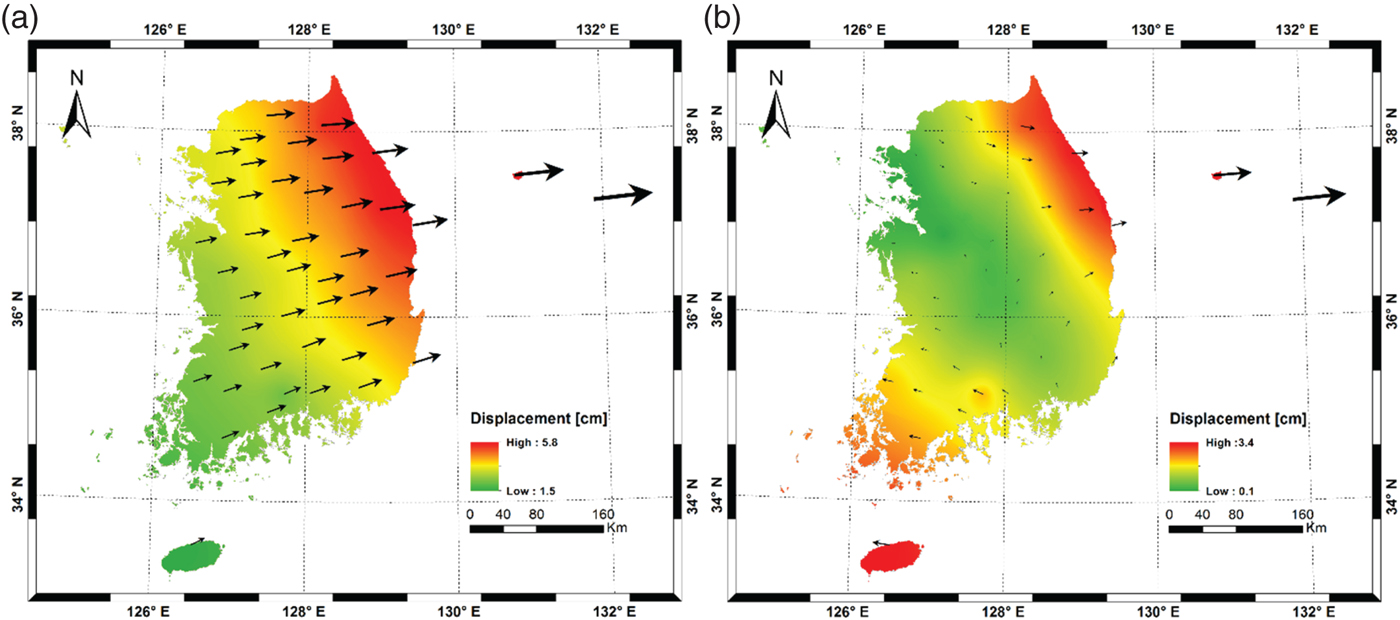
Figure 6. Displacement of the stations in Korea by the earthquake: (a) Scenario 1 (IGS fixed); (b) Scenario 2 (SUWN fixed). The arrows represent the magnitude and direction of the displacement.
The distortion may have resulted from the fact that the earthquake effect was different according to the distances to the epicentre, which was analysed in detail in this study. Figure 7 shows the relationship between the displacement and the distance to the epicentre (38·297°N, 142·372°E) in the local coordinate system. Only the east component shows an explicit distance-dependent behaviour for both scenarios, which is the exponential model in common. The resulting Root Mean Squared Errors (RMSEs) are 0·22 cm and 0·26 cm for Scenarios 1 and 2, respectively.
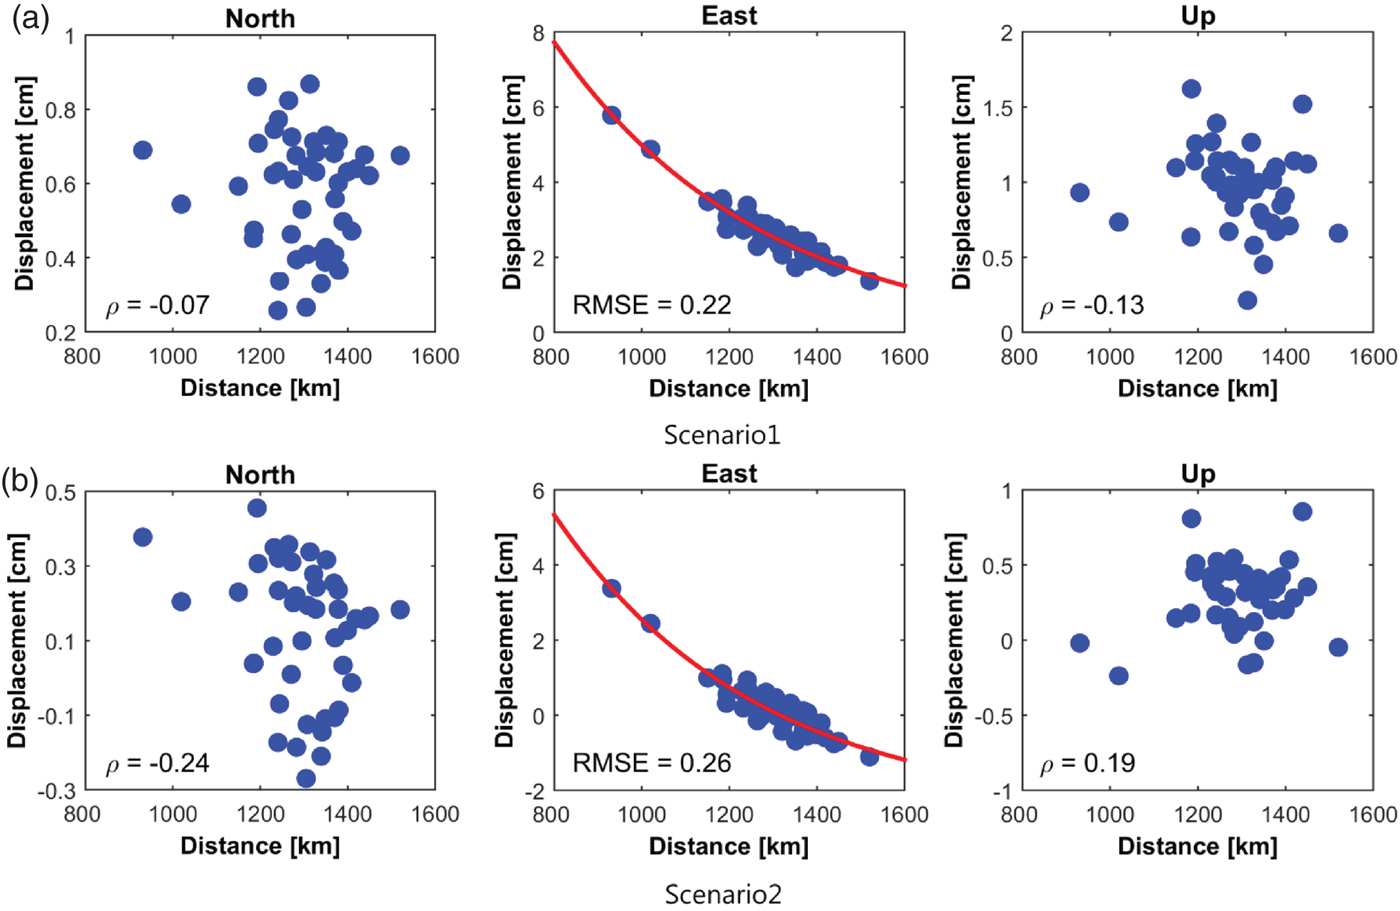
Figure 7. Correlation coefficient between the magnitude of the displacement and the distance from the epicentre in NEU frame: (a) Scenario 1 (IGS fixed); (b) Scenario 2 (SUWN fixed). The resulting RMSE of the residuals for the exponential model was denoted in the east component.
4. LOCAL GEODETIC DATUM
4.1. Establishment of a Local Geodetic Datum
A total of eight years (2007 to 2014) of daily solutions were estimated to establish a dynamic local geodetic datum of Korea. The period was evenly distributed before and after the earthquake. As mentioned above, the effect of the earthquake was to cause displacement in one day that equalled the average annual displacement. However, the pattern of distortion is not uniform within the Korean peninsula depending on the distance to the epicentre. Since it is impossible to establish a unique local geodetic datum throughout the earthquake, the final solutions were estimated separately before and after the earthquake.
For the determination of the final local geodetic datum, stations with stable solutions were selected among the 54 stations within the study area. The stability of the station is based on the time series of daily/weekly solutions as well as the discontinuity due to antenna replacement or relocation of the stations. The resulting 13 stations were distributed evenly in the southern part of the Korean peninsula (Figure 1), which is considered to be appropriate to establish the national geodetic datum.
Twelve IGS stations were used as a reference in the data processing. Stability analysis for these stations was conducted by constraining all stations to produce the preliminary solution. Then this solution was compared with the IGb08 reference frame through Helmert transformation with the criteria of 10 mm and 30 mm for horizontal and vertical components, respectively. A total of five stations were eliminated due to instability of solutions in the time series; three stations (DARW, LHAZ, NKLG) before the earthquake, and two stations (TIXI, TOW2) after the earthquake (Table 2).
Table 2. Residuals of Helmert transformation. Five stations were eliminated due to large residuals (flagged “R”).

Table 3 shows the estimated velocity of 13 core stations in Korea before and after the earthquake. Scenario 1 (IGS constrained) represents the velocity in a global reference frame, while the velocity of Scenario 2 refers to a relative movement. The velocity maps for both scenarios were plotted using the Kriging method in Figures 8 and 9, respectively. As can be seen in the figures, the movement in Scenario 1 was increased by several millimetres after the earthquake with similar directions. The pattern of the velocity was also changed, that is, the maximum velocity was observed in the southernmost area before the earthquake but changed to the north-eastern area after the earthquake. This is because there were irregular distortions in the Korean peninsula from the 2011 Tohoku earthquake, and the north-eastern part was affected more than other areas. On the other hand, Scenario 2 (SUWN constrained) shows similar results but with increased velocity after the earthquake. Therefore, it is necessary to monitor the crustal motion regularly and update the geodetic datum accordingly.
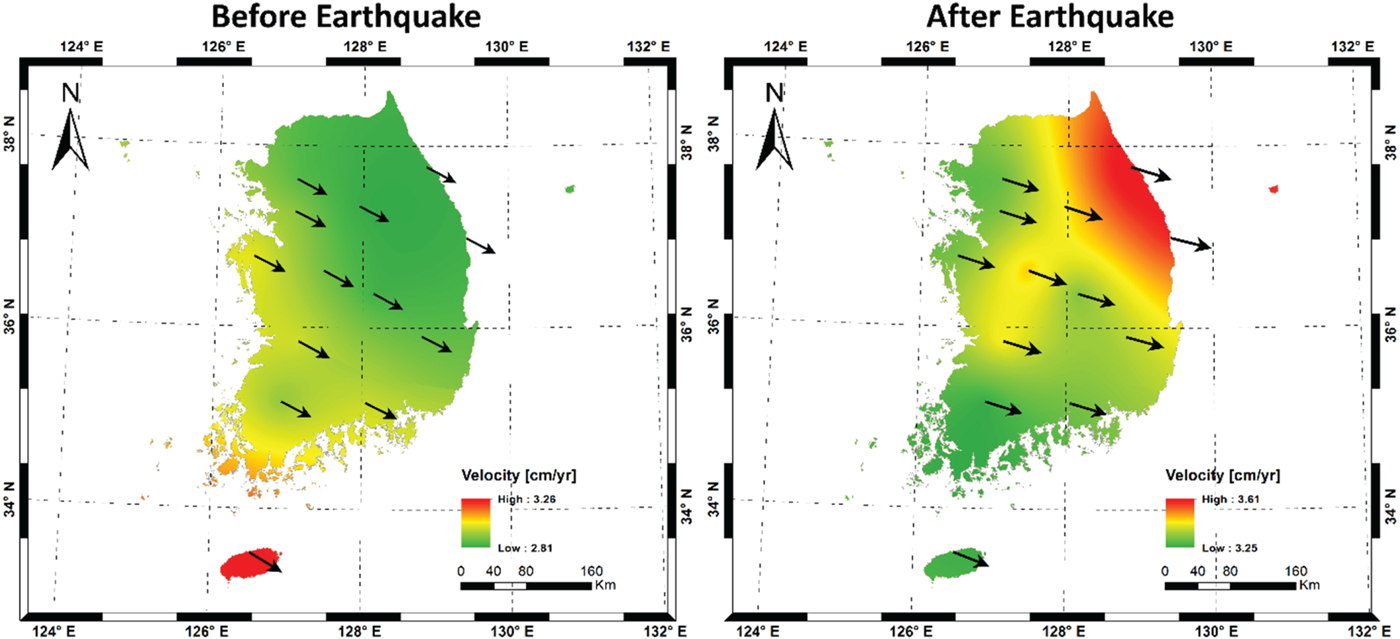
Figure 8. Average velocity of Korean peninsula interpolated by Kriging (IGS constrained, Scenario 1).
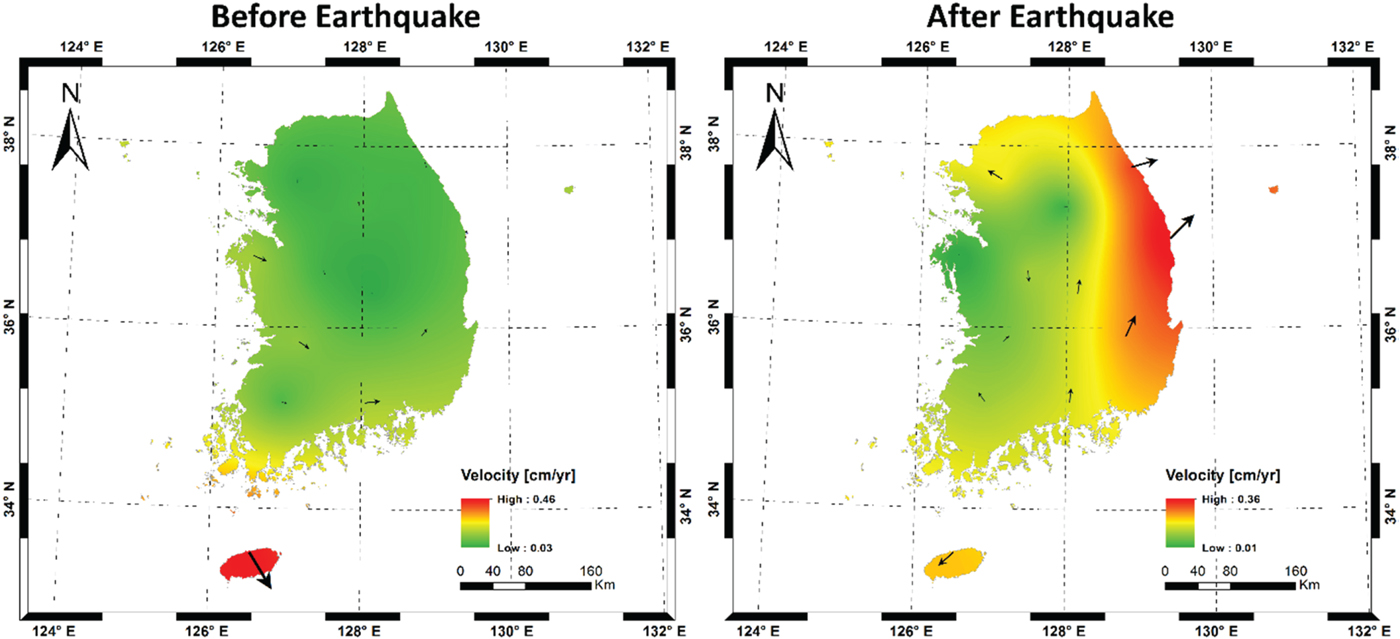
Figure 9. Average velocity of the Korean peninsula interpolated by Kriging (SUWN constrained, Scenario 2).
Table 3. Estimated final velocity for two scenarios before and after the earthquake [unit: cm/yr].

Based on the final coordinates from constraining the IGS stations, we suggest two datums that are separated by the epoch 2011·2 as new local reference frames reflecting crustal movement. The datums were designated as KGD2015A (before the earthquake) and KGD2015B (after the earthquake) in this study, and they consist of coordinates, velocities, and offsets with respect to KGD2002.
4.2. Transformation Model
The continuity of the datum is the most important factor for the stability of local geodetic datum, especially for the case of an unexpected earthquake. The current Korean geodetic datum, KGD2002, is a static datum that does not provide the velocity information (reference origin at 1 January 2002). However, the newly suggested KGD2015A/B is a dynamic datum that takes account of before (KGD2015A) and after (KGD2015B) the earthquake separately. The transformation between geodetic datums is generally conducted by the Helmert method that adopts seven parameters, that is, translation (three), scale (one), and orientation (three). For the purpose of this study, this requires modifying the Helmert transformation to accommodate the Korean situation.
Figure 10 represents the transformation process between geodetic datums, suggested in this study. In order to transform KGD2015A/B into KGD2002, a total of 14 transformation parameters were calculated, with both the transformation parameters and their rates with respect to KGD2002. Only seven parameters were set up in the case of transformation between KGD2015A and KGD2015B. The transformation between KGD2015A/B and KGD2002 was conducted through a three-step process with a total of 14 parameters (red and blue arrows in Figure 10). At first, the coordinates of KGD2015A/B at epoch (t) are shifted to the 2002·0 (t_0) epoch using each station's velocity. Secondly, the offsets with respect to KGD2002 were applied to the coordinates at 2002·0. The first and the second processes can be represented by Equation (1). Finally, the transformation was conducted through Equations (2) and (3). The final model consists of seven parameters along with their rates (total 14 parameters).
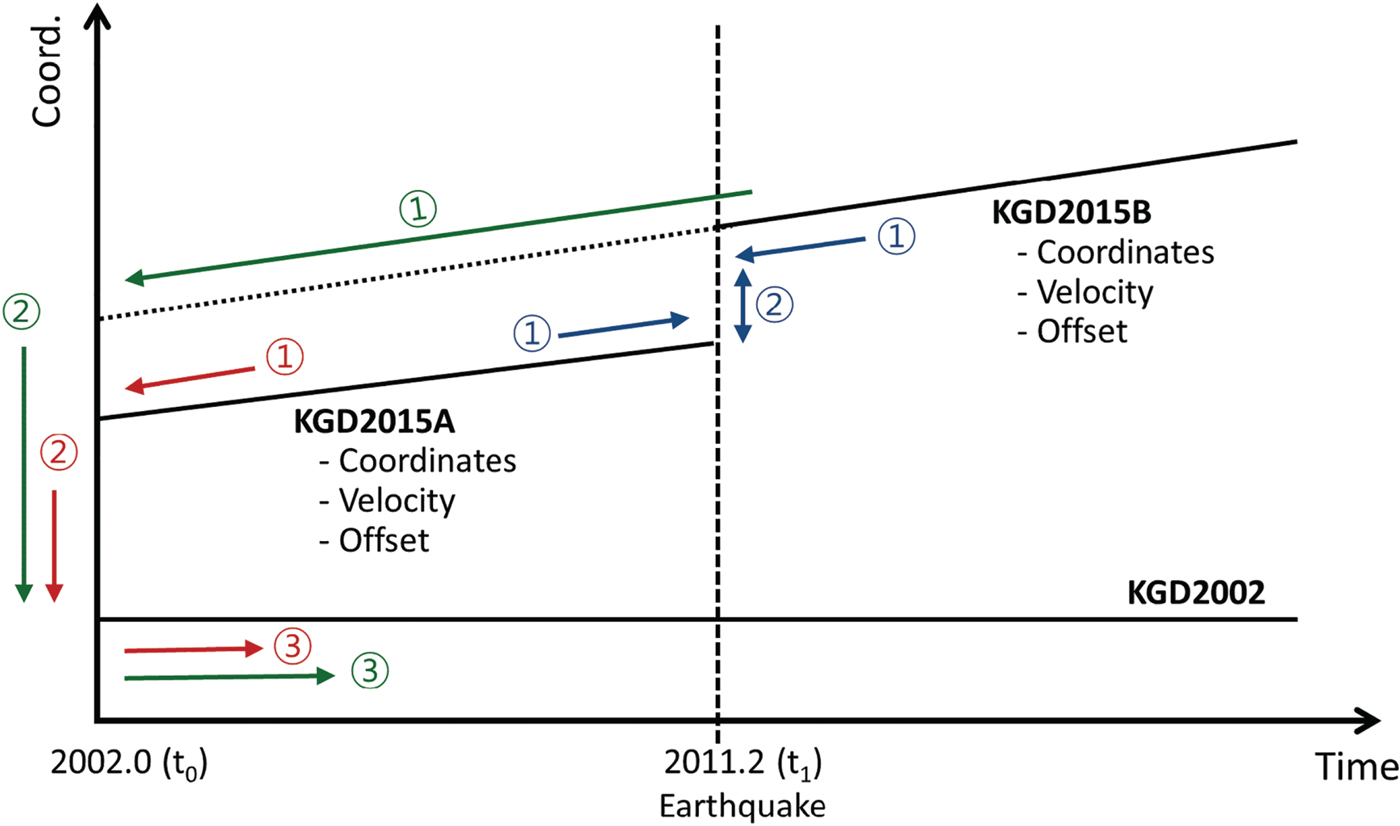
Figure 10. Schematic diagram of datum transformation. Red and green arrows indicate transformation from KGD2015A/B to KGD2002: ① calculate coordinates at 2002·0 with velocities ② apply the offset ③ transform coordinates with 14 parameters. Blue arrows indicate transformation from KGD2015A to KGD2015B: ① calculate coordinates at 2011·2 (t 1) with velocities ② transform coordinates with seven Helmert parameters.
 $$\left[\matrix{ x_{2015} \cr y_{2015} \cr z_{2015} } \right]_{@2002{\cdot}0} = \left[\matrix{ x_{2015} \cr y_{2015} \cr z_{2015} } \right] - \left[\matrix{ v_{x} (t - t_0) \cr v_{y} (t - t_0) \cr v_{z} (t - t_0) } \right] - \left[\matrix{ offset_{x} \cr offset_{y} \cr offset_{z} } \right]$$
 $$\eqalign{ \left[\matrix{ x_{2002} \cr y_{2002} \cr z_{2002} } \right]_{@2002{\cdot}0} &= \left[\matrix{ x_{2015} \cr y_{2015} \cr z_{2015} } \right]_{@2002{\cdot}0} + \left[\matrix{ T_x + \dot{T}_x (t - t_0) \cr T_y + \dot{T}_y (t - t_0) \cr T_z + \dot{T}_z (t - t_0) } \right] \cr &+ (D + \dot{D} (t - t_0)) \left[\matrix{ x_{2015} \cr y_{2015} \cr z_{2015} } \right]_{@2002{\cdot}0} + \tilde{R} \left[\matrix{ x_{2015} \cr y_{2015} \cr z_{2015} } \right]_{@2002{\cdot}0}}$$
where
 $\tilde R$
is given by
$\tilde R$
is given by
 $$\left[\matrix{ 0 &-(R_z + \dot{R}_z (t - t_0)) &- R_y + \dot{R}_y (t - t_0) \cr R_z + \dot{R}_z (t - t_0) &0 &-(R_x + \dot{R}_x (t - t_0)) \cr -(R_y + \dot{R}_y (t - t_0)) & R_x + \dot{R}_x (t - t_0) &0 } \right].$$
For the terms in the above equations,
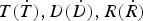 $T (\dot{T}), D (\dot{D}), R (\dot{R})$
represent the translation, scale, and the rotation angle and their rates, respectively, with the components in subscript; t
0 represents the reference epoch (2002·0).
$T (\dot{T}), D (\dot{D}), R (\dot{R})$
represent the translation, scale, and the rotation angle and their rates, respectively, with the components in subscript; t
0 represents the reference epoch (2002·0).
Even though Equations (1) and (2) were used, it is impossible to allow for the continuity of the suggested national reference frames, KGD2015A/B, because of the crustal movement by the earthquake. Thus, we adapted the second model that connects KGD2015A and KGD2015B (see blue arrows in Figure 10). We carried out a time shift step of KGD2015A/B as Equation (4), and subsequently, the conversion between both datums was performed using seven Helmert parameters (Equation (5)). The estimated transformation parameters between solutions are summarised in Table 4.
Table 4. The final transformation parameters. The units are [cm], [cm/y] for translation, [ppb], [ppb/y] for scale, and [mas], [mas/y] for rotation.

 $$\left[\matrix{ x_{2015 A/B} \cr y_{2015 A/B} \cr z_{2015 A/B} }\right]_{@2011{\cdot}2} = \left[\matrix{ x_{2015 A/B} \cr y_{2015 A/B} \cr z_{2015 A/B} } \right] - \left[\matrix{ v_{x} (t - t_1) \cr v_{y} (t - t_1) \cr v_{z} (t - t_1) }\right],$$
 $$\eqalign{ \left[\matrix{ x_{2015 B} \cr y_{2015 B} \cr z_{2015 B} } \right]_{@2011{\cdot}2} &= \left[\matrix{ x_{2015 A} + T_x \cr y_{2015 A} + T_y \cr z_{2015 A} + T_z } \right]_{@2011{\cdot}2} + D \left[\matrix{ x_{2015 A} \cr y_{2015 A} \cr z_{2015 A} } \right]_{@2011{\cdot}2} \cr &+ \left[\matrix{ 0 &-R_z & R_y \cr R_z &0 &-R_x \cr -R_y & R_x &0 } \right] \left[\matrix{ x_{2015 A} \cr y_{2015 A} \cr z_{2015 A} } \right]_{@2011{\cdot}2}}$$
Finally, based on Equation (4) and Table 4, the daily solutions for 13 stations were transformed into KGD2002, and then compared with the published coordinates of KGD2002 in order to check the validity of the suggested model. As a result, the RMSEs of each component were determined to be better than a centimetre, given the deviation of daily solutions (Table 5). In other words, this means that the proposed model can reasonably consider continuous and discontinuous movement of the Korean peninsula.
Table 5. RMSE of the residuals of the transformed coordinates.

Figure 11 shows the difference between current published coordinates and the transformed results from daily solutions. Most of the stations have residuals in the relatively small range of about ±2 cm, thus this model is considered suitable for stations in Korea.

Figure 11. Residuals between transformed coordinates and the published KGD2002 after removing the trend.
5. SUMMARY AND CONCLUSIONS
The objective of this study is to propose a dynamic local reference frame involving continuous and discontinuous diastrophism for analysing local plate motions. To attain this goal, the database between 2007 and 2014 was set up for 54 permanent stations, and then 12 stations operated by IGS were selected as references. After an extensive baseline analysis based on GNSS data, the following conclusions can be summarised:
-
(1) To verify the annual movement of the Korean peninsula, eight years of daily solutions were produced. Additionally, by using the SUWN station as reference, the distortion within the Korean peninsula was noted and analysed in this study.
-
(2) Precise analysis on the effect of the Tohoku earthquake was conducted for discontinuous crustal movement. The result shows that the Korean peninsula is in the bounds of the influence by the earthquake and the amount is about 2·88 cm on average towards the east. In addition, the size of the displacement is different depending on the distance to the epicentre, thus it is concluded that distortion within the Korean peninsula occurred because of the earthquake.
-
(3) By accumulating daily solutions before and after the earthquake, the geodetic coordinates and velocities of each station were calculated for the whole period of this study. Prior to estimating the final solution, the stability analysis at the 12 reference stations was implemented through Helmert transformation. A total of five stations were determined to be unstable, resulting in elimination from the final solution.
-
(4) Based on the final solution (IGS stations constrained), we proposed two datums that are separated at epoch 2011·2, which was designated as KGD2015A (before earthquake) and KGD2015B (after earthquake), and they are consistent in coordinates, velocities and offsets with KGD2002.
-
(5) A customised transformation model was suggested to maintain the continuity of the Korean Geodetic Datum. This model includes the conventional Helmert parameters as well as their rates, and the discontinuity. To assess the validity of the suggested model, the estimated daily solutions were converted to KGD2002 at epoch 2002·0. The result shows that the RMSE of each component were determined to be better than a centimetre, therefore the proposed model can accurately assess the continuous and discontinuous movement of the Korean peninsula.
The first ITRF model that estimates seasonal signals and models post-seismic deformation (ITRF2014) was released in January 2016, and the IGS adopted a new reference frame called IGS14 that is closely related to ITRF2014 beginning GPS week 1934 (29 January 2017) (Rebischung et al., Reference Rebischung, Schmid and Herring2016). Since most of local geodetic datum is dominantly maintained by GNSS, it is necessary to analyse the seasonal variation and possible post-seismic deformation in the local area based on a new IGS reference frame in further study.
6. FINANCIAL SUPPORT
This research was supported by a grant (16RDRP-B076564-03) from Regional Development Research Program funded by Ministry of Land, Infrastructure and Transport of Korean government.


