1. INTRODUCTION
Measuring small absolute displacements of the seafloor (<10 m) in the deep ocean is challenging since doing so requires a combination of acoustic measurements with measurements of a moving platform (Burgmann and Chadwell, Reference Bürgmann and Chadwell2014). Advancements have allowed seafloor geodetic surveys to be performed with increasing frequency in recent years (Tadokoro et al., Reference Tadokoro, Ikuta, Watanabe, Ando, Okuda, Nagai, Yasuda and Sakata2012; Yokota et al., Reference Yokota, Ishikawa, Sato, Watanabe, Saito, Ujihara, Matsumoto, Toyama, Fujita, Yabuki, Mochizuki and Asada2015; Reference Yokota, Ishikawa, Watanabe, Tashiro and Asada2016; Yasuda et al., Reference Yasuda, Tadokoro, Taniguchi, Kimura and Matsuhiro2017). However, geodetic methods such as Global Positioning System (GPS)-Acoustic (Spiess et al., Reference Spiess, Chadwell, Hildebrand, Young, Purcell and Dragert1998; Asada and Yabuki, Reference Asada and Yabuki2001; Fujita et al., Reference Fujita, Ishikawa, Mochizuki, Sato, Toyama, Katayama, Matsumoto, Yabuki, Asada and Colombo2006) rely on positioning points on the seafloor relative to a research platform and thus could be limited by the quality of GPS navigation used to constrain the platform location.
Most seafloor geodetic studies obtain a real-time kinematic solution from shipboard GPS stations, utilising land stations as references. However, in remote regions this may not be feasible or require creative workarounds, such as the temporary deployment of land stations (for example, Gagnon et al., Reference Gagnon, Chadwell and Norabuena2005). An alternative is to post-process navigation data collected at sea using Precise Point Positioning (PPP). PPP relies on clock and orbit solutions obtained from pre-existing networks to individually process remote stations (Zumberge et al., Reference Zumberge, Heflin, Jefferson, Watkins and Webb1997). Since PPP does not require proximity to a land reference station to obtain a solution, it is well suited to marine surveys that may be hundreds of kilometres offshore.
Shipboard campaign GPS receivers have been repeatedly shown to be accurate enough to measure precipitable water vapour, either after processing with respect to nearby land stations (Chadwell and Bock; Reference Chadwell and Bock2001; Kealy et al., Reference Kealy, Foster and Businger2012) or PPP (Rocken et al., Reference Rocken, Johnson, Van Hove and Iwabuchi2005). These studies show Root Mean Square (RMS) errors in the order of 10 cm in the vertical GPS component. Likewise, Foster et al. (Reference Foster, Li and Cheung2014) estimated a horizontal precision of shipboard GPS in the order of 7 cm derived from baseline measurements between GPS stations. Most recently, Watanabe et al. (Reference Watanabe, Bock, Chadwell, Fang and Geng2016) estimated horizontal PPP errors to be in the order of 2 cm at sea.
However, these studies do not consider GPS data collected by the standard dual-frequency GPS systems deployed on University-National Oceanographic Laboratory System (UNOLS) vessels. Multiple UNOLS vessels such as the Research Vessel (RV) Roger Revelle and the RV Sally Ride now employ a Kongsberg Seapath 330+ for dual frequency ship navigation. Data from these systems should yield ship locations of comparable quality to campaign GPS stations.
The focus of this study was to evaluate the absolute accuracy that a ship can be positioned in a remote ocean location using a standard dual-frequency receiver and standard PPP processing. In doing so, we estimated the uncertainties introduced by a number of noise sources, including difficulties in locking onto low elevation satellites due to the roll and pitch of the vessel, and multipath reflections from large surfaces on the ship. We also verified any dependence on processing strategy or software. This was accomplished by using three PPP software packages to evaluate GPS data from two experiments: a known fixed position to establish a baseline accuracy of the PPP software packages and a remote moving platform to explore the uncertainties introduced by the noise sources previously declared. The PPP software packages used are the Kalman Filter solver in Positioning and Navigation Data Analyst (PANDA) (Shi et al., Reference Shi, Zhao, Geng, Lou, Ge and Liu2008) processed using the methodology described by Geng et al. (Reference Geng, Bock, Melgar, Crowell and Haase2013), Global Navigation Satellite system (GNSS)-Inferred Positioning System and Orbit Analysis Simulation Software (GIPSY-OASIS) (Zumberge et al., Reference Zumberge, Heflin, Jefferson, Watkins and Webb1997; Bertiger et al., Reference Bertiger, Desai, Haines, Harvey, Moore, Owen and Weiss2010), and the Canadian Spatial Reference System (CSRS, 2016).
2. ALEUTIAN ISLAND STATION AB21
The first experiment was designed to evaluate the absolute accuracy of the three PPP software packages using continuously recorded GPS data from a fixed remote island location. The station we chose was station AB21 on the Aleutian Islands. This station is appropriate to compare to ship navigation because it is not used to generate International Global Navigation Satellite System Service (IGS) clocks and orbits, is in a very remote location 1,675 km from the nearest IGS network station, has a long (over ten years) time series of daily solutions, and periods of high-rate data collection at a one second intervals that is comparable to the data collected by ship navigation. We processed data collected from 16 June 2014 to 18 June 2014, a subsection of the most recent month during which high-rate data was collected at this station and during a period in which there were no significant earthquakes or aftershocks in the region. The position accuracies during this time derived from the Scripps Orbit and Permanent Array Center (SOPAC) are 3 mm in the horizontal components and 8 mm in the vertical component.
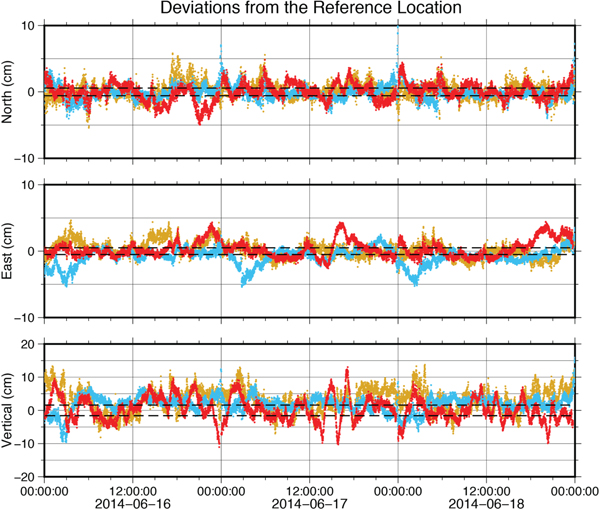
We generated kinematic PPP solutions for land station AB21 high-rate data using the PANDA, GIPSY and CSRS software. Solution accuracy is judged against the SOPAC daily solution (Figure 1, Table 1). We found the three kinematic solutions agree with the SOPAC daily solution with 2σ standard deviations of 1·1–1·3 cm in the East and North components and around 2·3–3·5 cm in the vertical component.
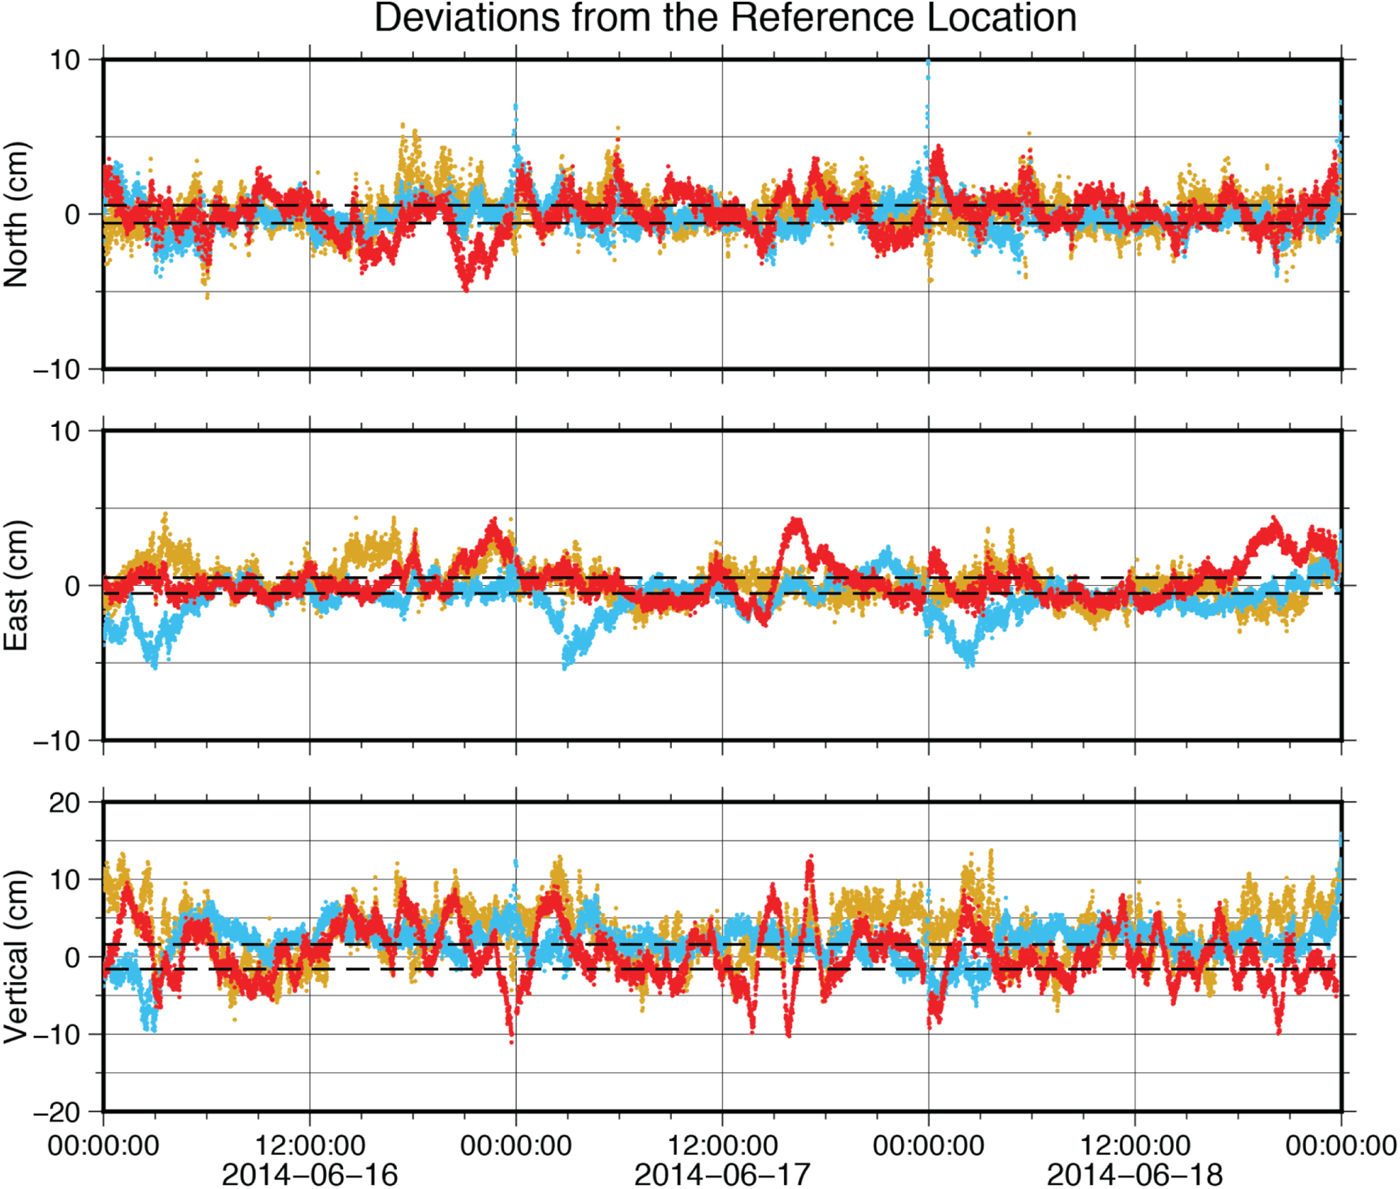
Figure 1. Kinematic solutions for station AB21, plotted as differences relative to the SOPAC daily solution. The red time series is the PANDA solution, the blue time series is the CSRS solution and the gold time series is the GIPSY solution. Dashed lines show 2σ uncertainties for the SOPAC daily solution.
Table 1. Locations of station AB21 obtained by averaging kinematic time series. SOPAC daily solution is the reference point. 2σ standard deviations are reported as errors.
3. RR1605 STATION ANALYSIS
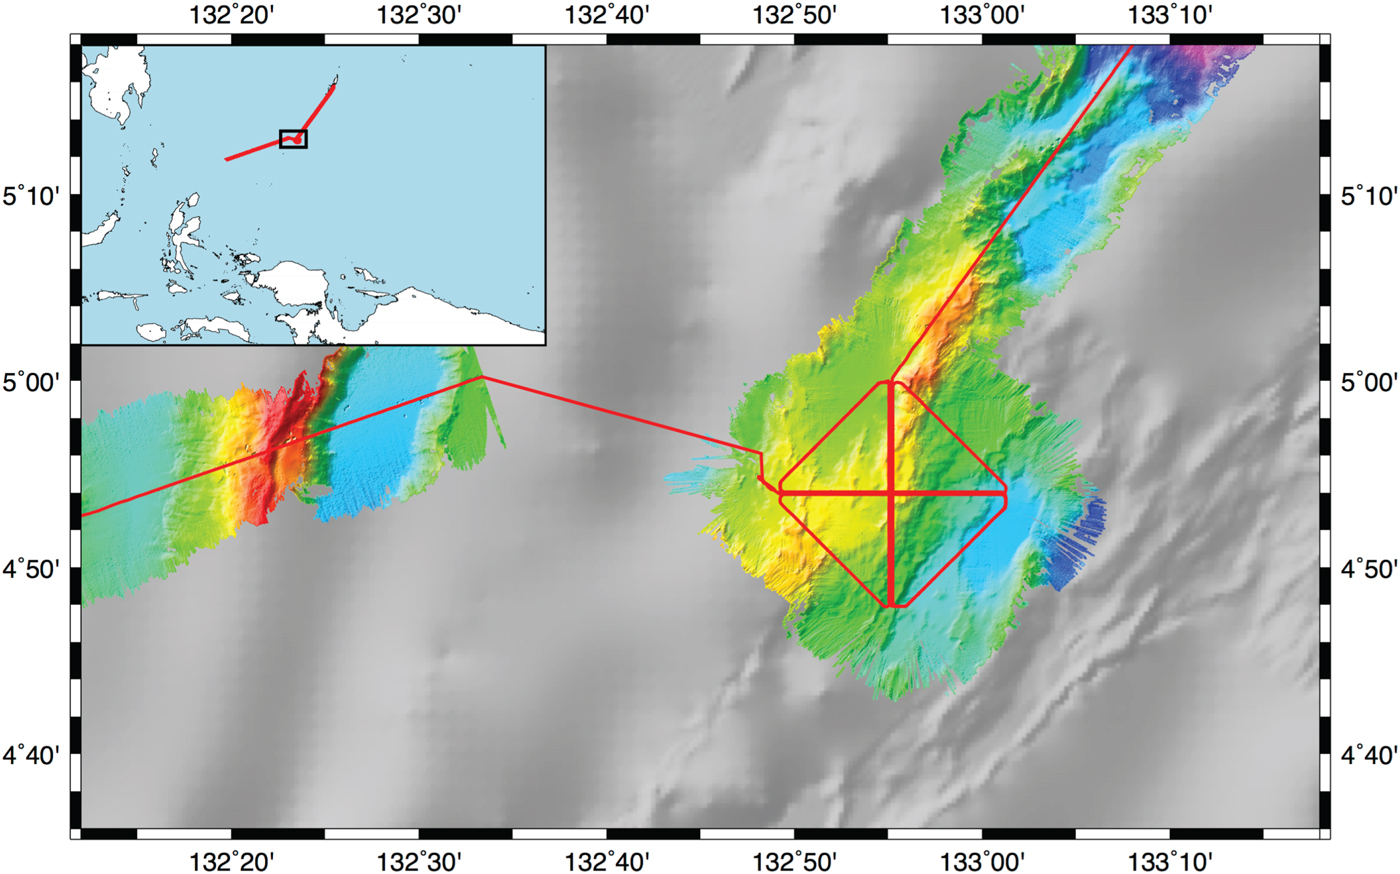
We assessed the accuracy of PPP positions at sea using data collected on board the RV Roger Revelle during the RR1605 cruise in May 2016. The cruise objective was to determine how accurately a patch of seafloor could be positioned using repeated sonar data (DeSanto et al., Reference DeSanto, Sandwell and Chadwell2016), and contains multiple repeated tracks arranged in a 12 nautical mile by 12 nautical mile cross pattern. The survey area was a patch of seafloor above the Ayu Trough approximately 330 km southwest of the island nation of Palau, 870 km East of the Philippines, and 550 km north of Papua New Guinea (Figure 2). We chose this region because the Ayu Trough is a very slow spreading area, centred between the Caroline Sea Plate and the Philippine Plate. Current estimates of the spreading rate along the Ayu Trough are 3·5–9·1 mm/yr (Fujiwara et al., Reference Fujiwara, Tamaki, Fujimoto, Ishii, Seama, Toh, Koizumi, Igarashi, Segawa, Kobayashi, Kido, Seno and Kinoshita1995; Hong et al; Reference Hong and Lee2002). Our analysis primarily focuses on the entire 40 hour survey, but individual tracks are straight segments ranging in duration from ~1–2 hours. Thus, we shall also explore the expected navigation accuracy on the shorter time scale of a single track.

Figure 2. Map of the RR1605 cruise. Track lines denoted in red and collected bathymetry denoted by coloured relief. Greyscale bathymetry taken from the SRTM15 model derived from satellite altimetry (Smith and Sandwell, Reference Smith and Sandwell1997). Inset diagram shows regional context of the cruise.
GPS data were collected at two stations during this cruise: the Seapath 330+ navigation system employed on the vessel (henceforth referred to as station RRNV) and a campaign-style Trimble NetR9 receiver (henceforth referred to as station RR01). The antennae for these stations were both installed in elevated positions on board the vessel; ship navigation RRNV was (and remains) located on the aft mast and campaign GPS RR01 was installed on the deck above the bridge. We processed data collected from 13 May 2016 to 15 May 2016 using the PANDA, CSRS and GIPSY software as before. The closest IGS stations were in Manila, Philippines at a distance of 1,700 km from the survey area and Guam at a distance of 1,600 km, so a real-time kinematic solution and differential GPS solutions were unavailable. Inferences had to be made by comparing the kinematic PPP solutions obtained from different software packages.
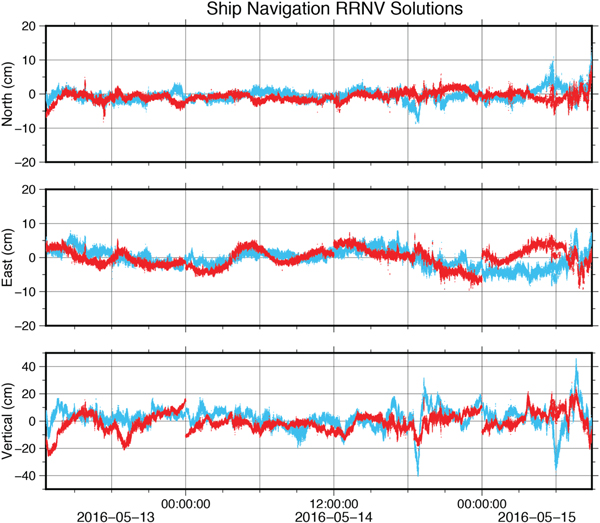
The first comparison we considered was of the RRNV solutions shown in Figure 3, taking the GIPSY-OASIS solution as a baseline (reported uncertainties have been divided by a factor of √2 to account for the difference). The kinematic solutions agreed with 2σ standard deviations of 2·4–2·8 cm in the north component, 5·7–5·9 cm in the east component and 11·4–12·4 cm in the vertical component (Table 2). Assuming that the inherent uncertainties of the PPP solutions are the values inferred from the land station AB21 case in Table 1, the marine GPS solutions introduced 2·0–2·6 cm of noise in the North component, 5·6–5·8 cm of noise in the East component, and 11–11·9 cm of noise in the vertical component compared to the land station. This most likely resulted from inherent differences between terrestrial and marine environments. The constant swell of the ocean meant that satellites near the horizon continually swayed in and out of visibility. Consequently, quality control of the raw data confirmed an increase of ionospheric slips particularly when satellites came into view.

Figure 3. RRNV solutions, taking the GISY-OASIS solution as a reference. Red is the PANDA solution. Blue is the CSRS solution.
Table 2. Differences between solutions generated by reported software and the CSRS software for stations RRNV and RR01. 2σ standard deviations are reported as errors.

We also inferred the uncertainty in the GPS time series for time scales in the order of a single ship track. Each straight survey required 1–2 hours depending on ship speed. Upon inspection of Figure 3, we confirmed that despite being more precise over these shorter time scales, the mean difference between PPP solutions varied within the standard deviations reported for the whole survey in Table 2. During the shorter time interval, the GPS satellites completed only a fraction of their orbit, which may explain these systematic deviations from the long-term mean.
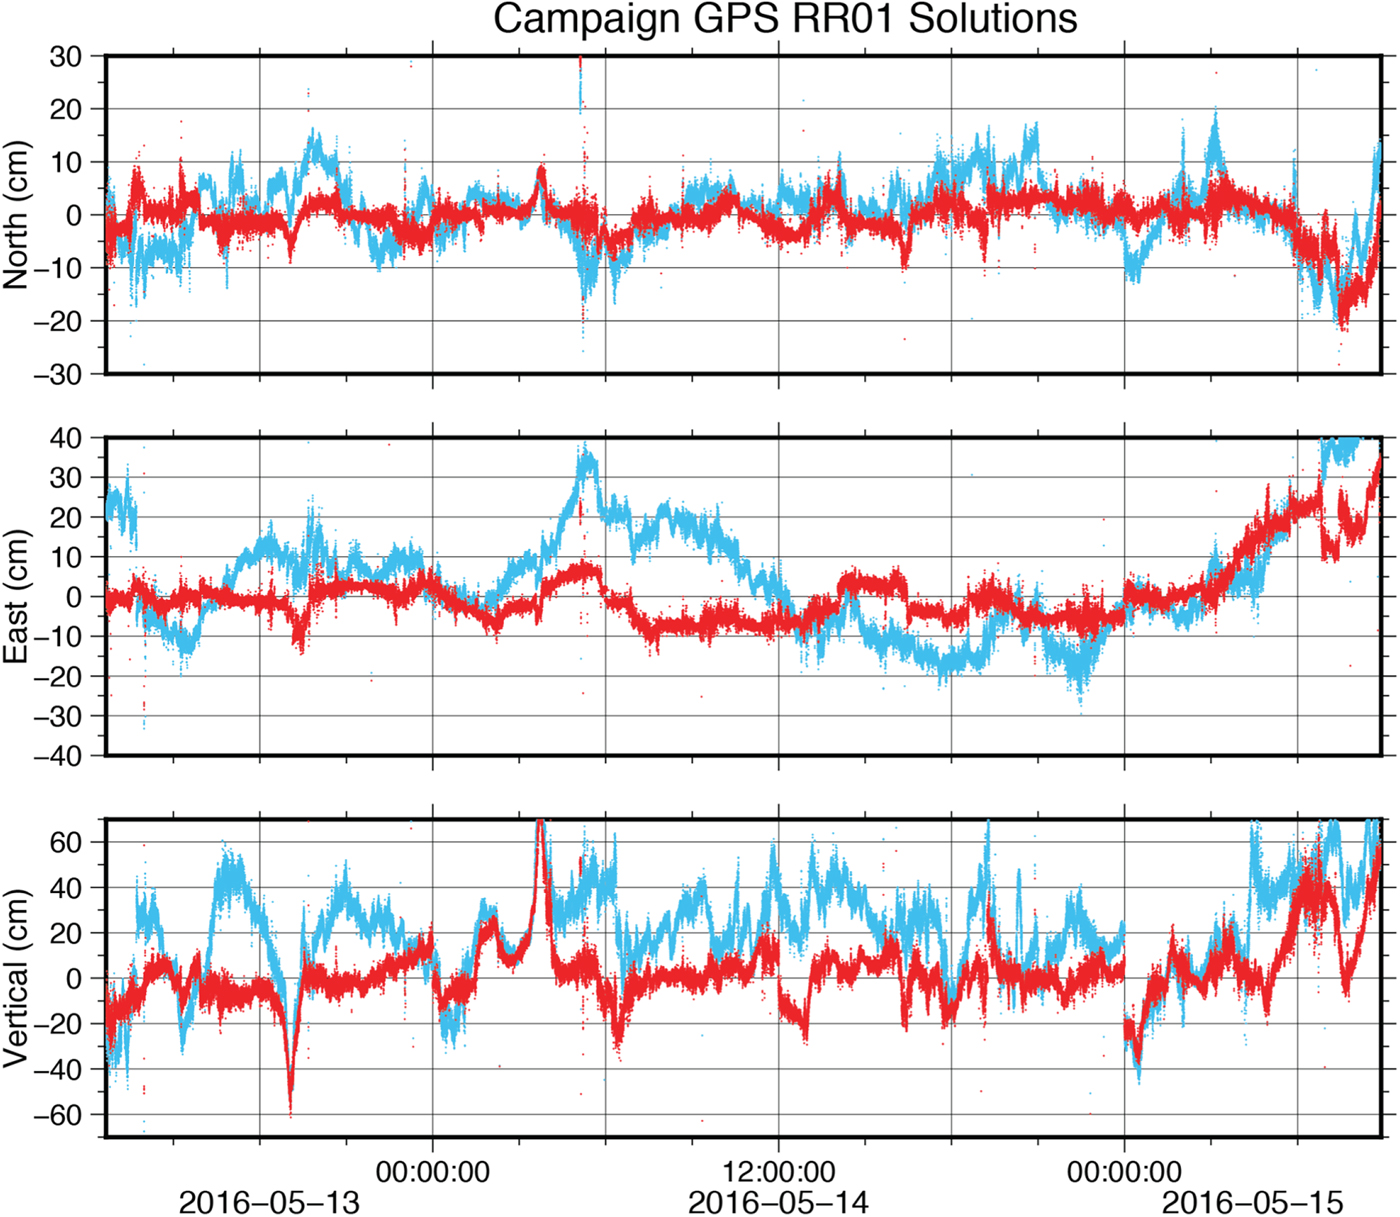
The comparison between kinematic solutions for station RR01 (Figure 4, Table 2) was significantly worse. The GIPSY-OASIS and PANDA solutions for the campaign GPS agreed with uncertainties at least twice as large as the ship navigation case, implying an additional source of noise adding 4·4 cm to the north component, 7·3 cm to the east component and 5·0 cm to the vertical component of the previous estimates. The CSRS solution was an even greater outlier. This lack of repeatability implies a shortcoming of the station since the ship navigation solutions obtained were more stable despite being collected on the same moving platform at the same time and processed with the same software. A probable cause for the poorer accuracy of campaign GPS RR01 solutions was the location of the antenna. Although situated at a higher elevation, the campaign GPS was also directly in the shadow of the ship's radar equipment and therefore susceptible to lesser sky visibility and greater multipath effects. Quality control of the raw data verified the campaign GPS had many more multipath slips than the ship navigation. The multipath RMS values varied from 1·06–2·05 m for the campaign GPS as opposed to 0·27–0·43 m for the ship navigation. These campaign GPS solutions thus provide a clear example of the variance that may be introduced as a result of antenna placement on the vessel.

Figure 4. RR01 solutions, taking the GIPSY-OASIS solution as a reference. Red is the PANDA solution. Blue is the CSRS solution.
4. COMPARISON TO REAL-TIME SHIP NAVIGATION
We evaluated the utility of the standard scientific instrumentation deployed on UNOLS vessels by comparing post-processed PPP and real-time ship navigation solutions. Since both the PPP and real-time solutions were derived from the Seapath 330+ instrument, significant deviations from a common solution result from error of the real-time solution, assuming the accuracy of RRNV solutions were the same as for the land station AB21 solutions.
Although conceptually simple, there are two complications introduced by this calculation. The first complication is that an offset was introduced to the real-time solution during the processing step so that it tracks the motion reference unit of the vessel rather than the antenna. This offset is known from independent surveys of the instrumentation on board the Roger Revelle and reported as “Truth” in Table 3. The second complication is that the horizontal components of the difference between post-processed and real-time solutions were not independent due to the continuously changing heading of the vessel during the survey. We avoided this issue by considering the magnitude of horizontal displacement between solutions rather than individual components. The vertical component was considered separately because it is independent of heading and (as previously demonstrated) has worse accuracy compared to the horizontal components.
Table 3. Horizontal and vertical components of distance between RRNV real-time and PPP solutions. Single standard deviations are reported as errors. The known value between the antenna and motion reference unit is reported as “Truth”. 2σ standard deviations are reported as errors.
Figure 5 and Table 3 show histograms of the distances between the PANDA and real-time solutions of the ship navigation, corresponding to the vertical and horizontal components. Accounting for the width of the histograms, the solutions were 20·296 ± 1·423 m apart in the horizontal components and 11·061 ± 3·630 m apart in the vertical component. Comparing this measurement to the expected distances, we found the horizontal and vertical distances to be within error. Assuming RRNV solutions with accuracy comparable to the AB21 solutions and pitch and roll errors in the order of 60 cm (obtained for the known instrument geometry by estimating variations of ±3°), this implies the horizontal ship navigation components may be accurate to ~0·8 m and the vertical component may be accurate to ~2·8 m. This analysis was repeated using other PPP solutions for ship navigation RRNV, yielding similar results for the other processing techniques. In light of our expected noise levels for the PPP solutions, nearly all of this uncertainty must be indicative of the noise level in the real-time ship navigation solution. It is important to note that the real-time solution is not a Real Time Kinematic (RTK) solution because these data were collected too far from a stable land station. We expect the real-time ship navigation solution to be more accurate closer to shore when an RTK solution is available.
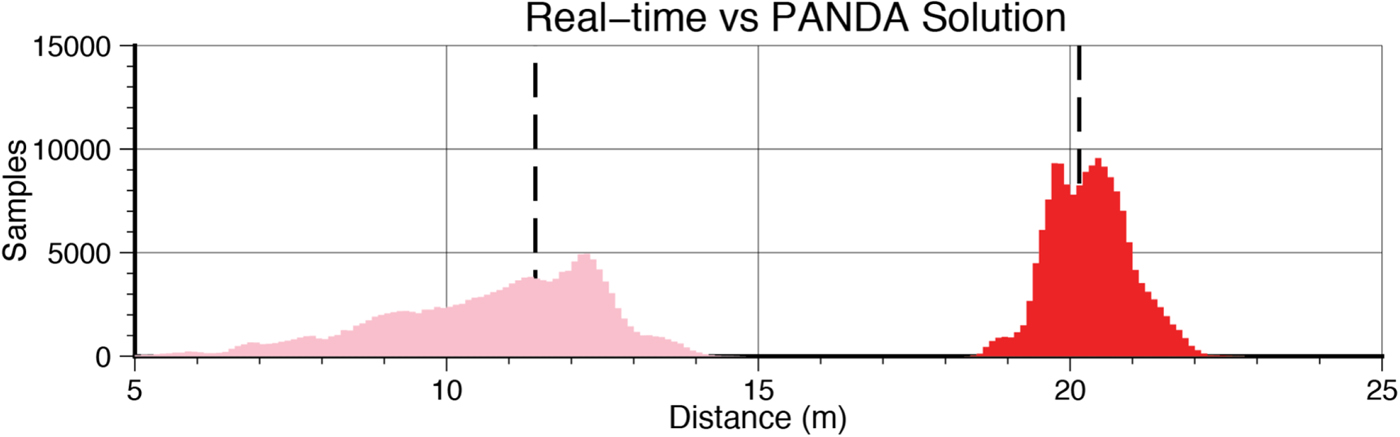
Figure 5. Histograms of the horizontal (red) and vertical (pink) components of distance between the PPP solution (computed using PANDA) and real-time ship navigation solutions. Bold dashed lines indicate the true distances between the Seapath 330+ antenna and the motion reference unit.
5. CONCLUSIONS
We have performed PPP post-processing on the following three stations: continuous land-based station AB21, ship navigation RRNV, and campaign GPS station RR01 deployed on a research vessel at sea. We generated solutions using CSRS, PANDA, and GIPSY-OASIS software packages, all of which agreed with the SOPAC daily solution for station AB21 with uncertainties of 1·1–1·3 cm in the horizontal components and 2·3–3·5 cm in the vertical component, verifying that PPP is an accurate method for land-based stations even in remote areas far from the network used to determine clocks and orbits.
The PPP solutions also agreed for ship navigation RRNV, although frequent ionospheric slips of low elevation satellites due to the rocking of the research vessel with the ocean swell introduced 2·0–5·8 cm of horizontal uncertainty and 11·0–11·9 cm of vertical uncertainty to the solutions. The solution errors were somewhat larger over the shorter time increments that will be used for the repeated sonar surveys. We may not draw a quantitative conclusion about the absolute accuracy of these solutions since we do not have the equivalent of a SOPAC daily solution at sea for a moving platform, but the high degree of repeatability demonstrated implies that PPP-processed ship navigation may be accurate enough for GPS-Acoustic surveys as long as enough data is collected to cover multiple orbital cycles of the constellation. Shorter collection periods yielded fewer stable results, but the sub-metre accuracies obtained are still sufficient for repeated sidescan sonar surveys.
The solutions were poorer for station RR01, which had at least an additional 4·4 cm of uncertainty in the North component, 7·3 cm of uncertainty in the East component, and 5·0 cm of uncertainty in the vertical component. The CSRS solution was particularly unstable for this station, having additional uncertainties at least twice as large. We attribute this apparent degradation in quality compared to the ship navigation RRNV solutions to differences in receiver antennae locations. The campaign GPS being installed above the bridge (and subsequently below the ship's radar equipment) most likely led to it having poorer sky visibility and greater multipath susceptibility compared to the ship navigation receiver, which was installed on the aft mast.
We used the RRNV solutions to evaluate the accuracy of the real-time ship navigation feed by comparing the measured distance between the PPP and real-time solutions to the known distance between the ship antenna and the motion reference unit. We found the horizontal component to be accurate to within ~1·4 m and the vertical component to within ~3·6 m of known values. Factoring the expected noise introduced by the roll and pitch of the vessel, we expect the uncertainties of the real-time ship navigation solution to be ~0·8 m in the horizontal components and ~2·8 m in the vertical component. These estimates may overestimate the measurement error given our lax treatment of ship orientation. Nevertheless, the difference between standard and post-processed ship navigation still implies an improvement of many decimetres in the horizontal components and a few metres in the vertical component in computing the platform location.
PPP is a viable method for calculating ship position that may be used to provide kinematic solutions repeatable on scales of a few centimetres, even in very remote locations where differential GPS may not be feasible. Despite being a post-processing technique, it may be used to obtain near real-time solutions with a delay of a few hours using the IGS “ultra” solutions for satellite clocks and orbits. The station geometry is critical for this method, and requires good visibility and little multipath. An additional point of interest is that these results may not be fully indicative of the accuracy obtainable by the ship navigation system. The ship navigation system logged data from Galileo and Beidou satellites throughout the survey that were not utilised during this study because these networks have not yet been integrated into the PPP software considered. Thus, we expect these results to improve in the future as PPP solutions using these satellites become more common.
ACKNOWLEDGEMENTS
We would like to acknowledge Peng Fang and Yehuda Bock for their assistance in setting up the PANDA software, as well as three anonymous reviewers for their feedback on the initial manuscript. We would also like to thank the Scripps Ship Scheduling Office, Shipboard Technical Services, James Holmes, Captain Dave Murline, and the crew of the RV Roger Revelle.
FINANCIAL SUPPORT
This work was supported by the National Science Foundation, Marine Geology and Geophysics Division, grant 1536386. The RR1605 cruise was supported by the UC Student Ship Funds Program, courtesy of the Office of Naval Research.