1. INTRODUCTION
Ships moving in close proximity mutually influence each other. Hydrodynamic interactions occur between them in the form of suction forces, repelling forces and yaw moments. These effects have a significant influence on vessel movements and should be taken into account in the automated ship's control process. Taking into account the above-mentioned effects influences traffic safety in a strong and definite way, whereas setting them aside can lead to a collision.
Due to the practical aspect of the use of research results in the design and synthesis of an automatic control system for Underway Replenishment (UNREP), it was considered important to estimate the interaction force values in fast-time investigations. Automatic control systems require an extended mathematical model of the Service Ship (SS) containing forces originating from the occurrence of the Ship To Be Lightered (STBL) moving in close proximity. Therefore measured force values have been compared with the results of mathematical calculations in order to prove if the analytical formulas could be used in the pair of vessels motion mathematical modelling procedure.
Vessels moving in close proximity interact with each other. This is to do with the characteristic pressure distribution around a moving ship's hull, which is shown in Figure 1. As a result of vessel movement on the border of two media (water and air) it is possible to observe the occurrence of increased pressure region surrounding the ship's bow and stern and decreased pressure region amidships (Rawson and Tupper, Reference Rawson and Tupper2001).
Figure 1. Pressure distribution around the hull of a moving ship.
When the decreased pressure regions “meet” the suction phenomena between two vessels occurs. So the ships will be attracted to each other. The suction force is maximal when the relative longitudinal shift is equal to zero and the accelerated water flowing between their sides causes the biggest sway force. In case of high pressure regions adjacency a repulsion effect occurs. The interaction force depends on disproportions in hull dimensions, transverse distance between the ship sides, draft and vessel velocities.
Hydrodynamic interactions caused by the movement of ships in close proximity are an important factor influencing the control process. For example, as a result of the research project at Ghent University the magnitude and nature of these interactions (Lataire et al., Reference Lataire, Vantorre, Delefortrie and Candries2012; Reference Lataire, Vantorre, Vandenbroucke and Eloot2011) were measured with the use of a Very Large Crude Carrier (VLCC) and a smaller tanker ship model in a towing tank. Lightering is a quasi-stationary process because of the low relative speed difference, which according to Lataire et al. (Reference Lataire, Vantorre, Delefortrie and Candries2012; Reference Lataire, Vantorre and Delefortrie2009) cannot be modelled in the same way as the process of overtaking. For this reason, modification of the mathematical model of the process for replenishment operations was performed. Decker (Reference Decker2006) compared the effects of hydrodynamic forces analytically determined on the basis of mathematical model with the real forces that occur between ships moving in the towing tank and described how the lateral distance and speed affect their value. In the work by Gierusz and Waszkiel (Reference Lataire, Vantorre, Vandenbroucke and Eloot2011) simulations of the water flow around a moving pair of vessels based on Computational Fluid Dynamics (CFD) software are provided. On this basis it is possible to estimate hydrodynamic forces occurring between the hulls, although validation of this technique is still ongoing. This method allows placing the ship's hull in the virtual towing tank and checking how it will behave and what type of forces, resulting from the fluid flow around it, will act (Gierusz and Waszkiel, Reference Gierusz and Waszkiel2012; Gucma et al., Reference Gucma, Schoeneich and Jachowski2008). Also, it is necessary to model the three-dimensional hull, which is a demanding process. Moreover, CFD analysis in the case of complex shapes is time-consuming and requires large amounts of computer power. It is also possible to estimate forces and moments occurring between a pair of vessels on the basis of semi-empirical equations described by Grensemann in Brix (Reference Brix1993). However the formulae are limited to the overtaking manoeuvre of ships whose dimensions are quite similar.
Up to now measurements of suction forces and the yaw moments determined on the basis of large scale ship models, sailing in deep water conditions have not been described in literature. So far, for this purpose only ship models made in a small scale of order 1:70 have been used (Decker, Reference Decker2006). The measurements were taken only in towing tanks. Paying particular attention to issues related to fluid mechanics, it can be concluded that a model moving in water in the enhanced scale significantly affects the quality of obtained results. After making the appropriate scaling, they are much closer to actual interactions occurring between a real pair of merchant ships. The newest experiments involving automatic control system of pairs of ships were done by Giron-Sierra et al. (Reference Giron-Sierra, Gheorghita, Angulo and Jimenez2015) but they did not incorporate interaction force assessment.
2. OBJECT OF EXPERIMENTS
Measurements of forces acting on ships during lightering operations were performed with the use of two training ships built in 1:24 scale. These training models were built preserving general scaling laws. Therefore the geometric, kinematic and dynamic similarity is guaranteed. Blue Lady and Dorchester Lady are also equipped with steering and propulsion gear, whose dimensions and powers are also scaled relevantly. In case of the VLCC tanker Blue Lady, it consists of the main engine propeller, rudder, rotatable thruster, bow and stern thrusters. In the Liquid Natural Gas (LNG) carrier Dorchester Lady the propulsion system consists of two azipods on the stern, a rotatable thruster on the bow and bow thruster. Thus the training ships behave like real vessels and only time is scaled in a
 $\sqrt {24} :1$
ratio. During the research LNG carrier Dorchester Lady and tanker Blue Lady models built in 1:24 scale were used. Both ships’ dimensions are summarised and compared with full scale vessel characteristics in Table 1. Their silhouettes and body plans are shown in Figures 2, 3 and 4.
$\sqrt {24} :1$
ratio. During the research LNG carrier Dorchester Lady and tanker Blue Lady models built in 1:24 scale were used. Both ships’ dimensions are summarised and compared with full scale vessel characteristics in Table 1. Their silhouettes and body plans are shown in Figures 2, 3 and 4.
Figure 2. Silhouettes of ship models in the same scale: (a) tanker Blue Lady, (b) LNG carrier Dorchester Lady (Gierusz, Reference Gierusz2001).

Figure 3. Body plan including waterlines of the service ship (SS) – LNG carrier Dorchester Lady.

Figure 4. Body plan including waterlines of the ship to be lightered (STBL) – VLCC Blue Lady.
Table 1. Training ship models dimensions.
Accordingly, studies concerning the measurement of forces occurring between the pair of training ship models operating in lake conditions, which are quite similar to real ones, were performed. The research was based on training ships owned by the Foundation for Safety of Navigation and Environment Protection and carried out in their Ship Handling Research and Training Center in Ilawa-Kamionka on the Silm Lake.
3. ANALYTICAL CALCULATION RESULTS OF FORCES ACTING BETWEEN THE MOVING PAIR OF SHIPS
Longitudinal and transversal interaction forces and yaw moment values for a pair of ships overtaking each other can be estimated on the basis of equations constituting the mathematical model for lightering manoeuvres (Lataire et al., Reference Lataire, Vantorre, Delefortrie and Candries2012). This method is much simpler than making calculations on the basis of known theoretical approaches, based on the fluid flow theory from fluid mechanics (Newman, Reference Newman1965).
The surge force, sway force and yaw moment induced by the vicinity of another ship, are estimated on the basis of a mathematical model. Both vessels are moving at the same speed and course in close proximity. It is proved in the literature that forces acting on the STBL and SS are different. Moreover, the lateral interaction forces acting on both the ships are acting in opposite directions. So the ships dependent on the longitudinal shift are attracted or repelled to each other during the lightering operation.
The method of forces and moments estimation assumes that ships move at the same speed and course with a certain relative longitudinal shift (ξ = x/L pp [ − ]) as shown in Figure 5, where: X[N] is surge force, Y[N] is sway force, N[Nm] is yaw moment, and subscripts: SS is Service Ship and STBL is Ship To Be Lightered. Sway forces acting on the SS and STBL according to Lataire et al. (Reference Lataire, Vantorre, Delefortrie and Candries2012) are described by Equations (1) and (2).
 $$Y_{SS} = C_{Y\,max} \displaystyle{1 \over 2}\rho V^2 \displaystyle{{\Delta _{STBL}} \over {L_{PP_{SS}}}} \left( {\displaystyle{{T_{SS}} \over {B_{SS}}}} \right)^{C_T} \left( {\displaystyle{{B_{SS}} \over {y_{cb}}}} \right)^{Cy} \cos \left( {C_\xi \pi \xi _{STBL}} \right)e^{ - \xi _{STBL}^2} $$
 $$Y_{STBL} = C_{Y\,max} \displaystyle{1 \over 2}\rho V^2 \displaystyle{{\Delta _{SS}} \over {L_{PP_{STBL}}}} \left( {\displaystyle{{T_{STBL}} \over {B_{STBL}}}} \right)^{C_T} \left( {\displaystyle{{B_{STBL}} \over {y_{cb}}}} \right)^{Cy} \cos \left( {C_\xi \pi \xi _{SS}} \right)e^{ - \xi _{SS}^2} $$
Figure 5. Directions marking the forces and moments acting on ships moving in parallel according to Lataire et al. (Reference Lataire, Vantorre, Delefortrie and Candries2012).
Where y cb is lateral distance between own ship centreline and side of target ship, L pp [m] is length between perpendiculars, B[m] is breadth, T[m] is draft, ∆[m3] is displacement, C ξ , CT, Cy are the coefficients of the mathematical model and ρ is water density.
On the basis of training ship models' technical data contained in Table 1, the lateral interaction forces (YSS and YSTBL ) acting during lightering operations involving Blue Lady (STBL) and Dorchester Lady (SS), have been computed on the basis of Equations (1) and (2). These values are dependent on the relative longitudinal shift (ξ). The comparison between sway force on both ships for longitudinal relative positions in the range from −0·8 to 0·8 are presented in Figure 6. According to forces notation presented in Figure 5 ships are attracted to each other when the relative longitudinal position value is within the range: −0·5 ≤ ξ ≤ 0·5. With a further increase of the absolute value of longitudinal shift, the ships are repelled from each other. Total lateral interaction force acting between the training ship models is shown in Figure 7. These values were computed as a sum of sway forces acting on the SS and the STBL for a range of relative longitudinal positions.

Figure 6. The values of modelled sway force for the STBL and SS for a range of relative positions.

Figure 7. Total interaction lateral force acting between the SS (Dorchester Lady) and STBL (Blue Lady).
These calculations were made for the average value of longitudinal velocity of 1·1 m/s. This speed is equivalent to half ahead setting, which is treated as a working condition of the automatic control system. The longitudinal force, as negligibly small in comparison with the force generated by propellers is not included in the figure and not further considered.
4. THE MEASURING SYSTEM
On the basis of measurements conducted by Lataire and others in towing tanks related to the interaction between two ship hulls moving at a limited distance from each other (Lataire et al., Reference Lataire, Vantorre and Delefortrie2009; Reference Lataire, Vantorre, Vandenbroucke and Eloot2011; Reference Lataire, Vantorre, Delefortrie and Candries2012), the decision was made to carry out similar measurements based on real floating vessel models at a much larger scale (1:24 instead of 1:70), described in Section 2. Research experiments were conducted on Silm Lake, where deep water conditions were guaranteed. Also during the experiments ships were sailing far away from shore, so wall effects, which occur in towing tanks, did not appear. For a pair of training ship models the numeric data dealing with suction forces and yaw moment from CFD simulations and analytical calculations are similar qualitatively and quantitatively. This means that the suction force has the biggest value when ships' amidships are in the same plane and decreases with their relative shift. In Gierusz and Waszkiel (Reference Gierusz and Waszkiel2012) these forces are computed for a pair of training ship models. Based on the CFD computation results presented in Gierusz and Waszkiel (Reference Gierusz and Waszkiel2012) and an estimation of the forces according to the mathematical model prepared by Lataire et al. (Reference Lataire, Vantorre, Delefortrie and Candries2012) which were treated as estimated values of tenacity and tensile strength, the measurement construction was made. It was discovered that forces occurring between the hulls of LNG carrier Dorchester Lady and tanker Blue Lady should not exceed 200 N. Accordingly, the structure was designed in such a way as not to be destroyed in case of 500 N force occurrence, i.e. 250% greater than the value derived from analytical calculations, considered the estimated value.
4.1. Mechanical Structure for the Forces Measurement
In order to measure suction forces occurring between two real models of ships moving in parallel, the vessels were combined with a mechanical structure. Mounting strain gauges directly to one of the structural elements linking the ships (Figure 8) allowed for direct measurements of total lateral forces acting between them. This approach fulfilled the requirement of self operating measurement execution in lake conditions.

Figure 8. Schematic layout of the ships fitted with the measuring structure; LNG carrier Dorchester Lady (on the starboard) and tanker - VLCC Blue Lady (on the portside).
The measurement structure was made of aluminium, because of its light weight and resistance to weather conditions and water influence. Weight of the gauge is 0·3 kg. It consisted of an aluminium tube with a diameter of 100 mm, a shearer element (Figure 9), performing the measurement of total lateral forces interacting directly on the construction. It was connected to the sides of both ships through cardan joints (Figure 9) allowing for small movements of the ships in vertical and horizontal planes, which in case of measurement carried out with the use of real large scale training ship models sailing on the lake, could not be avoided. The elements responsible for direct connection between the construction and ship sides were suction cups (Figure 9), whereby an ease of assembly and disassembly of the sensor element was obtained. Moreover, this solution enabled easy change of the relative longitudinal vessels’ position (ξ).

Figure 9. Floating models of merchant vessels combined by the measuring structure; a –shear element, b – cardan joints, c – suction cups combining measurement construction with ships' sides.
4.2. Results Registration - Measuring Sensors and their cooperation with the Transducers Card
KMM20 strain gauges, having the measuring range of ±200N, and supply voltage rating of 5 V each were used as sensor elements. Their usable load amounts of up to 150% of the measuring range, while they limit load up to 200% of their measuring range. These sensors were selected because of their high accuracy, as well as their appropriate operating range. It was estimated that forces acting between the vessels should not exceed 200 N, and the sensor is not destroyed even when the force reaches up to 400 N. The sensors, which allow measuring both tensile and compressing forces, were used and therefore it was possible to measure suction and repulsion forces generated by uneven pressure distribution along the ship hulls.
The sensors powered with rated voltage provide the voltage of ±1 mV at the output of the measurement bridges. Therefore an amplifier was applied to the differential output signal. For signal real time acquisition Matlab xPC Trget software with analogue-to-digital transducers card PCL-818, manufactured by Advantech, was used.
4.3. Towing the System of Two Vessels - Towing Construction
Each of the floating training ship models is an autonomous object equipped with its own stand-alone propulsion system. Research experiments involving the total lateral interaction force measurements required bringing them up to an appropriate speed. Ship propellers generate longitudinal forces, lateral forces and yaw moments. Also during the tests there was a need not to bring the pair of vessels into circulation. This requirement could not be fulfilled when the ships were self-propelled, because of the lack of course steadiness of VLCC Blue Lady. If the course was to be stabilised, there would be need of steering gear use. So it was decided to tow these two ships connected together with the measurement structure using a tug (Figure 10) Yellow Turtle, which had a sufficiently powerful engine to propel the ships system with the total weight of 30 tons and accelerate it to speeds exceeding 1·1 m/s. In Figure 10 the configuration in which Blue Lady and Dorchester Lady were towed combined together, is shown. Forces F1 and F2 are equal to the total torque values, but their directions are opposite.
Figure 10. The configuration of the towed units during the measurements.
Thrusters located on board both ships, so that they can move on the border of two media (air and water), must at least compensate for the total drag force RT (Equation (5)).
Total resistance coefficient (CT ) described by Equation (3) is a sum of frictional resistance of the ship according to the International Towing Tank Conference-1978 (ITTC-1978) (ITTC, 1978) ship-model correlation line coefficient (CFS ), roughness allowance (∆CF ), residual resistance (CR ) and air resistance (CAA ) coefficients. At the design stage of the structure used for vessel towing, there was a need to assign the ratio of hydrodynamic resistance of both ships. Therefore high precision of calculations was not required. Thus air resistance and roughness allowance are treated as negligibly small. The approximate value of total resistance coefficient considering these simplifications is described by Equation (4). Because both ships have comparable dimensions and move at the same speed, their Froude and Reynolds numbers are comparable. Similarity of the approximate total resistance coefficients for both ships results from this assumption.
 $$C_T = (1 + k)C_{FS} + C_R + \Delta C_F + C_{AA} + C_A $$
 $$C_T \approx (1 + k)C_{FS} + C_R + C_A $$
 $$R_T = \displaystyle{1 \over 2}C_T \rho _w v^2 A_S $$
where ρ w is water density, ρ A is air density, v is ships’ velocity, A S is the wet surface area of the hull, C A is a correlation allowance and k is a factor from the resistance test.
In connection with the assumption simplifying calculations, it can be assumed that total resistance is proportional to wet surface area of the hull at constant speed and water density. Because of that, in order to determine the ratio of two ship resistances, the wet surfaces of the two hulls were determined. They were respectively 23·217 m2 in the case of the LNG carrier Dorchester Lady and 43·904 m2 in case of the tanker Blue Lady. Estimated resistances ratio was 0·53 and this value was used in the design of the towing triangle structure (Figure 11(b)). Knowing that setting each ship in motion requires a different force (significantly greater in the case of tanker Blue Lady), the towing structure should be designed in such a way that it can be trailed to the tug at one point, and the towing triangle will not twist (as shown in Figure 11(a)). The attachment of two ships at one point to the tug minimises the effect of rotation under the influence of two unbalanced forces (coming from the two vessels) acting on the certain arm. Application of the triangle allowed for towing these vessels at a fixed transverse distance from each other.
 $$F_1 \cdot s^{\prime}_1 = F_2 \cdot s^{\prime}_2 \Rightarrow s^{\prime}_1 = \displaystyle{{F_2} \over {F_1}} \cdot s^{\prime}_2 \Rightarrow s^{\prime}_1 = \displaystyle{{R_{T2}} \over {R_{T1}}} \cdot s^{\prime}_2 \Rightarrow s^{\prime}_1 = 0\cdot53 \cdot s^{\prime}_2 $$
 $$H_y = H_0 \cdot y^{ - 1/3} $$

Figure 11. Method of towing triangle to tug attachment; (a) – situation in which twisting moments are not balanced, (b) – equilibrium situation.
Where H Y (m) is wave height y metres from the sailing line, H 0 (m) is wave height when generated and y(m) is the lateral distance from the sailing line.
This towing triangle made of a strut wooden beam and two soft polypropylene ropes will not twist only when the twisting moments derived from both ship resistance forces are compensated for. This will happen when Equation (6) is fulfilled. Therefore, measurements were carried out in the configuration shown in Figure 11(b), corresponding to the actual situation shown in Figure 12 at a distance of 30 m, where wake wave height is about 0·06 m and can be treated as negligible. Wake wave height was computed according to Equation (7) (Glamore, Reference Glamore2009).

Figure 12. Air view of the experiment – suction force measurements carried out on Silm Lake.
4.4. Methodology of the Research
All measurements were carried out during the research work conducted on Silm Lake in the Ship Handling Research and Training Centre of the Foundation for Safety of Navigation and Environment Protection in Ilawa-Kamionka. The results of test experiments, namely voltage values coming from strain gauges and values of longitudinal velocities of the moving pair of vessels, were recorded in real time. According to the scale of ship models these tests are fast time investigations. During the undertaken tests sampling period was equal to 0·1 s. For a greater accuracy, longitudinal speed was reconstructed in real time on the basis of data from the Global Positioning System (GPS), instead of using its value measured by the log installed on board the model. Data from sensors mounted on the fore beam and the aft beam were recorded separately.
The Ship To Be Lightered during the test experiments was fully loaded and the Service Ship was in ballast condition. In real conditions it is a situation in which the lightering manoeuvre starts. Both vessel models were at even keel. All tests were quasi-steady state experiments carried out in configuration presented in Figure 13. Both ships (STBL – Ship To Be Lightered and SS – Service Ship) moved along the x-axis. Relative lateral distance is described as the distance between ships′ sides yb . Relative dimensionless longitudinal position ξ is expressed by Equation (8):
 $${\rm \xi} = \displaystyle{{{\rm x}_{\rm c}} \over {1/2(L_{{\rm ppSS}} + L_{{\rm ppSTBL}} )}}$$

Figure 13. Definition of dimensionless relative longitudinal position ξ[−] and relative lateral position y b (m).
Where x c is the longitudinal distance between STBL and SS midships sections, L ppSS is the SS length between perpendiculars and L ppSTBL is the STBL length between perpendiculars.
Three values of ξ defined by Equation (7) are of importance. ξ = 0 means that the amidships of both ships are aligned, ξ < 0 – SS is aligned astern of STBL and ξ > 0 – SS is aligned ahead of STBL.
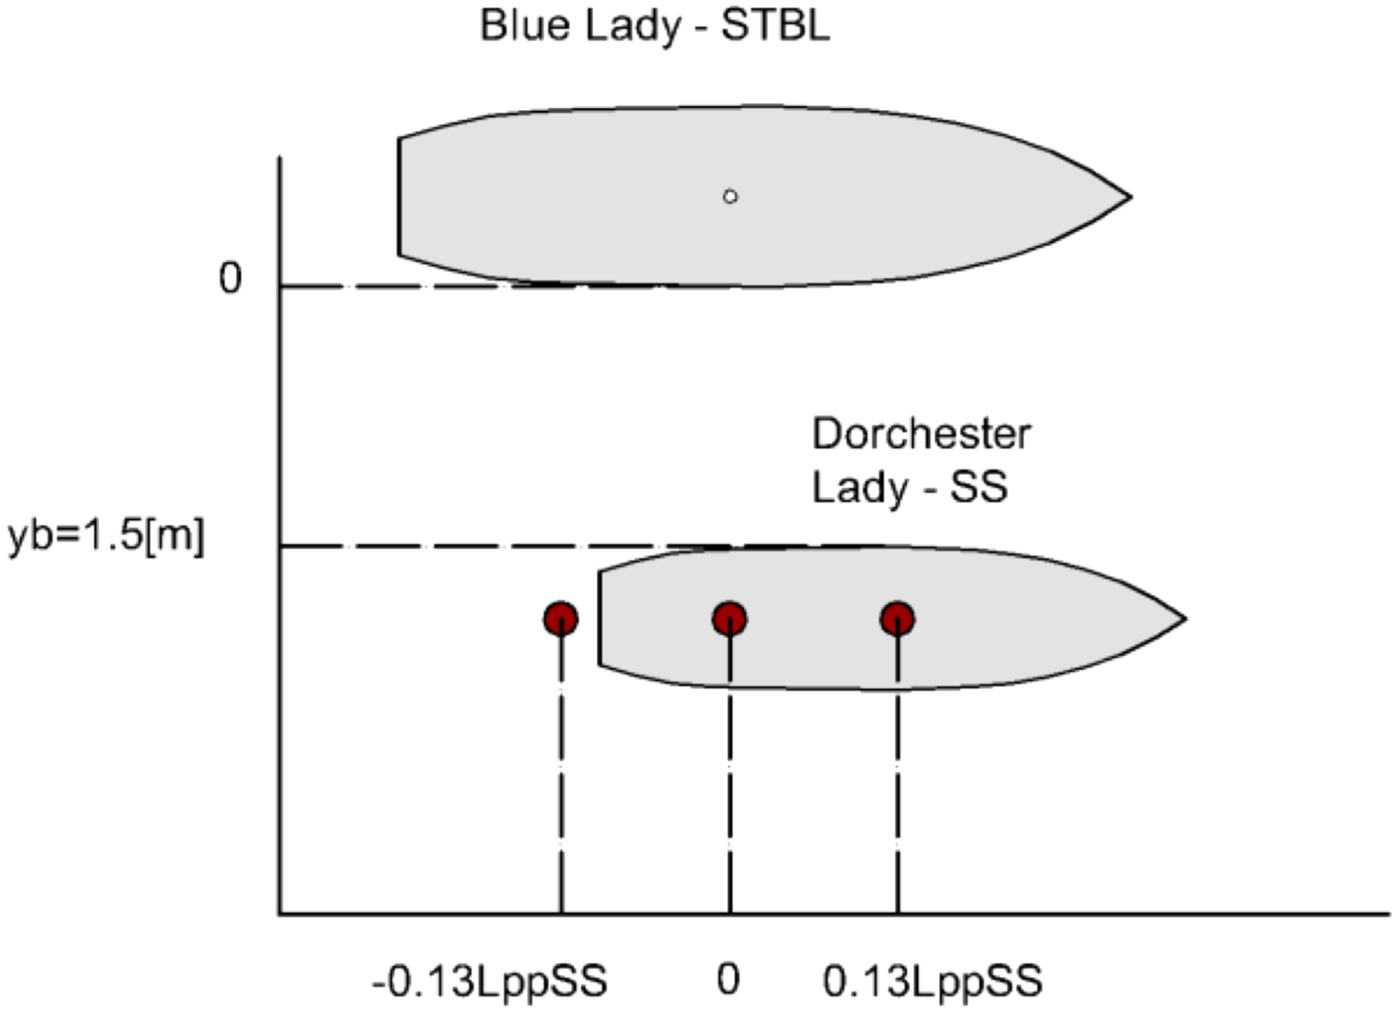
Lateral relative position was constant and equal to 1·5 m. However relative longitudinal position was varied during the conducted tests, and is marked by red dots - each dot is SS midship position in one test (Figure 14). The range of these relative positions was selected in accordance with common assumptions of lightering operations, where relative longitudinal distance ξ oscillates around zero (ξ ≈ 0). For the purposes of future parallel ships motion automatic control system the midships of both vessels should not vary harmonically more than ±0·1 Lpp as a function of time. These longitudinal relative movements should be controlled by the longitudinal velocity Model Predictive Controller. This is the reason why three values of relative longitudinal positions have been arranged during the research experiments. Tested relative longitudinal positions were: ξ = 0 and ξ = ±0·13 Lpp. They are indicated by red dots, which indicate SS centre of gravity in particular trials, in Figure 14.

Figure 14. Relative positions of STBL and SS vessels tested.
All experiments have been carried out during acceleration and free motion in order to show how the force changes with the speed change. The readouts are taken at forward speed equal to 8·0 knots for a full scale ship. This means that these two ships were towed parallel to each other at speeds of up to 1·1 m/s. The filtered readouts from both the strain gauges for relative lateral distance of 1·5 m and relative longitudinal distance of ξ = 0, where the amidships of both ships are aligned, are shown in Figure 15. Figure 16 shows the interaction force values measured respectively by the bow and stern strain gauges, when the SS is positioned 0·13 Lpp ahead of the STBL at a lateral distance of 1·5 m. In turn, Figure 17 presents the interaction forces recorder during a trial, when the SS is positioned −0·13 Lpp astern of the STBL at a distance of 1·5 m.

Figure 15. Forces derived from measurements performed with the bow sensor (black line) and the stern sensor (red line) for relative lateral position yb = 1·5 m and relative longitudinal position ξ = 0.

Figure 16. Forces derived from measurements performed with the bow sensor (black line) and the stern sensor (red line) for relative lateral position yb = 1·5 m and relative longitudinal position ξ = 0·13 Lpp.

Figure 17. Forces derived from measurements performed with the bow sensor (black line) and the stern sensor (red line) for relative lateral position yb = 1·5 m and relative longitudinal position ξ = −0·13 Lpp.
5. RESULTS
According to Lataire et al. (Reference Lataire, Vantorre, Delefortrie and Candries2012) the sway force on STBL induced by SS moving in close proximity will be about 30% smaller than the sway force on SS induced by close proximity of the moving STBL. The total interaction force acting between ships moving in parallel is a sum of sway forces acting on each vessel. It is obvious and proved by Brix (Reference Brix1993), Decker (Reference Decker2006) and Lataire et al. (Reference Lataire, Vantorre, Delefortrie and Candries2012) that the values of suction force will change with the change of relative longitudinal position |ξ| between STBL and SS. Suction force is maximal when ξ = 0. Force value decreases when the absolute value of relative longitudinal shift (Figure 21) increases and if |ξ| = 0·5 it changes its sign.
A yaw moment on the ship occurs when there is a disproportion between the lateral interaction force measured in the bow and stern. Its negative value implies that the bow of the service ship will be attracted towards the STBL. Its positive value is observed when the SS is ahead of the STBL and a repulsion force occurs on the bow, so the stern of the SS is being pulled towards the STBL's hull. These relationships between the interaction forces values recorded by the bow and stern strain gauges are presented in Figures 15–17. It is clearly seen that disproportion between the total force on the stern and bow, when relative longitudinal shift is equal to ξ = 0 reaches a few percent (Figure 15). In Figures 16 and 17 the disproportion between forces recorded on the bow and stern is shown. It indicates that a yaw moment is present. Furthermore, when longitudinal speed of the vessels assembly fell below 0·8 m/s negative values of force from the fore strain gauge were observed. This indicates the occurrence of repulsive forces in this region. This implies that in free motion the sterns of the vessels in this configuration would tend to close each other. This is a situation during which in manual control extreme caution should be used. In case of automatic control system design, high speed and efficiency of the algorithm and also sensitivity to any changes in relative ships positions should be maintained to avoid collisions.
For each position marked in Figure 14, three tests were conducted. In order to obtain the total suction force affecting moving vessels, data coming from two sensors was added. Measurement results after adding are shown in Figures 18–20. The independent variable (domain) is an absolute value of time. Value t = 0 s indicates the start time of the specific experiment. Results presented in these figures are only fragments of experiments showing the phase of interaction forces measurements. In all figures mentioned above, the upper chart shows total lateral interaction force change during the trial (absolute duration of the trial in seconds). In turn the lower chart shows longitudinal velocity change during the same trial. By the red dot value of longitudinal speed u = 1·1 m/s is marked and the corresponding value of interaction force is indicated. The interaction force values obtained in several trials and their mean values for three relative longitudinal positions are presented in Figure 21 and summarised in Table 2.

Figure 18. Total sway force values for longitudinal speeds around 1·1 m/s for relative lateral position yb = 1·5 m and relative longitudinal position ξ = 0.

Figure 19. Suction force values for longitudinal speeds around 1·1 m/s for relative lateral position yb = 1·5 m and relative longitudinal position ξ = 0·13.

Figure 20. Suction force values for longitudinal speeds around 1·1 m/s for relative lateral position yb = 1·5 m and relative longitudinal position ξ = −0·13.

Figure 21. Three test results – total lateral interaction force for lateral position yb = 1·5 m and various relative longitudinal positions.
Table 2. Fast time investigations results.
In this test setup there is a possibility of additive disturbance occurring, because trials are conducted on a lake, not in laboratory conditions. An increase in the value of total force, particularly coming from the bow sensor, between 100th and 110th (Figure 16) second of measurements is a result of the need to “artificially” maintain relative position of the two ships. This was associated with the need to stretch the ropes connecting the two vessels. That procedure prevented the measurement structure breaking away from the ships sides. These moments of time were recorded and disturbing external forces were excluded in the analysis of results.
5.1. Ship-To-Ship Interaction Discussion from the Standpoint of the Deterministic Forces
The total interaction force measured during fast time investigations compared with the total interaction force counted on the basis of Equations (1) and (2) are presented in Figure 22.

Figure 22. Comparison of mean interaction force function and theoretical estimated function for lateral position yb = 1·5 m and various relative longitudinal positions.
Measured values differ from those calculated only by a few Newtons, thus broad convergence of the results was observed. Both the results of experiments and mathematical calculation outcomes are symmetric with respect to zero relative longitudinal shift (ξ = 0). Mean total interaction force values obtained during the tests are a few percent smaller than values computed on the basis of mathematical models created by Lataire et al. (Reference Lataire, Vantorre, Delefortrie and Candries2012). This is a result of the test conditions. Measurements were made in deep water conditions (where water depth to ship draught ratio is higher than three) in contrast to experiments on which the mathematical model was created. It is proved in the literature that the sway force increases with depth decrease during lightering operations.
5.2. Uncertainty Analysis
The undertaken research was carried out on the basis of real floating training ship models. It is necessary to provide a quantitative statement regarding the quality of measurement. The strain gauges used are described in Section 4 and were sources of uncertainties. Thus uncertainty analysis was conducted. All tests were conducted on the lake, where there are no currents. Wind speed during tests did not exceed 0·1 m/s, so there was no impact of wind on the ship models and there were no waves.
Voltage values obtained during the measurements were highly noisy. Therefore, during their analysis a Svitzky-Golay smoothing filter with a finite impulse response and window width of 51 samples was used. During this procedure the filtered waveforms were obtained. Total interaction force values were calculated and its mean estimated standard deviation of the results was calculated. Its value was σ = 7·93N.
Strain gauges, having the measuring range ±200 N and strain constant 1 mV/V (±2%) were used. So their uncertainty amounts to 0·02 mV, which corresponds to 1·6 N after voltage to force conversion. Slack and inaccuracy in the mechanical construction reaches 1 mm. It introduces uncertainty of 0·8 N to total interaction force measurement.
Errors introduced by the whole measurement system were estimated experimentally. The “end-to-end” calibration was made by providing a known force to the test setup. The total measuring error did not exceed 7% of the total obtained force value.
6. CONCLUSIONS
The presented method of determining total lateral forces acting during lightering operations between SS and STBL is unique and new. This statement is motivated by the fact that ship models are built to a much larger scale (1:24) than the models in literature (about 1:70) and with the preservation of general scaling laws, which is a desirable feature. Moreover the presented test setup is a new concept allowing for direct force measurements. The only limitation of this method is lack of the possibility of using the ships' own propulsion systems, so ships’ propeller revolutions are not included as part of the results.
The subject matter has been deeply analysed. Results were obtained in two different ways and compared. Total interaction lateral forces were computed on the basis of mathematical formulae and measured during model tests. Research experiments showed that data obtained in the way described in Section 4 are reliable.
Deep water is desirable but is hard to attain in tests conducted in towing tanks. In the presented measurements shallow water effects do not occur, so force values are closer to real ones.
The measurement system, which was built for research purposes, is a new one. It has not been described in literature and has not been used before. Also the undertaken research is innovative and has not been conducted in this way until now. It leads to the conclusion that the obtained results are also unique.
Measured values of lateral force acting between the STBL and SS are in accord with the computed ones. Due this agreement, one can have greater confidence in the theoretical approach. So the mathematical formulae presented by Lataire et al. (Reference Lataire, Vantorre, Delefortrie and Candries2012) can be used in the procedure of service ship mathematical model extension.
The presented method of measuring actual suction forces occurring between two moving vessels can be successfully used in practice. This method is relatively simple to implement and the size of floating units to which it may be applied depends only on the power of the tug and the endurance of measuring devices presented in Section 4. An improvement of quality of results could be achieved by the use of a heavier tug, which would not be so sensitive to yaw moment coming from the towed ships accelerated in an uneven way.
Further research activities will aim at taking into consideration values of suction forces in the mathematical model of training ship Dorchester Lady and thereby adapting it to the needs of a simulation control system. This system will be applied to a pair of ships proceeding on quasi-stationary motion parallel to each other.