


1. INTRODUCTION
In a restricted area, such as the Strait of Messina, the probability of accidents is very high and the possible consequences of these accidents are disastrous in terms of human and environmental aspects. Soares and Teixeira (Reference Soares and Teixeira2001) have conducted a study where the accidents are subdivided in typologies, this investigation suggests that the principal types of accidents are: fire, grounding and collisions. This underlines the need for understanding and assessing risk models for these kinds of events, so it is fundamental to obtain a reasonable estimate of the probability of such accidents and analyse their consequences. The risk is the product of the probability of occurrence of an event and the expected consequences. Vinnem (Reference Vinnem2014) set out a detailed explanation of risk assessment in offshore-structures with particular emphasis in the evaluation of the probability of collisions, while an explanation of safety management in maritime transportation was defined by Kristiansen (Reference Kristiansen2005). Risk analysis is divided into two principal parts (McDuff, Reference McDuff1978): the evaluation of probability of occurrence of an event and the evaluation of expected consequences. A commonly applied approach for estimating the probability of collisions in maritime traffic was defined by Fujii and Shiobara (Reference Fujii and Shiobara1971) and McDuff (Reference McDuff1978). In this approach, the number of collision occurrences over the studied time period, Ncoll, is estimated as follows:
 $$N_{coll}=N_{A}P_{C} $$
In Equation (1) the value of N A is the number of pairwise vessels involved in a collision during a time period. This number of ships involved in collision are sailing in a so-called blind condition, for which no evasive action is taken. This number leads to geometrical collision candidates.
In the early 2000s, within the Information Technology for Increased Safety and Efficiency in Ship Design and Operation (ISESO) project at the Technical University of Denmark, the International Association of Lighthouse Authorities Waterway Risk Assessment Program (IWRAP) tool, was developed. Basically the IWRAP tool is based on the Fujii and Shiobara (Reference Fujii and Shiobara1971) and McDuff (Reference McDuff1978) approaches.
Many examples of evaluation of this quantity are reported in literature. Pedersen (Reference Pedersen1995) distinguishes three different types of collisions: crossing, overtaking and head-on. This model has been used by Kujala et al. (Reference Kujala, Hänninen, Arola and Ylitalo2009) for an investigation into the marine traffic in the Gulf of Finland and by Klemola et al. (Reference Klemola, Kuronen, Kalli, Arola, Hanninen, Lehikoinen, Kuikka, Kujala and Tapaninen2009) where the purpose was minimising the risk of collision in the Gulf of Finland. In crossing collisions the main part of the calculus is the definition of apparent collision diameter, Montewka et al. (Reference Montewka, Ehlers, Goerlandt, Hinz, Tabri and Kujala2014) suggest it has to be replaced by a minimum distance to collision and depends on the maneuverability of the vessels on a collision course. Kaneko (Reference Kaneko2002) determined the boundary of a closed critical area around the ship; if this is violated by another ship there is a collision.
As the Automatic Identification System (AIS) is now mandatory for all vessels of greater than 300 tonnes gross tonnage, detailed analysis of traffic flow is now possible. This allows different approaches in the treatment of traffic flow such as the ship domain theory (Merrick et al., Reference Merrick, Van Dorp, Blackford, Shaw, Harrald and Mazzuchi2003; Van Dorp and Merrick, Reference Van Dorp and Merrick2011). Weng et al. (Reference Weng, Meng and Qu2012) estimated vessel collision frequency in the Singapore Strait using AIS records, defining a critical situation as when a vessel is expected to enter another vessel's ship domain in a specified time interval. With these new methods for the simulation of marine traffic, more advanced grounding models have been developed (Van de Wiel and Van Dorp, Reference Van de Wiel and Van Dorp2011) including methods for determining the expected number of accidents and the locations where and the times when they are most likely occur with an extensive time-domain micro simulation (Goerlandt and Kujala, Reference Goerlandt and Kujala2011).
The second part of the evaluation concerns the causation probability, P C . This probability quantifies the possibility that no evasive manoeuvre is taken during the collision event. The estimation of this quantity can be done with two different approaches. One approach, historical and reactive, is the use of statistical data of the area, with analysis of accidents and reasons that led to these accidents. Human error is one of the principal causes of transportation accidents and many frameworks have been developed to simulate these events. An example is the framework developed by Harrald et al. (Reference Harrald, Mazzuchi, Spahn, Van Dorp, Merrick, Shrestha and Grabowski1998) based on interviews with maritime experts. Another approach is the use of Bayesian Networks. This approach is used to quantify the error propagation in the actions taken on board to avoid the collision. The main objective of this approach is to transform the historical reactive approach to a proactive one, considering the events that follow a collision and evaluating the probability that these events occur (Montewka et al., Reference Montewka, Ehlers, Goerlandt, Hinz, Tabri and Kujala2014). A powerful solution is proposed by Eleye-Datubo et al. (Reference Eleye-Datubo, Wall, Saajedi and Wang2006). A Bayesian Belief Network has been developed to model the maritime transport system by taking different factors and their mutual influences into account (Trucco et al., Reference Trucco, Cagno, Ruggeri and Grande2008). Another important contribution to the application of the Bayesian framework with uncertainty analysis is proposed by Goerlandt and Montewka (Reference Goerlandt and Montewka2015a). A different approach for risk-assessment in the maritime accident field is the use of the Fuzzy functions. An implemented framework based on this methodology is proposed by Hu et al. (Reference Hu, Fang, Xia and Xi2007). An application of the Fuzzy method for safety assessment of shipping routes in the South China is reported in Wang et al. (Reference Wang, Li, Liu, Zhang, Zou and Cheng2014). Another promising approach is the Navigational Traffic Conflict (NTCT) method, a detailed description of the mathematical basis is reported in Debnath and Chin (Reference Debnath and Chin2010). This is an appealing alternative to the traditional approach because it is fast and reliable, with the use of this method Li et al. (Reference Li, Zhou and Zhang2015) established decision-basis rules for optimisation of geometric design and traffic organisation of precautionary areas. A method for detecting possible near miss ship-ship collisions with the use of the AIS data is proposed by Zhang et al. (Reference Zhang, Goerlandt, Montewka and Kujala2015). With an application of this method in the northern Baltic Sea, an improvement of this method is proposed by the same authors in Zhang et al. (Reference Zhang, Goerlandt, Kujala and Wang2016).
In general, many examples of different case studies of all these methodologies have been proposed. Silveira et al. (Reference Silveira, Teixeira and Soares2013) proposed a method to calculate the collision risk with analysis of AIS data off the Coast of the Portugal. used risk collision analysis to estimate that off the Norwegian coast, the use of new routes, proposed from 2008, reduced the oil spill risk by 590 tonnes per year in 2008 and by 3,670 tonnes in 2025. The use of risk analysis is also useful for waterway management authorities in decision making, an important example is reported in Wu et al. (Reference Wu, Mehta, Zaloom and Craig2016) where the purpose is a risk analysis study of the Sabine-Nenches waterway, the most important in southeast Texas. A brief review of models for risk assessment for maritime waterways are reported in Li et al. (Reference Li, Meng and Qu2012) and Goerlandt and Montewka (Reference Goerlandt and Montewka2015b).
2. METHOD
In this work, the approach used is the IWRAP tool method. The first stage is to define the number of vessels per unit time (2014 in our case), group the traffic for every route into a number of different ship classes according to vessel types (Table 1) and then for each group, divide into intervals of length of time.
Table 1. Division by classes.

The second part concerns the evaluation of causation probability and estimation of collision frequency.
In the last decade, probabilistic methods in shipping risk management have rapidly developed and more marine classification societies are focusing their regulatory framework to a probabilistic approach. The first that accepted the use of these methods was the Det Norske Veritas (DNV) with report No. 30·6 (Det Norske Veritas, 1992). In 1997, a common theme was introduced to align all European research projects, the “Design for Safety” project. This is at the beginning of research in the Risk-Based Design (RBD) field (Vassalos et al., Reference Vassalos, Oestvik and Konovessis2000). The SAFEDOR project (Anon, 2004), of four years' duration, proposed to integrate safety research in Europe to fully implement RBD from concept development to approval. Research groups also work in this theme outside Europe, especially in Japan and South Korea, with studies concerning the probability of collision with fire accident (Kaneko, Reference Kaneko2002) and total risk management system (Lee, Reference Lee2007). In 2009, the International Association of Marine Aids to Navigation and Lighthouse Authorities (IALA, 2009) proposed a tool for risk management in the ports and restricted waterways. The International Maritime Organization (IMO), with a view to improving the safety of navigation, has approved this tool as a guidance to assess risk of collision and grounding in coastal maritime traffic (International Maritime Organization, 2010).
In Fujii and Shiobara's (Reference Fujii and Shiobara1971) approach, the number of ships that would collide, if no evasive manoeuvres are made, is calculated first (in the calculations it is assumed that the ships are sailing blindly in the waterway). This number depends on several factors: the density of traffic and the geometrical distribution of the area under study, the types of traffic with the typology of ships, the ships' size and the speed inside the waterway. There are three different typologies of collisions: collision between two different ships that are sailing, respectively, along two opposite directions, (head-on collision), collision in the same lane where two ships with different velocities approach each other (overtaking collision), and collision when two ships navigate with crossing routes (crossing collision).
In the case of Head-on and Overtaking collision (Figure 1) it is necessary to have: (1) Route length (LW). (2) For every route: traffic composition, number of passages in the unit of time for the i-th and j-th class (Qie Qj), velocity for i-th and j-th class in time unit (vie vj) for each interval of length inside the class, distance between the route μ (in case of Overtaking collision this distance is zero). (3) The geometrical probability distribution of the lateral traffic spread on the route (with AIS data if available or in other case hypothesizing Gauss normal distribution with a standard deviation equal to ship length (Gluver and Olsen, Reference Gluver and Olsen1998)).

Figure 1. Head on and Overtaking Collision cases according to Otto et al. (Reference Otto, Pedersen, Samuelides and Sames2002).
The number of geometrical collisions in this case is defined by:
 $$N_{G}^{head-on} = L_{W} \sum\limits_{i\comma j} P_{Gi\comma j}^{head-on} \displaystyle{{V_{ij}}\over{V_{i}^{\lpar 1 \rpar }V_{j}^{\lpar 2 \rpar }}}\lpar Q_{i}^{\lpar 1 \rpar }Q_{j}^{\lpar 2 \rpar } \rpar $$
Each single element is described above, except Vij which is the relative velocity and PGi, j that is the probability that two ships will collide in a head on meeting situation. In case of Gauss normal distribution of the lateral traffic spread on the route, this probability is calculated with:
 $$P_{Gi\comma j}^{head-on}= {\Phi} \left(\displaystyle{{{\overline B}_{ij}-\mu_{ij}}\over{\sigma_{ij}}} \right)-{\Phi} \left(-\displaystyle{{{\overline B}_{ij}-\mu_{ij}}\over{\sigma_{ij}}} \right)$$
Φ(x) is the standard normal distribution function,
 $\mu_{{\rm ij}}$
is the mean sailing distance between two vessels,
$\mu_{{\rm ij}}$
is the mean sailing distance between two vessels,
 $\sigma_{{\rm ij}}$
is the standard deviation of the joint distribution and Bij is the average vessel breadth.
$\sigma_{{\rm ij}}$
is the standard deviation of the joint distribution and Bij is the average vessel breadth.
To handle the overtaking situation, in Equation (3), the mean value of the sailing distance is replaced by the value zero.
In the case of crossing collision the number of geometrical collisions is defined by Equation (4). In this case, the distribution in the lane is not important because, in the integration over the area, the only term that remains in the joint probability distribution is the sine of the angle between the routes θ (Figure 2).

Figure 2. Crossing collision case according to Otto et al. (Reference Otto, Pedersen, Samuelides and Sames2002).
 $$N_G^{crossing } = \sum\limits_{i\comma j} {\displaystyle{{Q_i^{\lpar 1\rpar } Q_j^{\lpar 2\rpar } } \over {V_i^{\lpar 1\rpar } V_j^{\lpar 2\rpar } }}D_{ij}V_{ij}\displaystyle{1 \over {\sin \theta }}} $$
Besides the terms already defined before, in this case, there is the apparent collision diameter Dij (Equation (5) and Figure 3) where the ships are approximated by rectangular shapes.

Figure 3. Apparent diameter according to Pedersen (Reference Pedersen1995).
 $$D_{ij} = \displaystyle{{L_i^{\lpar 1\rpar } V_j^{\lpar 2\rpar } + L_j^{\lpar 2\rpar } V_i^{\lpar 1\rpar } } \over {V_{ij}}}\sin \theta + B_j^{\lpar 2\rpar }\left\{1 -\left(\sin \theta \displaystyle{{V_i^{\lpar 1\rpar } } \over {V_{ij}}}\right)^2\right\}^{\displaystyle{1 \over 2}} + B_i^{\lpar 1\rpar } \left\{1 - \left(\sin \theta \displaystyle{{V_j^{\lpar 2\rpar } } \over {V_{ij}}}\right)^2\right\}^{\displaystyle{1 \over 2}} $$
The number of geometrical collisions, so calculated, has to be multiplied by causation probability. This number models the probability that the officer on watch does not react in time, given that he is in collision course with another vessel. It depends on several factors: human, technical and environmental.
Human failure has been commonly stated as the most typical cause group of marine traffic accidents (Guedes Soares et al., Reference Guedes Soares, Rongnstad and Olofsson1997) in many straits. An example is reported for the Turkish strait by Uğurlu et al. (Reference Uğurlu, Erol and Başar2016).
In addition to these factors that influence the causation probability there are other factors like the configuration of the considered vessel (number of officers on the bridge, instrumentation, Global Positioning System (GPS), system of collision avoidance), composition of the ship traffic in the area, presence of Vessel Traffic Service (VTS) system and presence of pilot on board, darkness, visibility and atmospheric conditions. An evaluation of the reasons for shipping casualties in the Bosphorus strait is performed by Akten (Reference Akten2004). In literature there are many values for the causation probability (Table 2), the values have been either general values for certain sea areas or reflecting certain ship types or conditions.
Table 2. Causation probability in literature.

3. CASE STUDY
3.1. Sea area and marine traffic
The Strait of Messina is an area bounded between the east coast of Sicily and the coast of Calabria on the Italian mainland. In this channel there is a particular zone that separates the city of Messina from the cities of Villa San Giovanni and Reggio Calabria; this zone is of particular interest because it has high density marine traffic. The passage of ships in this area is in a longitudinal direction (north-south and south-north) and in a transverse direction (east-west and west-east). The longitudinal passage links the Tyrrenian Sea with the Mediterranean Sea, so it is an important global route, while the transverse passage links Sicily with the Italian mainland and is mainly local traffic. The narrowest point of the Strait measures 3·1 km in width (Figure 4).

Figure 4. Strait of Messina.
Historically the area has been the scene of many accidents, sometimes with very serious consequences. In particular, 42 ship-to-ship collisions have been recorded over the last sixty years, at an average of 0·75 accidents per year (Securmed report, Gattuso et al., Reference Gattuso, Meduri and Cardinale2007) (Figures 5 and 6). However in recent years the number of collisions has dropped significantly, with an average of 0·17 collisions per year for the past 18 years.

Figure 5. Collisions 1958-2014 in the Strait of Messina.

Figure 6. Ships involved in collision in the Strait of Messina, by typology (see Table 1 for Key).
Among these accidents, in 1985 the collision between the oil tanker Patmos and the cargo vessel Castillo de Monte Aragon resulted in the loss of three crew members and the spill of 5,000 tonnes of crude oil; in 1988 the collision between the ferry FS Edra and the containership Languedoc caused injuries to 14 people; in 1993 the collision between the ferry Mongibello and the bulk carrier Maran, with the risk, fortunately avoided, of the loss of chemical products and in 2007 the collision between the high speed craft Segesta Jet and the containership Susan Brochard, with the loss of four crew members and more than 90 people injured.
Having regard to high density traffic in this area and considering the high risk of accidents, the authorities have defined a Traffic Separation Scheme published by the IMO (2009) (Figure 7). This scheme is defined by three principal parts: north sector, central sector and south sector. The north sector is a precautionary zone (Zp1).

Figure 7. Traffic separation scheme.
The central sector is defined by two principal lanes with a length of about 14 km and a width of 650 m each dedicated for longitudinal traffic (one for north traffic and one for south traffic) and separated by a wide zone of about 300 m. An important aspect of the separation scheme is the presence of a roundabout in the central sector of the area where ships, from any direction, have to respect the anti-clockwise direction and can reverse their route. The central point of the roundabout is 38° 12·680' N - 015° 36·400' E with a radius of 250 m. Inside the central sector there are two precautionary zones, one is between the coast of Sicily and the lane in south direction (Zp2) and the second is between the coast of Calabria and the lane in the north direction (Zp3). The south sector is a precautionary zone connected to the southern limit of the separation scheme (Zp4).
3.2. Data
This study was carried out with the full data from 2014 (latest data available) and concerns a period of one year. In 2014 the total number of ships in longitudinal traffic was about 14,800 units, 7,186 in the southern direction and 7,614 in the northern direction. An example of routes traveled by ships in the northern and southern directions is in Figure 8. For every direction, the ships are separated in classes and, inside the class, there is a separation by intervals of length. The principal information for every class and interval of length are: number of ships, average of Lpp (length between the perpendicular of ship), average of velocity and average breadth. A high number of intervals allows a lower value of standard deviation for each average quantity, this is because the vessels are more similar to each other within the group.

Figure 8. Longitudinal traffic – above in the southern direction and below in the northern direction.
The data allows us to see which are the principal classes of ship that sail in the Strait of Messina, in the southern longitudinal lane and in the northern longitudinal lane. The principal types of vessels that crossed the strait of Messina were Ro-Ro ships (8), general cargo (6) and container ships (5). Table 3 shows the passages of ships divided by direction and classes.
Table 3. Number and percentage of passages for classes.

During the examination of data is important to check the homogeneity. During the year, the flow of the ships is almost constant and is not affected by the winter season (Figure 9). Most of the ships sail at a speed below 15 knots (Figure 10).

Figure 9. Monthly totals for longitudinal ship traffic.

Figure 10. Number of ships divided by velocity.
An important aspect is the type of dangerous goods transported by the classes of ships. The dangerous goods transported are divided according to the IMO International Maritime Dangerous Goods Code (IMDG) regulatory framework IMO (2006). The represented hazard classes, in 2014, were explosives (Class 1), flammable liquids (Class 3), toxic and infectious substances (Class 6) and radioactive goods (Class 7). A division by month and type of dangerous goods is shown in Table 4.
Table 4. Quantity of dangerous goods divided for month.

In addition to longitudinal traffic, there is transverse traffic, i.e. the traffic that crosses the Strait in the west-east and east-west directions. The services connect Villa San Giovanni (VSG) and Reggio Calabria (RC) with Messina (ME) and Tremestieri (TREM) (Figure 11). In these services there are ferry boats, catamarans and hydrofoils (High Speed Craft -HSC).
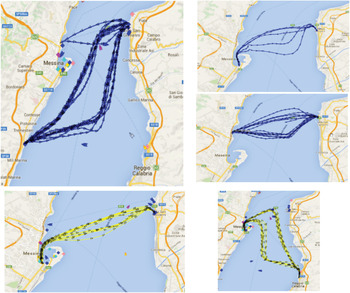
Figure 11. Transverse traffic in the Strait of Messina.
The flow in this direction is very high because there is a daily service (number of departures per month is constant) of ferry boats, catamaran and hydrofoils with a high number of daily departures. Table 5 shows the number of passages in a year with the principal characteristics of the ships. In addition to the large amount of transverse flow, the high speeds of these ships, especially for high speed craft (HSC), and also the route of these ships that are a mixture between transverse and longitudinal directions should also be considered. Another aspect is the dangerous consequence deriving from an incident between these ships because of the number of passengers carried.
Table 5. Number of passages for transverse traffic.

4. RESULTS
4.1. Numbers of geometrical collisions in the Strait of Messina
Considering the Traffic Separation Scheme (TSS) in the Strait of Messina, we analysed the following possibilities:
-
1. Head-on collision: north traffic with south traffic
-
2. Overtaking Collision: north traffic
-
3. Overtaking Collision: south traffic
-
4. Overtaking Collision inside the roundabout between ships on the transverse route
-
Crossing Collision: east/west traffic with north/south traffic
A head-on condition is calculated between the ships that cross the strait in the north-south direction, for a total amount of flow, for every lane, of about 7,500 ships. The length of the lanes is evaluated over about 14 km and the breadth is 650 m for each lane, with a median distance μ of 950 m. The total number of collisions, resulting by the sum of every kind of ship, is about six (Figure 12). The highest number of geometrical collisions is relative to container ships and ferry boats. It is clear that these values are dependent on the quantity of passages for the respective classes.

Figure 12. Geometrical collision divided by classes – the sum is six.
The over-taking condition is evaluated in three different lanes: the north-going lane (Figure 13), the south-going lane (Figure 14) and inside the roundabout. It is clear that, for the overtaking condition, the total amount of collisions is higher than the head-on one, because the mean sailing distance is zero. In particular for north-going direction the total amount is 506, for south-going direction is 456 and in roundabouts, where there are only ferry boats, is 252.

Figure 13. Overtaking collision in north-going traffic – the sum is 506.

Figure 14. Overtaking collision in south-going traffic - the sum is 456.
In the Strait of Messina, the geometrical crossing collision is the most dangerous condition because there is a high flow in the transverse direction (about 100,000 passages per year) due to the presence of ferryboats, catamarans and other HSC. The total number of geometrical collisions in this case is 3,833 (Figure 15).

Figure 15. Crossing collisions – The sum is 3,833.
4.2. Causation probability in the Strait of Messina
The Strait of Messina, although very busy, has a quite limited coefficient of risk compared to other European, American and Japanese straits, because generally it has favourable weather conditions. Furthermore, the Strait is equipped with VTS (Italian Ministry of Infrastructure and Transport from 2 October 2008) and pilotage (Italian Ministry of Infrastructure and Transport from 30 September 1998). The causation probability is corrected with this in mind with the coefficients in Table 6 applying the methodology used by Hänninen and Kujala (Reference Hänninen and Kujala2012). Coefficients greater than 1 indicate a decreased probability that no evasive manoeuvres are done during the collision event, those less than 1 indicate an increased probability.
Table 6. Correction coefficients in Strait of Messina.

The VTS effect generally varies from 2 to 3 (Olsen et al., Reference Olsen, Gotfredsen and Fujii1992; Hänninen and Kujala, Reference Hänninen and Kujala2012). For the evaluation of the effect of pilotage, there are numerous studies. The relative correction coefficient essentially depends on the familiarity of pilots with the sea area and from the number of ships in which the presence of the pilot on board is mandatory (Hänninen and Kujala, Reference Hänninen and Kujala2012). In the Strait of Messina the pilots are local and they are mandatory for every ship of gross tonnage of more than 15,000 tonnes and for every tanker with oil products or dangerous goods of more than 6,000 tonnes. For these types of passages (that represents 54·6% of the longitudinal transits and the totality of the transverse) a multiplication factor of six has been considered.
The wind effect is evaluated considering a multiplicative factor of three for the number of the days in a year in which the limit of 11·5 m/s is exceeded (Figure 16).

Figure 16. Wind condition in the Strait of Messina. The dashed red line shows the critical wind speed.
The visibility effect is evaluated as the number of days in a year with a visibility less than 1 nm, according to Hänninen and Kujala (Reference Hänninen and Kujala2012). In the Strait of Messina, this happens on average less than one day per year, so the correction coefficient is equal to 1. Visibility and wind conditions are reported from a study conducted by the Port Authority of Messina (Meteo marine study (2007)).
The influence of darkness is evaluated as a function of the ratio of day and night transits in the Strait. In particular, it may be noted that transverse traffic decreases strongly during the night due to the reduced local traffic and interruption of the HSC service (Table 6). Fujii and Mizuki (Reference Fujii and Mizuki1998) suggest using a multiplicative factor of four if the transits in the darkness are 30% of the total.
The final operation is to multiply the geometrical collision with the causation probability, so we obtain the number of incidents per unit time, in our case in one year.
Table 7. Dark and daylight passages.

This work takes into account the main characteristics of the Strait of Messina (traffic separation scheme, wind, pilot, VTS, darkness) for the evaluation of causation probability. However it is important to analyse the uncertainty of the results in order to estimate the level of confidence (Goerlandt and Reniers, Reference Goerlandt and Reniers2016). A very simple method for uncertainty assessment qualitatively is suggested by Goerlandt and Montewka (Reference Goerlandt and Montewka2015b). This consists of identifying qualitative indicators and assigning, for each of them, an answer (Yes/No) to the questions in the Table 8.
Table 8. Uncertainty assessment questions.

Depending on the given answers, an uncertainty rating between L (Low), M (Medium), and H (High) was assigned. The results are summarised in Table 9.
Table 9. Uncertainty assessment.

A more detailed analysis, in the specific framework of the Strait of Messina, for the forecasting of events such as human error, fault in maneuverability apparatus or a particular meteorological condition is a possible route for future work.
5. DISCUSSION
In Figure 17 there is a comparison between the causation probability in the Strait in various conditions (with or without VTS and pilotage) and a comparison with the average data in published literature.

Figure 17. Comparison of Pc in various conditions.
The true condition in the Strait is, naturally, VTS and pilotage. The impact of the presence of pilotage is higher than VTS system, but the simultaneous presence of both reduce the causation probability by almost an order of magnitude.
We can see that, with VTS and pilotage, the reduction of possible accidents is very high, from 1·55 collision for year to 0·14 (Figure 18).

Figure 18. Number of collisions in one year.
It is important to underline that the current condition of VTS in the Strait (since 2008), traffic separation scheme (since 2009) and compulsory pilotage (since 1998) has led to a drastic reduction of the expected collisions.
The obtained annual number of expected collisions of 0·14 collision/year is very similar to the reported statistic of 0·17 collisions/year observed in last 18 years due to these important regulatory safety improvements. In this way it is possible to forecast, hopefully, that the number of accidents in next 50 years will decrease significantly.
Gattuso et al. (Reference Gattuso, Napoli and Meduri2009) have found a bigger number of expected collisions in the Strait, about 0·36 collisions/year. Their methodology is that of Kristiansen (Reference Kristiansen2005) that is an analytical approach based on the statistical distribution of ships on a set of network nodes. In that study, the configuration of the traffic separation scheme, in particular of the roundabout, is not considered because it entered into force shortly afterwards. Furthermore, the effect of pilotage was not considered and is not possible to evaluate the influence of meteorological conditions and VTS presence.
However, the convergence of the results, despite applying a different method, confirms the reliability of this work. The study is updated with the latest regulatory requirements and with the latest traffic data, allowing a possibility of analytical assessment of individual factors that influence the global risk of collision in the Strait.
Other important aspects that can be evaluated are the consequences of a collision in the Strait area, in terms of environmental impact and human losses. Thanks to an evaluation of the numbers of collisions in one year and knowing the division of the hazardous goods transported by the ships (Table 4) it is possible, in future work, to postulate the most dangerous accidents and their consequences.
6. CONCLUSIONS
The application of probabilistic methods in maritime traffic analysis is not yet applied to many straits. In this study the Fujii and Shiobara (Reference Fujii and Shiobara1971) approach is applied as improved in the IWRAP (IALA, 2009) model, in the Strait of Messina on the basis of the traffic observed in one year (2014). This approach has been used because it is very simple and reliable and is also useful when AIS data are not available.
The obtained values in this study show that, thanks to VTS (in the Strait since 2008), traffic separation scheme (since 2009) and pilots for ships over 15,000 GT (since 1998), the number of expected collisions has decreased by about 90%.
The more frequent typology of expected collisions is in crossing. This is because, every year, there are about 17,000 longitudinal passages and almost 100,000 transverse passages. The consequences of this kind of accident could be very high because the transverse traffic consists almost exclusively of passenger ships.
The Strait of Messina is currently the subject of infrastructural and organisational changes, due to the opening of new piers in the south and the management of both shores in a single port authority.
This type of study highlights the most important sources of risk. It is the necessary basis for the organisation of the services that regulate the traffic, with the aim of improving safety and regulations and of testing the effectiveness of the traffic separation scheme. These results can be a starting point, for the decision makers, to forecast the consequences of future changes.


