1. INTRODUCTION
This paper is concerned with quantifying the ship traffic flow through a traffic separation scheme (TSS) exemplified by the intense traffic on the main navigational route in Fehmarnbelt between Denmark and Germany in Northern Europe, where the international navigational rules apply. We focus on a situation where a TSS is proposed in relation to a bridge with two main spans; one for eastbound and one for westbound traffic. Crossing traffic is not considered, but assumed to obey the rules of a TSS as defined by the International Maritime Organisation (IMO) (COLREG, 1972). A restriction of navigational freedom may result in more uncomfortable situations for the involved navigators, and we propose a paradigm for estimating the degree to which freedom of navigation is reduced by the introduction of a TSS with a given width and length.
The conventional method to determine the required width of a fairway, e.g. a TSS, is based on a maximum sized ship whereas the ship traffic density and the traffic flow are often not taken into account. Numerous studies have been performed to assess the safety related to navigating through difficult waters; often using the ship domain theory first defined by Fujii et al. (Reference Fujii and Tanaka1971) and Goodwin (Reference Goodwin1975), and formalized by Fujii, et al. (Reference Fujii, Yamanouchi and Matui1984). Several people have since worked with different types of ship domains; see Wang, et al. (Reference Wang, Meng, Xu and Wang2009) for a survey and a theoretical framework for a unified ship domain theory. The concept of ship domain theory is to describe an area around a ship that the ship navigator tries to keep clear of other ships and obstacles in order to ensure a safe voyage.
Ship domain theory has recently been used as an input to the design of a new TSS in the western Baltic Sea. This work was performed under the Sub-Committee on Safety of Navigation under IMO (NAV51, 2005), and ship domain theory was used to estimate the number of near-miss situations.
Ship domain theory has also previously been applied in connection with bridge design in Danish waters. Frandsen, et al. (Reference Frandsen, Olsen., Lund, Bach and Gerwick1991) focused on evaluating the minimum required bridge spans in relation to the construction of the Great Belt Bridge where a two-way traffic separation scheme (TSS) is set up. The study includes an estimation of the number of close vessel encounters as a function of the bridge span. The estimation is performed by simulating traffic through the bridge opening.
Modelling of traffic flow has been done for decades, e.g. for road traffic and air traffic. However, modelling of marine traffic flow is only recently emerging in literature; see Yip (Reference Yip2013) for a discussion of the special issues concerning marine traffic such as varying ship sizes and types, water current and draft restrictions, and for a mathematical model for marine traffic flow based on classical flow models. In another recent paper, a simulation approach is used to model marine traffic flow using an algorithm to describe collision avoidance. The approach is used to estimate the number of ships per hour to allow through fairway widths related to the main ports of Korea (Seong, et al., Reference Seong, Jeong and Park2012).
In this paper, we first describe the development of a new “free flow” paradigm based on the ship domain theory. Then we present a procedure to estimate the number of ships that experience “free flow” when using a given traffic lane. Finally, an example is shown for the situation in Fehmarnbelt in relation to the proposed bridge. The results of the analysis were used in the Fehmarnbelt project as valuable input to the design basis for the bridge.
2. ELLIPSE THEORY AND THE “FREE FLOW” PARADIGM
The ship domain described by Fujii, et al. (Reference Fujii, Yamanouchi and Matui1984) is elliptical, with the ship placed in the centre of the ellipse. This ellipse is based on analyses of a large set of ships and is often assumed to be the best empirical, general size of ship domain for ships sailing at navigation speed. However, in practise, the size of the ship domain depends on a number of factors such as the type of object to be avoided, the speed of the ship, and the navigational conditions. A reduced ship domain is often used to describe the distance between ships in narrow straights or harbours; see Appendix 2 in Mizuki and Fujii (Reference Mizuki and Fujii1997). The size and shape of the ship domain may also depend on the intended use. Moreover, there are several ways to estimate or define a ship domain; see Pietrzykowski & Uriasz (Reference Pietrzykowski and Uriasz2009).
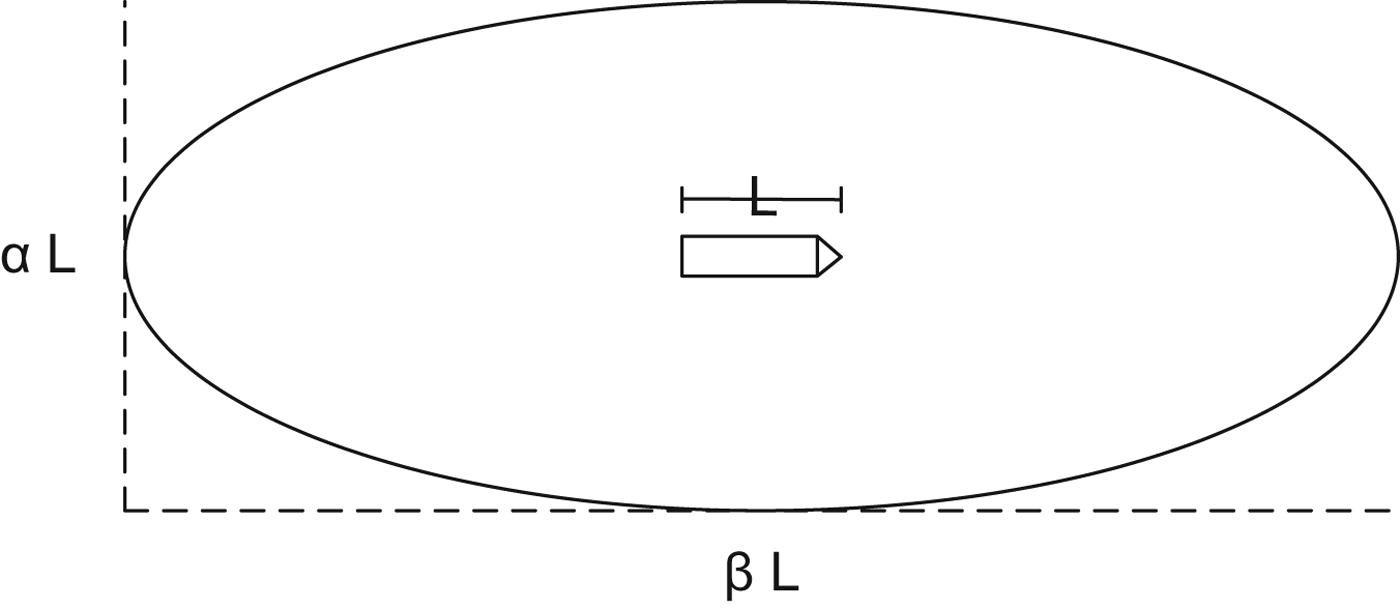
There is no direct link between violation of the ship domain and dangerous situations that lead to collisions or groundings. However, violation of the ship domain indicates that the distance to another ship or obstacle is “small” and that the situation may feel uncomfortable for the navigator of the ship. Comprehensive analyses of the ship traffic in Fehmarnbelt and other areas in Denmark have shown that an ellipse similar to Fujii's original ship domain describes well the minimum distance that ships tend to keep from one another; see Hansen et al. (Reference Hansen, Lehn-Schiøler, Melchild, Jensen, Rasmussen and Ennemark2013). Hansen et al., therefore define the “comfort ellipse” as the ship domain describing the area which most navigators try to keep free of other ships and obstacles in an unrestricted navigational situation. The ellipse is hence assumed to reflect a desired and comfortable distance between ships. The comfort ellipse is shown in Figure 1, and the parameters α and β are empirically defined to be α=3·2 and β=8.

Figure 1. Schematic illustration of the comfort ellipse around a ship with length L.
The estimate of the size of the ellipse is based on ships observed on the main navigational route through Fehmarnbelt and in other areas in Denmark. For simplicity, we use the same comfort ellipse for all ships regardless of ship speed and weather conditions. Studies of the robustness have also been performed; see Hansen et al. (Reference Hansen, Lehn-Schiøler, Melchild, Jensen, Rasmussen and Ennemark2013). We stress that the comfort ellipse should be verified for a given navigational area before the free flow paradigm is applied.
2.1. “Free flow” paradigm
The free flow paradigm is based on a hypothesis and a definition, and related to navigation through an area with navigational restrictions or difficulties such as a TSS.
Hypothesis: “By their navigation of ships, navigators will in due time position ships such that the comfort ellipses are not violated given that sufficient space is available.”
Definition of “free flow”: “Ships have free flow if they can pass through the restricted area at unchanged speed and without violating the comfort ellipses.”
For a TSS, the restriction lies in the width and length of the TSS. A ship with free flow will proceed through the TSS at constant speed, neither entering the comfort ellipses of other ships, nor proceeding such that it will let other ships or fixed obstacles into its own comfort ellipse; see also Hansen, et al. (Reference Hansen, Lehn-Schiøler, Melchild, Jensen, Rasmussen and Ennemark2013). Lack of free flow occurs when continuing at constant speed leads to a violated comfort ellipse. We emphasize that free flow requires unchanged speed, but allows for ships to position themselves to be able to pass one another. In practise, the lack of free flow does not necessarily lead to violation of comfort ellipses as navigators may choose to reduce speed in order to maintain the comfort ellipses. Therefore, the free flow is a measure of the crowdedness and hence a proxy to express the efficiency of a traffic lane compared to an unrestricted situation where sufficient space is available. We will now study a number of situations.
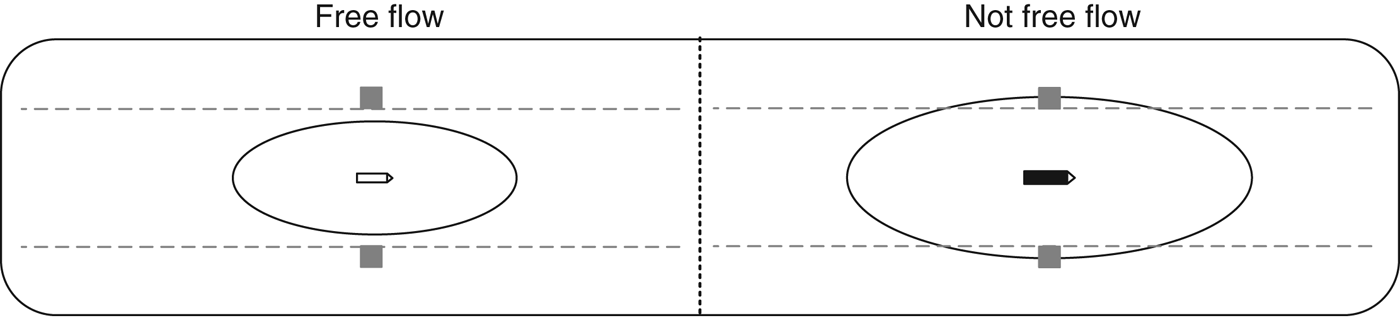
The simplest situation involves one ship passing through a one-way traffic lane. The ship has free flow if its comfort ellipse is not wider than the width of the lane. The width W 1 required by a single ship is given as:
 $$W_1 = \alpha l_1 $$
where α is the parameter describing the width of the comfort ellipse and l 1 is the length of the ship. Ships above a certain size will therefore experience lack of free flow as their comfort ellipse is wider than the lane width. Simple situations indicating free flow and lack of free flow are seen in Figure 2.
Figure 2. Examples of simple situations showing free flow and lack of free flow when one ship passes through a one-way traffic lane between two bridge pylons.
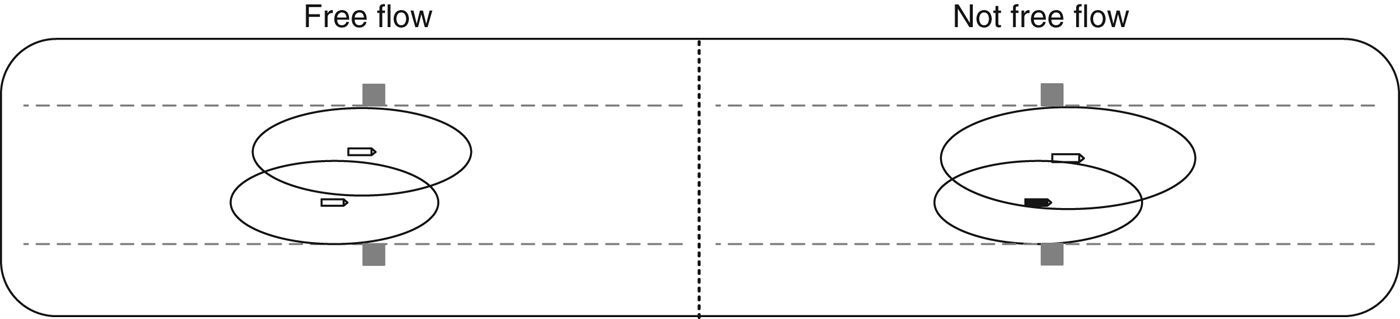
Two ships using the traffic lane at the same time will both have free flow if they can arrange themselves such that they keep their comfort ellipses free of other ships and obstacles without reducing speed. This is the situation in the left part of Figure 3; i.e. the comfort ellipses can overlap as long as the ships do not enter into each other's ellipses. The width W N required by two or more ships which come close to each other when continuing at unchanged speed through the length of the TSS is in general given as:
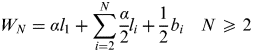 $$W_N = \alpha l_1 + \sum\limits_{i = 2}^N {\displaystyle{\alpha \over 2}} l_i + \displaystyle{1 \over 2}b_{i} \quad N \geqslant 2$$
where α is the parameter describing the width of the comfort ellipse, l 1 is the length of the longest ship, l i and b i are the length and breadth of the smaller ships, and N⩾2 is the number of ships passing each other. The right part of Figure 3 shows a situation where the ship coming from behind has to enter into the comfort ellipse of the ship in front in order to proceed at constant speed. In this case, the ship in front is considered to have free flow, whereas the ship coming from behind has not.
Figure 3. Examples of free flow and lack of free flow for two ships sailing concurrently through a one-way traffic lane between two bridge pylons.
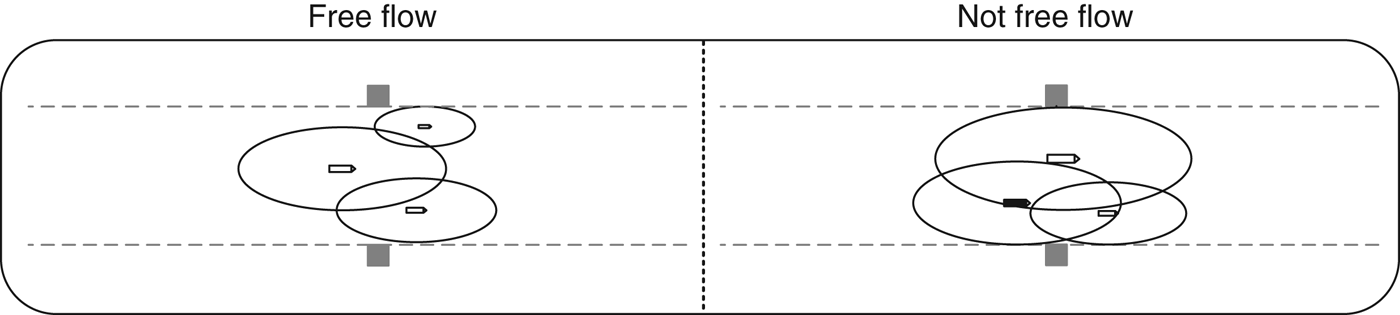
More concurrent ships lead to more complex situations. Two situations are shown in Figure 4 for three ships sailing concurrently through a one-way traffic lane between two bridge pylons. All three ships have free flow in the situation to the left, whereas the ship coming from behind in the situation to the right does not have free flow and therefore needs to reduce speed in order not to violate the comfort ellipses. If it does not change speed, it will enter into the comfort ellipse of the larger ship and get the smaller ship in front into its own comfort ellipse.
Figure 4. Examples of free flow and lack of free flow for three ships sailing concurrently through a one-way traffic lane between two bridge pylons.
The lack of free flow is attributed to the last ship in a group of ships that do not have free flow, i.e. the ship which is able to resolve the situation by reducing its speed.
2.2. Fraction of ships with free flow
All ships have free flow in an unrestricted situation with enough navigational space. The result of introducing a TSS is that the navigational space is reduced, and that some ships may no longer have free flow. Some ships may be too large to pass through the traffic lane without violating their comfort ellipse, but restrictions of free flow in densely trafficked waters are often due to the presence of other ships. A reduction of the free flow does not directly lead to more dangerous situations as the number of dangerous situations and collisions depend on the next actions taken by the navigator of the ships that experience a lack of free flow, and on the awareness of the navigator. However, the lack of free flow is an indication of the disturbance of the otherwise unrestricted ship traffic. Hence, the free flow can be used to estimate the efficiency of the TSS in terms of getting the traffic through without hindrance.
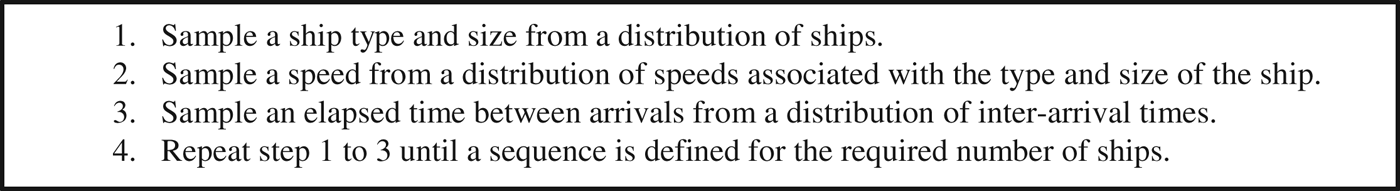
The fraction of ships that experience free flow is computed by analysing a sequence of ships sailing through a traffic lane of a given width and length. The analysis can be performed on observed or simulated sequences of ships, and traffic prognoses can be taken into account when using simulated sequences. A simulated sequence of ships arriving at the entry point of the proposed TSS can be successively defined by following the procedure in Figure 5.
Figure 5. Procedure for sampling a sequence of ships.
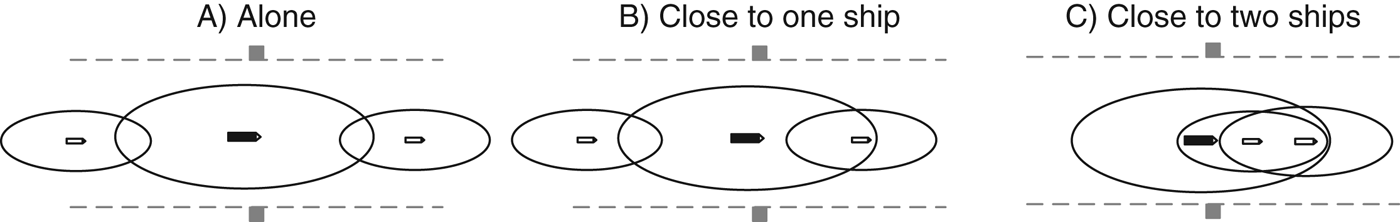
The number of ships and obstacles that are close to each ship in the sequence (observed or sampled) when it passes through the TSS is counted. A ship may be able to get through the TSS alone or meet with one or more ships on its way. Three situations are shown in Figure 6.
Figure 6. Examples of a ship passing through a one-way traffic lane: (A) alone, (B) close to one other ship, and (C) close to two other ships.
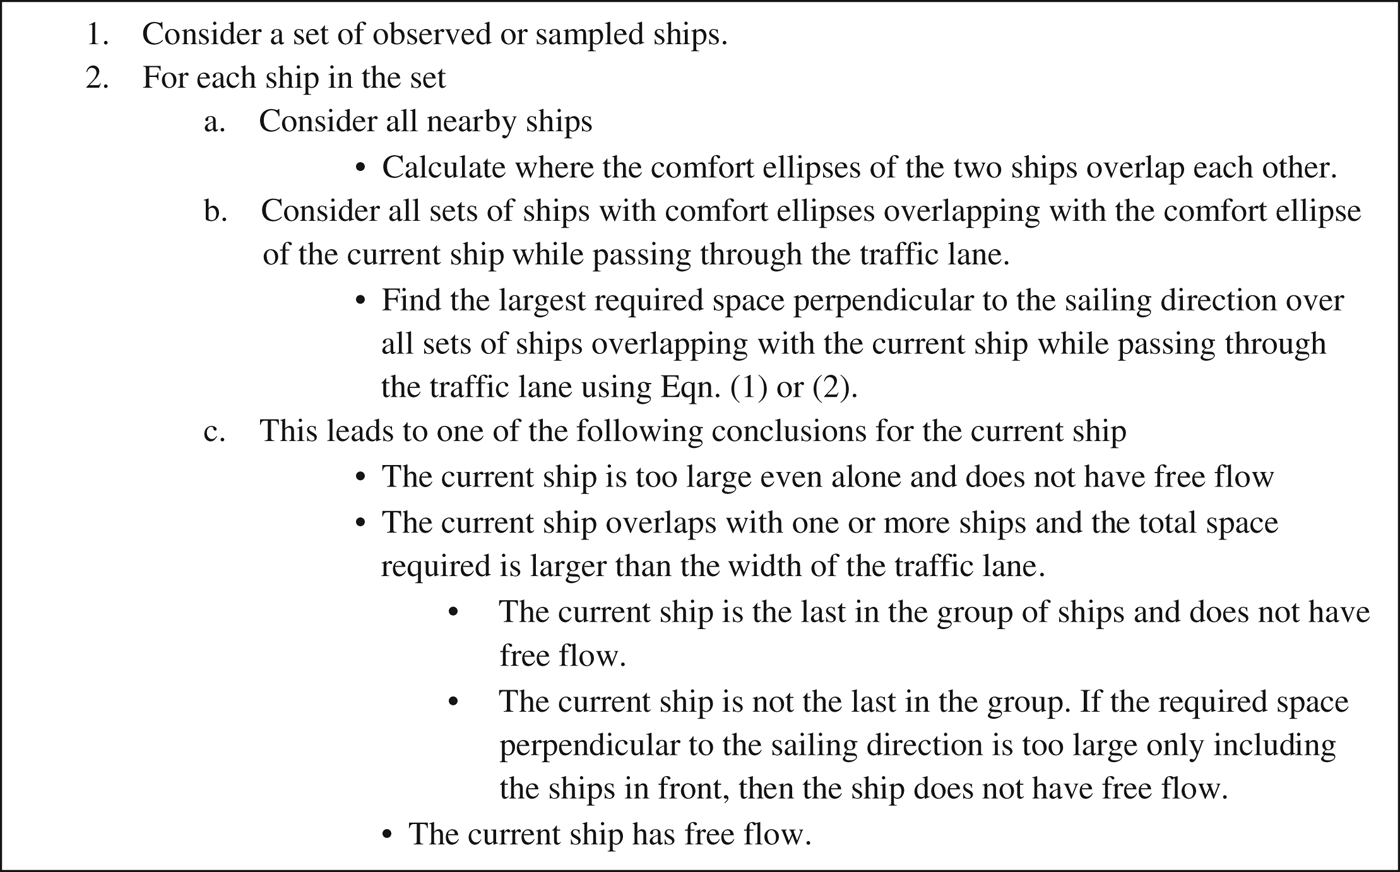
Estimating the number of ships that are close to the current ship in the sequence is based on the time of arrival to the TSS for the various ships as well as the speeds of the ships and the length of the TSS. The fraction of ships having free flow can be found by applying the free flow paradigm to each ship in the sequence. An outline of the algorithm for identifying the number of ships having free flow is seen in Figure 7.
Figure 7. Procedure for analysing the free flow for each ship in a sequence.
The algorithm identifies for each ship in the sequence the largest space required as it meets with other ships from the sequence while passing through the traffic lane.
3. EXAMPLE FROM FEHMARNBELT
The conceptual design of a proposed bridge across Fehmarnbelt between Denmark and Germany forms the background of the example presented here. Fehmarnbelt is densely trafficked and one of the two main entrances to the Baltic Sea; the other entrance goes through the sound between Denmark and Sweden. Most large vessels, including large oil tankers, go through Fehmarnbelt due to depth restrictions in the Drodgen channel between Denmark and Sweden. Fehmarnbelt is international water and passage is regulated by international conventions such as COLREG (1972) and SOLAS (1974). SOLAS is concerned with the safety of life at sea, and navigational rules are defined in COLREG.
A proposed cable-stayed bridge across Fehmarnbelt has a total length of about 18 km and consists of two approach bridges and a main bridge. The main bridge has two main spans that the commercial ship traffic is intended to pass through. We compute the amount of free flow for a TSS in Fehmarnbelt between Denmark and Germany, and focus on the westbound lane. The width of the traffic lane is related to the distance between the pylons of the proposed bridge, and the length of the TSS is fixed to two nautical miles. On one hand, the distance between the pylons is important from an economical point-of-view as a larger main span in general results in higher construction costs. On the other hand, the bridge is projected to stand for at least the next 100 years, and it is crucial to maintain a suitable passage open for the commercial traffic to and from the Baltic Sea – also taking into account the possible future increase in ship traffic. An analysis of the efficiency of the navigational route through the TSS is therefore important as part of the overall evaluation of the bridge design.
3.1. Modeling traffic flow
We simulated the traffic flow for the main navigational route through Fehmarnbelt based on empirical distributions of ship types and sizes, sailing speeds, and the inter-arrival time between ships. This information was obtained by analysing AIS data. SOLAS requires that all ships larger than 300GT engaged on international voyages carry AIS (SOLAS, 1974). Cargo vessels larger than 500GT not engaged in international voyages and all passenger ships regardless of size are also required to be fitted with AIS equipment. AIS messages submitted from the vessels contain information such as speed over ground, size and ship type. These data were used to find distributions of ship types and speed over ground for all ships sailing along the main navigational route. Vessels not fitted with AIS equipment are smaller vessels such as fishing vessels and pleasure craft. These vessels will generally not follow the main navigational routes and hence not be restricted by the TSS.
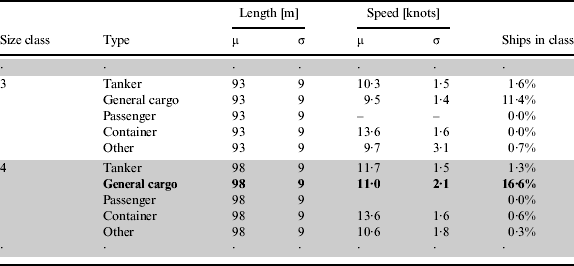
Table 1 shows an extract of the analysis of the ship traffic in Fehmarnbelt. The list is distributed according to ship sizes and types. For instance, there is a 16·6% chance that a ship arriving at the entrance of the TSS is a general cargo ship with an average length of 98 m and an average speed of 11 knots.
Table 1. Extract of analysis of ships in Fehmarnbelt based on AIS data.
The AIS messages also contain time stamps and accurate information on the location of the ships. Hence it is possible to find the time of arrival at the entry point of the proposed TSS. This is used to statistically describe the inter-arrival time between ships at the entrance of the TSS.
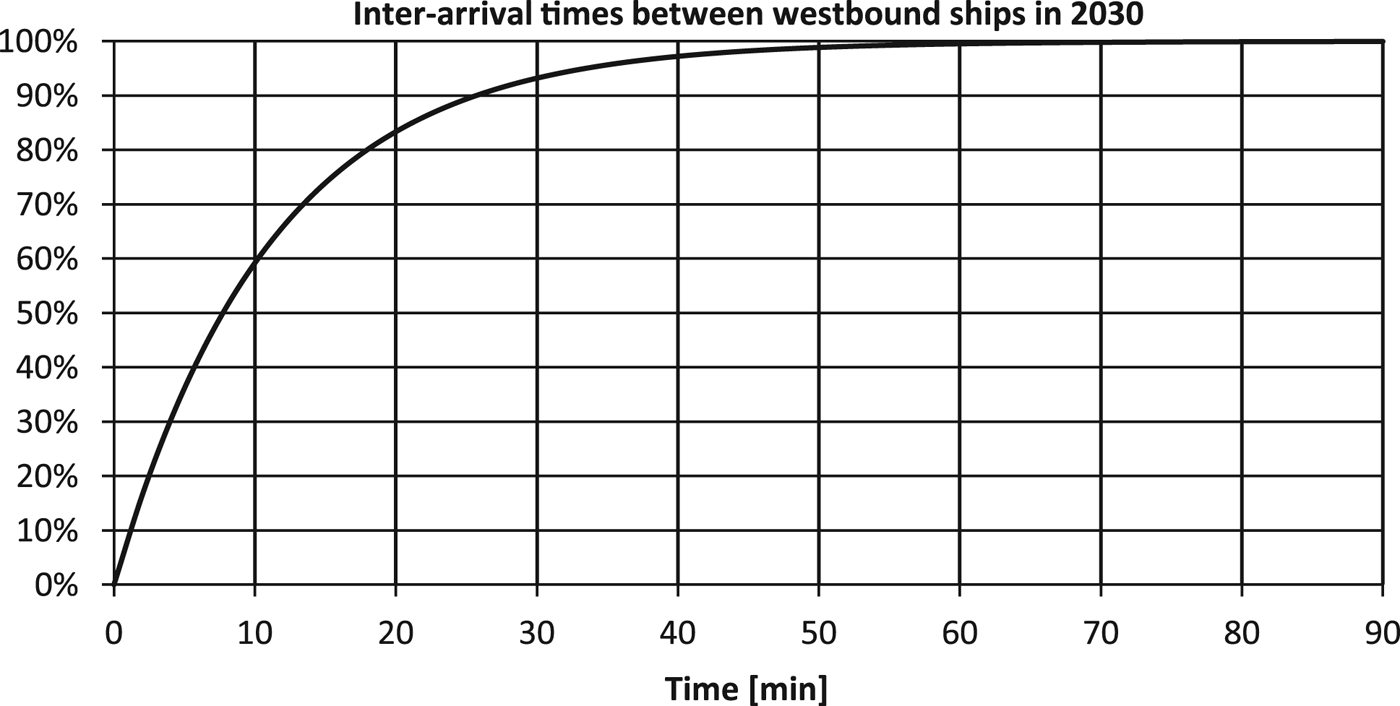
The inter-arrival times are analysed and found to be independent and with no correlation to the time of year or day. The time between ship arrivals is therefore exponentially distributed. Figure 8 shows the distribution of inter-arrival times based on a traffic intensity of 47,140 ships per year as estimated for 2030.
Figure 8. Cumulative distribution of inter-arrival times for westbound ships at the entrance of a proposed TSS in Fehmarnbelt.
The traffic intensity is seen to be high. That is, in 50% of the cases, there will be about 8 minutes or less between arriving ships.
3.2. Results
The free flow paradigm is used on a simulated dataset from Fehmarnbelt where the total number of westbound ship movements is forecasted to be 47,140 in 2030; i.e. reflecting the ship traffic over a year after construction of the bridge. The simulated number of nearby ships for each westbound ship is reported in Table 2 for a TSS which is two nautical miles long and separates the traffic in two traffic lanes that are 850 m wide. The width of the lanes is related to a distance between the bridge pylons of 888 m (centre to centre).
Table 2. Number of ships close to other ships while passing through the westbound traffic lane.
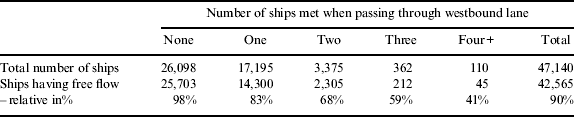
The first column shows that 98% of the ships passing through the westbound lane alone will have free flow. Hence, 2% of these ships are too large to fit even when passing alone. The next column shows the cases where ships meet two ships while passing through the westbound lane. The uneven number of ships reflects that one ship may appear in pairwise constellations with several other ships. About 67% of the ships can pass the other ship without violating the comfort ellipses, and both ships have free flow. For the remaining 33% of the ships, the ship coming from behind has to reduce speed in order not to violate the comfort ellipses. Hence only half of these ships (about 17% of all ships) have free flow. This results in a total of 83% of the ships in pairwise constellations having free flow. On rare occasions, both ships are too large to pass even alone. The contribution from these cases is insignificant.
The situation gets more complex when more ships are close to each other. For instance, none, one, two, or all three ships may have free flow when a ship meets with two other ships when passing through the lane. A summation of the cases shows that 68% of all ships that meet two other ships have free flow. The same is the case for 59% of the ships that meet with three other ships and 41% of the ships that meet with four or more ships. In total, 90% of the ships that pass through the westbound lane are estimated to experience free flow.
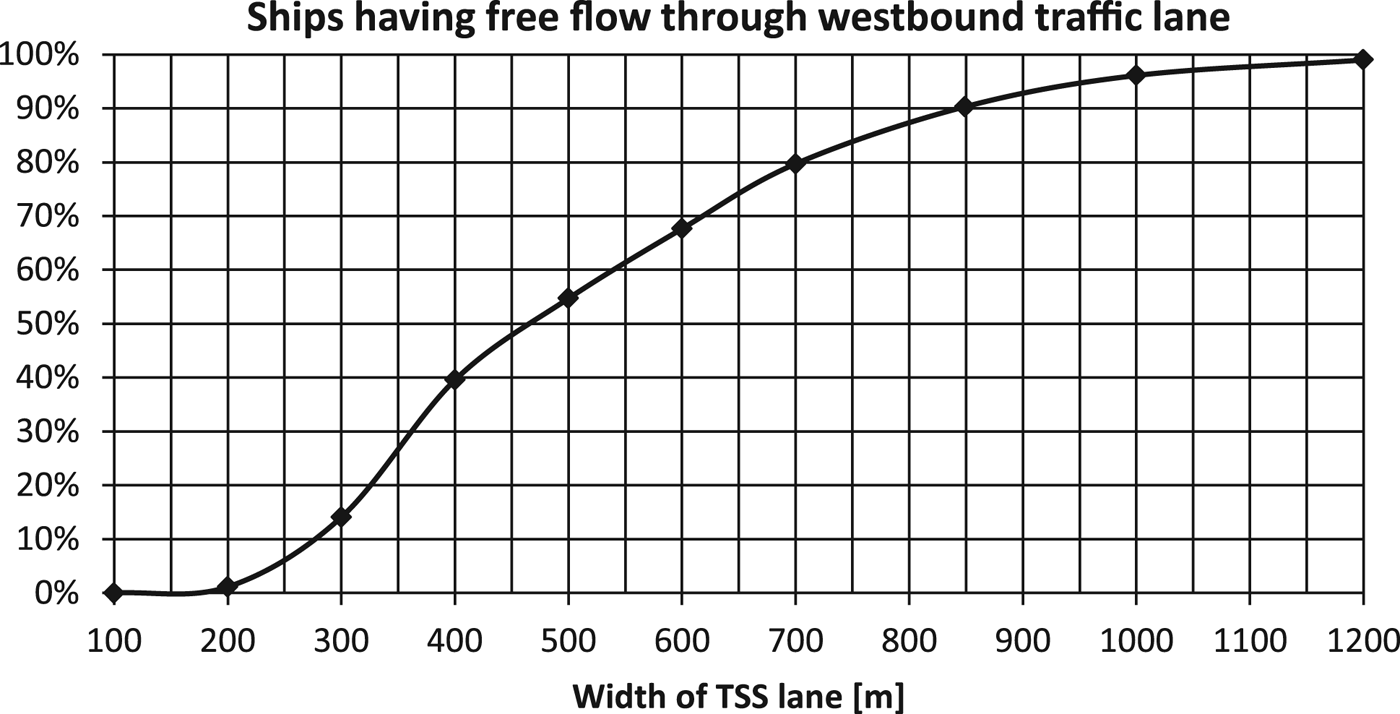
The total fraction of ships experiencing free flow can be calculated for any width of the traffic lane. The free flow is shown as a function of the width of the westbound traffic lane in Figure 9.
Figure 9. Percentage of ships with free flow when using the westbound traffic lane of a certain width.
The analysis shows that a reduction of the lane width from 850 m to 700 m results in a doubling of the number of ships without free flow from 10% to 20%. A further reduction of the width leads to a higher impact for the ship traffic. Only about 14% of the ships are estimated to experience free flow if the width of the lane is reduced to 300 m, and a width of more than 1200 m is needed to ensure free flow for more than 99% of the ships.
3.3. Justification through observations and real-time simulation
The concept of free flow has been developed by observing the traffic through the Great Belt where an existing bridge forms a similar obstacle to the ship traffic. A TSS is also established here with two separate traffic lanes. Observations reveal that navigators reduce speed in order to maintain a comfortable distance from other ships. The VTS personnel monitoring the Great Belt Bridge area confirm these observations. Observations from the Great Belt were also used as the basis for selecting span widths and scenarios for real-time simulations where ship navigators sailed through the Fehmarnbelt with a virtual bridge in a ship simulator. Reducing the span width from 850 m to 700 m in the simulations did not seem to influence the navigators' opinions on whether passing the bridge was safe. However, significantly more speed reductions were seen, indicating less free flow as the navigators reduced speed to keep a comfortable distance.
4. CONCLUSION
The “free flow” paradigm is presented as a statistical approach for estimating the efficiency of a traffic separation scheme (TSS) with separate lanes for traffic in opposite directions. The free flow analysis is used to estimate the fraction of ships that are able to sail through a traffic lane at constant speed without getting too close to other ships or fixed objects. Evaluation of the disturbance is based on the ship domain theory and the establishment of a “comfort ellipse” which is an empirically found area around each ship describing a comfortable distance to other ships and fixed objects. The free flow efficiency estimate is valuable when assessing the impact of a new TSS on otherwise unrestricted ship traffic. The analysis was developed as part of the preparatory analyses related to a proposed bridge across Fehmarnbelt between Denmark and Germany. The location of the bridge pylons determines the width of the traffic lanes of a related TSS and cause restrictions for the ship traffic. Different bridge designs result in different placement of the pylons. The results from the free flow analysis in the present paper were used as valuable inputs to the bridge design phase. In general, the free flow paradigm can be used to assess the efficiency of any fairway. Further research may be carried out to extend the free flow analysis to cases with two-way traffic without separation and more complex paths, for example, to analyse the ship traffic flows in canals.
ACKNOWLEDGEMENTS
We thank Professor Jens Froese and Professor Preben Terndrup Pedersen for many fruitful discussions and comments throughout the development of the free flow analysis.