


1. INTRODUCTION
Air Traffic Control (ATC) is the process of providing a safe, expeditious and orderly flow of traffic in a designated portion of airspace (ICAO, 2001). Depending on the region where ATC services are provided, a distinction is made between airport, approach and area control. Area Control Centres (ACCs) control the air traffic flows outside the airports and their vicinities, which typically correspond to the en route phase of operation. ACCs cover large regions of airspace and employ a large amount of resources (mainly controllers). Therefore, ACCs are playing a fundamental role in ensuring a cost-efficient ATC system.
ACC cost-efficiency is an indicator that describes the ability of ATC to manage the available resources to meet performance standards in the most cost effective manner (Tobaruela et al., Reference Tobaruela, Majumdar, Ochieng, Schuster and Hendrickx2013). Given the present economic climate, cost-efficiency has become a key performance driver of the air transport system. The European Commission (Commission, Reference Commission and UNION2011) set performance targets for different time-frames. For instance, during the reference period (2012–2014), the cost-efficiency target, expressed as the ratio of cost to traffic (Commission, Reference Commission and COMMISSION2010) is to reduce the determined costs for air navigation services per flight from 59·97€ in 2011 to 53·92€ in 2014.
In order to understand how these targets can be achieved, it is necessary to examine the drivers of ACC cost-efficiency. ACC costs can be divided into the following elements (SESAR, 2008; PRC, 2012): operating costs (either staff or non-staff related such as delay costs), depreciation and costs of capital. This paper focuses on the operating cost-efficiency, which is fundamentally driven by the efficient management of Air Traffic Control Operators (ATCOs). This efficiency is in turn a function of the accuracy of the ACC planning process and the management of the airspace and planned ATCOs on the day of operation.
The paper develops a framework (Section 5) to estimate the ACC operating cost-efficiency, on the basis of the parameters identified above. It builds upon the framework in Tobaruela et al. (Reference Tobaruela, Majumdar, Ochieng, Schuster and Hendrickx2013) to assess the accuracy of the planning process and creates a set of metrics to assess the performance of the management of the airspace (AirSpace Management - ASM - function) (Section 6). The framework is tested in one of the busiest ACCs in Europe, the Maastricht Upper Area Control (MUAC) centre (Section 7), described in the next section.
2. MAASTRICHT UPPER AREA CONTROL (MUAC) CENTRE
The MUAC centre controls the traffic above 24 500 feet (upper airspace), extending over an area of 260 000 km2 over Belgium, the Netherlands, Luxembourg, north-west Germany and the neighbouring areas of the North Sea. Its location, broadly referred to as the core European area, makes it the second busiest ATC centre in Europe, controlling around 1·5 million flights per year, with flows arriving and departing from the four main European airports: London Heathrow, Amsterdam Schiphol, Paris Charles de Gaulle and Frankfurt airport.
Regardless of its high structural and traffic complexity MUAC has been ranked over the years as the most cost-efficient centre in Europe (EUROCONTROL, 2006), which makes this ACC a perfect case study for a detailed cost-efficiency analysis.
MUAC airspace is divided into three different sector groups: Brussels (Koksy, Olno, Nicky and Luxembourg sectors), Hannover (Ruhr, Munster, Celle and Solling sectors) and DECO (Delta, Jever and Holstein sectors) (see Figure 1). Each sector group is independent from the others in terms of ATCO licensing, procedures and planning activities, although they share the same Controller Working Positions (CWP) with exactly the same tools and levels of automation.
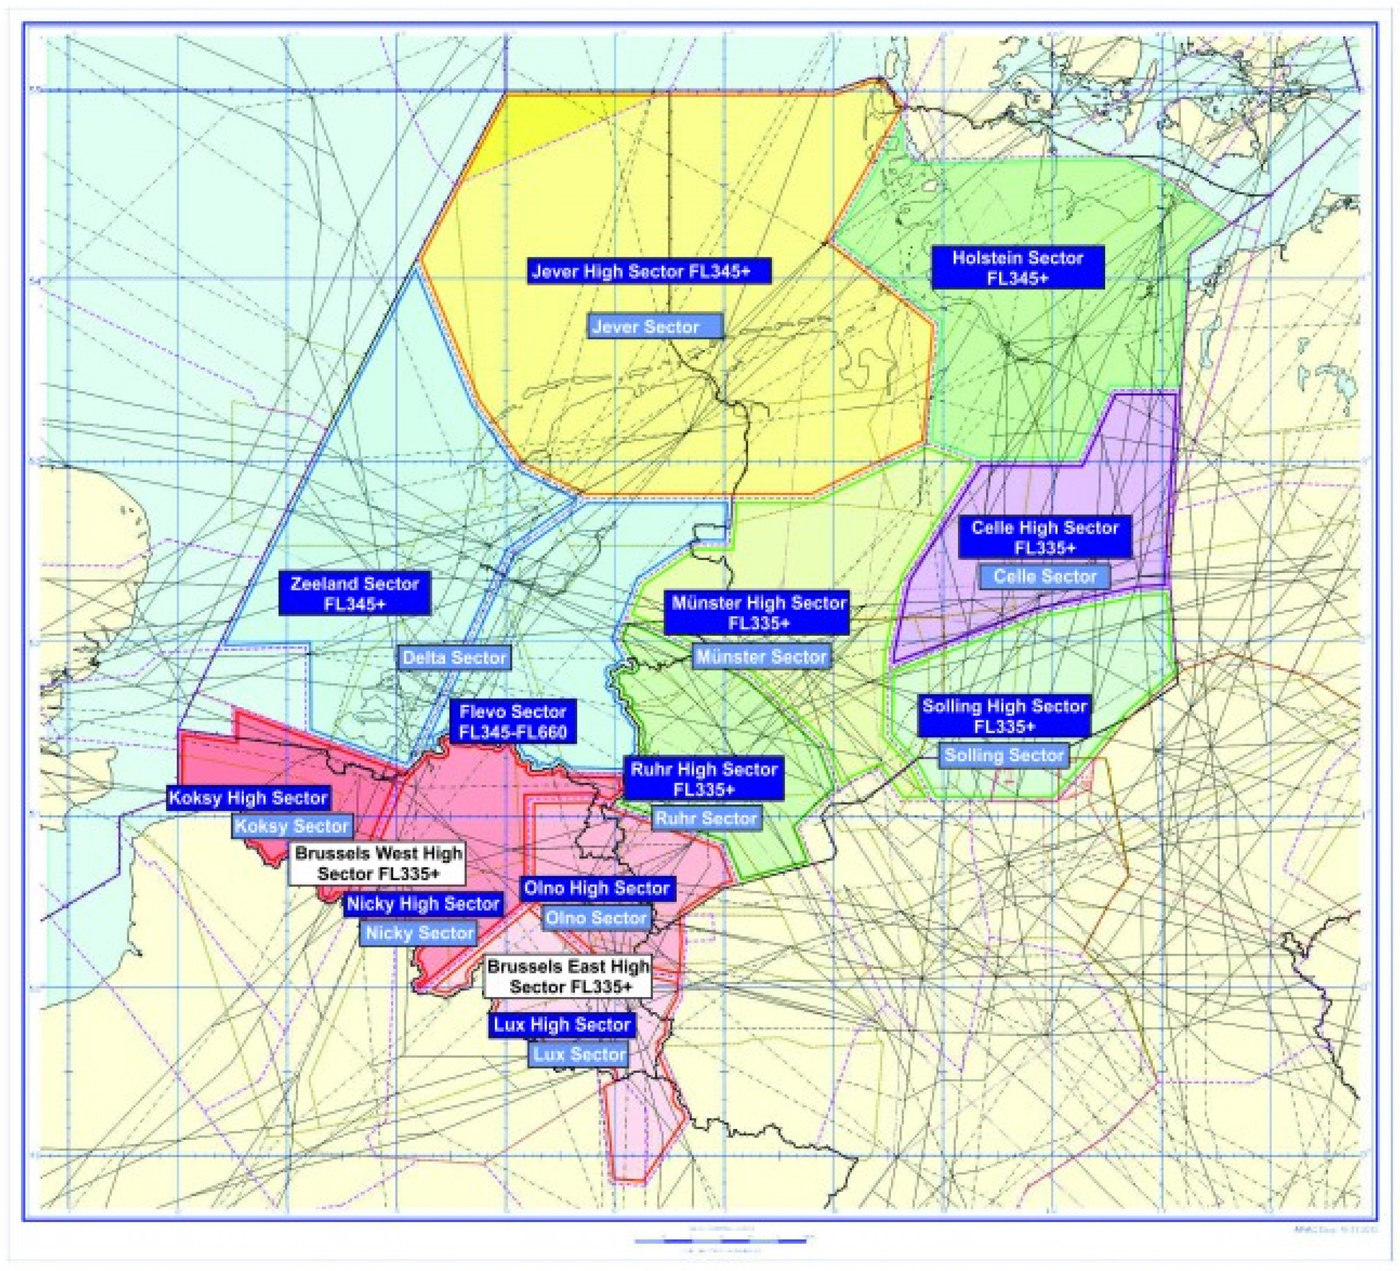
Figure 1. MUAC airspace.
During 2010 an important airspace re-design was carried out, which affects the DECO and Hannover sectors groups: the HACO re-sectorisation. This re-sectorisation consisted of the creation of a new sector, the Holstein sector, covering an airspace which originally belonged to both the DECO and Hannover sectors groups. Following re-sectorisation its airspace became integrated in the DECO sectors group. Due to this change, the data set created to carry out a historical analysis (Tobaruela et al., Reference Tobaruela, Majumdar, Ochieng, Schuster and Hendrickx2013) and to perform a detailed cost-efficiency analysis as described in the present paper, was limited to the Brussels sectors group.
The Brussels sectors group is divided into four sectors, Koksy, Nicky, Olno and Luxembourg. These sectors can be combined in different ways, both horizontally and vertically, with a division between the upper and lower sectors located at 33 500 feet. The allocation of a certain combination of sectors (i.e. airspace configuration) aims to tailor capacity to demand (as discussed in Section 4.2).
3. PREVIOUS RESEARCH ON ATC COST-EFFICIENCY
This section reviews existing studies on ATC cost-efficiency and analyses their limitations, leading to the development of a new framework in this paper.
Past research on cost-efficiency has typically focused on the airport domain (Oum and Yu, Reference Oum and Yu2004, Pyrialakou et al., Reference Pyrialakou, Karlaftis and Michaelides2012). However the developed approaches are not transferrable to ACCs due to the inherent differences in the type of operations (airport operations include the management of payload between different aircraft, apart from the movement of aircraft, which is common to airspace operations) and the different resources required (e.g. ground handling equipment).
Existing cost-efficiency studies focus on assessing the relationship between an ACC's costs and its traffic demand. In operating terms, the costs are associated with the excessive use of ATCOs and the costs associated with the ACC performance, fundamentally in terms of airspace regulations, i.e. delays. As the number of ATCOs increases, so does the ACC's ability to open additional operational sectors, which in turn creates additional capacity (see Section 4.2). Such an increase in capacity in a saturated volume of airspace leads to a reduction in the delay for aircraft flying through the ACC. However, for a given level of demand, larger numbers of ATCOs also leads to a decrease in cost-efficiency. In order to optimise the cost-efficiency, ACCs undertake a planning process, which aims to ascertain the appropriate workforce for the day of operation. This effect is overlooked by existing studies, which tend to focus on the execution phase i.e. the phase in which air traffic progresses through the ACC, after the planning phase in which the ACC execution is predicted.
Nero and Portet (Reference Nero and Portet2007) developed a cost-efficiency estimation framework using an economic costing approach. The aim was to quantify the cost of the provision of Air Traffic Services (ATS) for different Air Navigation Service Providers (ANSPs) in Europe. In order to achieve this goal, four economic drivers were identified: ATCO-hour productivity, ATCO employment costs, support costs and delay costs, all related to the execution phase and not to the planning phase. However, despite being widely used in Europe e.g. Button and Neiva (Reference Button and Neiva2013), the validity of this framework was questioned by Grebenšek and Magister (Reference Grebenšek and Magister2013), who showed that the methodology tends to over-estimate productivity for busy ATC centres.
EUROCONTROL (2007) used an economic modelling approach focused on the costs associated with the creation of capacity and with a lack of capacity. The model determined the optimum capacity required in cost-efficiency terms as the point where the total cost (cost of delay plus ATS provision costs) is minimum. This optimum cost-efficient capacity was subsequently used by ACCs to strategically plan future capacity profiles. However, the model considered cost-efficiency as a parameter only dependent on capacity and costs associated with the provision of such capacity, which is not strictly true as it depends on other factors such as how the available capacity is actually managed. As seen later in the paper, cost-efficiency can be improved without the creation of additional capacity or the reduction of delays. In addition, this approach did not discuss where the extra capacity would come from (e.g. the planning process).
Grebenšek and Magister (Reference Grebenšek and Magister2012) investigated the effect of traffic variability on the ATC centre economic cost-efficiency. Results showed that the calculation of the cost-efficiency highly depends on the season. The study assumed cost-efficiency solely as a function of unexploited resources during the valley traffic season i.e. winter. However, this was an oversimplified approach and it is shown later in this paper that other factors contribute to the ACC cost-efficiency (e.g. planning process factors).
Veronese et al. (Reference Veronese, Conti and Pesendorfer2011) built a relationship between cost and benefits of ATC on the basis of labour costs (ATCOs and support staff), capital inputs (e.g. buildings and equipment) and non-staff operating inputs (e.g. energy). However, this methodology failed to capture various operational factors (e.g. ASM performance) affecting the ACC cost-efficiency. This approach did implicitly consider the costs of the planning process (through the labour costs), although it did not calculate the amount of inefficiency created by each of the phases of the planning process.
Finally, another group of studies focused on real-time and post-operations data analysis for optimised cost-efficiency. Gianazza et al. (Reference Gianazza, Allignol and Saporito2009) developed a methodology to calculate the optimum sector configuration for French airspace based on traffic predictions and ATCO workload estimations. In their analysis, the cost of an airspace configuration was computed as the “the number of overloaded, under-loaded and normally loaded” operational sectors. Bloem and Kopardekar (Reference Bloem and Kopardekar2008) developed a heuristic algorithm to quantify the number of open sectors that can be combined to increase cost-efficiency with a new combination of basic sectors, with the aim of supporting the strategic airspace design of the centre. These studies contributed towards improving the operational cost-efficiency performance. However, they did not provide cost-efficiency measurement frameworks and only focussed on the execution phase of the ACC operations.
Tobaruela et al. (Reference Tobaruela, Majumdar, Ochieng, Schuster and Hendrickx2013) addressed the issue of capturing the inefficiencies introduced by the planning process. However, the cost-efficiency was computed relative to the execution phase. This means that the results reflect the cost-efficiency of the planning process under the assumption of optimal execution. However, this is not necessarily true as shown in this paper. Therefore, to address this issue and provide a more comprehensive description of the operational cost-efficiency of an ACC, there is a need to quantify its execution performance. This paper builds upon the findings in Tobaruela et al. (Reference Tobaruela, Majumdar, Ochieng, Schuster and Hendrickx2013) to develop a metric able to represent the overall performance of an ACC from a cost-efficiency perspective.
4. EN ROUTE AREA CONTROL OPERATING CENTRE COST-EFFICIENCY
The operating cost-efficiency of an ACC is determined by its ability to provide sufficient capacity to meet traffic demand, making an efficient use of the available resources (Veronese et al., Reference Veronese, Conti and Pesendorfer2011). This is affected by the accuracy of the planning process, which corresponds to the ratio of the long term strategic planning resource allocation and the resources required for the actual execution. It is further impacted by the relative performance between the resources used for the actual execution and the theoretical optimum resources required. The convolution of the planning accuracy and execution performance yields the Overall Cost-Efficiency (OCE), which is introduced in this paper. These are discussed in turn hereafter.
4.1. The Planning Process
The objective of the planning process is to generate forecasts of the resources (i.e. the number of ATCOs) that will be needed on the day of operation. Due to contractual agreements, ATCOs need to be informed of their duty schedule between three and six months in advance.
In the MUAC, planning is a layered refinement process in which the plan is updated progressively as increasing information becomes available. This information includes military activity, weather forecasts, special events and seasonal traffic patterns among others. The planning process consists of the following phases (Tobaruela et al., Reference Tobaruela, Majumdar, Ochieng, Schuster and Hendrickx2013):
• Master: from six to three months prior to execution; during this phase the roster architecture is published, yielding the Operational Roster Time (ORT), which expresses the total amount of ATCO minutes needed for the day of operation.
• Advanced Planning: from three months to two weeks before operations updates are incorporated into the Master plan, with the publication of specific ATCO shifts.
• Pre-Tactical: from two weeks to the day before operations a fine tuning of the advance planning is accomplished, incorporating anticipated traffic demand and special events.
• Tactical: update of the pre-tactical plan during the day of operation, based on real-time data and short-term forecasts.
During the Master phase, the number of required ATCOs, i.e. the ORT, is estimated based on the traffic forecasts and events taking place on the day of operation. Along with the publication of the ORT, an associated sector opening scheme is produced. This contains the timeline for the expected airspace configuration on the day of operation. Each of the daily airspace configuration timelines can be represented by the total amount of minutes that operational sectors are opened i.e. the Sector Opening Times (SOT). For instance, if one operational sector is opened, the SOT corresponds to 1440 minutes.
Each of the layers in the planning process makes an estimation of the SOT needed for the day of operation. The main challenge during the planning process is to deal with operational uncertainties such as weather, military activity, traffic over the day and staff absence. In order to manage these uncertainties, planning overestimations or buffers are introduced in each of the stages of the planning process.
Since each operational sector is controlled by a pair of ATCOs, the relationship between the SOT, the ORT and the safety buffers can be expressed as:
 $$ORT/2 = SOT + buffer$$
These buffers are shown in Figure 2. In general, the following relation applies:
 $${\rm ORT}/2 \gt \hbox{Master SOT} \gt \hbox{Pre-tactical SOT} \gt \hbox{Executed SOT}$$
Figure 2. ORT/2, Master SOT, Pre-tactical SOT and Executed SOT for MUAC Brussels sectors group (Tobaruela et al., Reference Tobaruela, Majumdar, Ochieng, Schuster and Hendrickx2013).
The buffer between the ORT and Master SOT is due to the uncertainty of the planning process at the Master phase. More ATCOs (i.e. larger ORT) than predicted by the Master SOT are called for duty, to ensure that operations will not run short of ATCOs during the day of operation. The buffer between the Master SOT and the Pre-Tactical SOT and the buffer between the latter and the Executed SOT are due to the uncertainties of the traffic prediction during the advance planning stage. Given the uncertainties in this process, buffers are introduced into the SOTs to ensure that the plan for the day will not underestimate the required number of ATCOs. As more accurate information becomes available the buffers are gradually reduced.
Tobaruela et al. (Reference Tobaruela, Majumdar, Ochieng, Schuster and Hendrickx2013) developed a set of metrics to measure the accuracy of the planning process. In order to capture the overall efficiency of the planning process, the ratio between the amount of time sectors are open and the number of ATCOs planned for the day needs to be captured. Therefore, this paper defines a new variable: the Overall Planning Efficiency (OPE), defined as the ratio between the executed SOT and ORT/2:
 $$OPE = \displaystyle{{executed\; SOT} \over {ORT {\left/ {\vphantom {{ORT} 2}}\right.\hbox{2}}}}$$
The OPE is a measure of the planning accuracy with respect to the actual execution on the day of operation. The ORT metric is used in this variable in order to assess what the actual ATCO utilisation was during operations relative to the initial planning. However it does not account for the efficiency of the actual execution, which is rarely optimal as shown in Section 7.2, and thereby is not fully representative of the overall cost-efficiency.
4.2. Execution Performance: Management of Airspace and Controllers
From an operational perspective, a cost-efficient execution aims to provide sufficient capacity with no delays and minimal resources. This is achieved fundamentally through the Airspace Management (ASM) function.
According to ICAO (2011), ASM is “the process by which airspace options are selected and applied to meet the needs of the airspace users”. ASM includes the management of airspace through a set of pre-defined airspace configurations in the tactical phase of the ATM operation and is the focus of this paper.
Airspace is organised into indivisible portions referred to as basic sectors. These basic sectors are merged into operational sectors, which are controlled by a pair of ATCOs: one Executive or Radar Controller (EC), and one Planner or Coordinator Controller (PC).
The selection of the airspace configuration tailors capacity to the demand. Opening operational sectors creates capacity while closing them decreases it. In addition, the larger the number of open operational sectors, the higher the required resources.
In order to maximise the cost-efficiency of the airspace configuration management, the number of ATCOs (or operational sectors) for a given level of traffic must be minimised. Figure 3 shows the variation in cost-efficiency, expressed as the ratio between traffic and ATCO pair, as a function of the number of operational sectors for the MUAC Brussels sector group:

Figure 3. Cost-efficiency as a function of opened sectors.
Figure 3 takes into account the maximum occupancy capacities for each operational sector, i.e. the Occupancy Traffic Monitoring Values (OTMVs). It assumes that when the overall occupancy (sum of the occupancies of all the operational sectors) exceeds the overall OTMV (sum of the OTMVs for all the operational sectors), an additional operational sector is required, hence reducing the traffic per ATCO pair ratio. In reality, due to traffic load imbalances and the inability of available airspace configurations to deal with them (e.g. one operational sector working in saturation with no further sector splits available, while others working below saturation with further splits available), the opening of an additional sector does not necessarily relieve the congestion. Therefore, in reality the ratio between traffic and pairs of ATCOs (operational sectors) can be lower than the values shown in Figure 3.
In addition, since there is usually more than one sector configuration available for the same number of open operational sectors, the OTMV values for the different number of open sectors have been approximated as the mean OTMV for all the available configurations with a certain number of open operational sectors. In this calculation rare operational configurations have been excluded to avoid biasing the mean.
Figure 3 shows that as the number of open operational sectors increases, the maximum achievable cost-efficiency decreases. This maximum execution cost-efficiency value corresponds to the point at which the occupancy equals the mean OTMV, i.e. the full sector load, for every given number of open operational sectors. The maximum achievable cost-efficiency decreases due to the negative first derivative term of the maximum occupancy as a function of open sectors, as shown in Table 1. This effect can be attributed to the inverse relationship between coordination workload and sector size (Welch et al., Reference Welch, Cho, Underhill and Delaura2013).
Table 1. Quadratic fit of the functional relationship between maximum occupancy and sectors open for the three MUAC sectors groups.

In Figure 4 the dashed lines represent a linear increase in the mean OTMV with an increased number of open operational sectors. However the green, red and blue lines for the different MUAC sector groups, DECO, Hannover and Brussels respectively, indicate how the mean OTMV has a non-linear increase with an increasing number of operational sectors. Due to this non-linear effect, if the traffic/ATCO ratio is considered as the sole execution cost-efficiency indicator, an ACC should always operate with one sector only. However, this would lead to capacity shortages and delays.

Figure 4. Maximum occupancy as a function of opened sectors.
However, EUROCONTROL (2007) shows that due to the effect of cost of delay, a one-sector configuration is not necessarily optimum from a cost-efficiency perspective, hence the optimum sector configuration is one that is providing higher capacities and therefore minimising delays.
The selection of the sector configuration is made by the ACC supervisor, usually in charge of developing the ASM function, assisted by the Flow Management Positions (FMPs), in charge of assessing traffic predictions. A decision is made accounting for the predictability and availability factors outlined in Table 2.
Table 2. Factors affecting the ASM decisions.

Based on these factors, a sector configuration is chosen to meet the following ASM objectives (Gianazza et al., Reference Gianazza, Allignol and Saporito2009):
• Eliminate operational sector capacity over-delivery (safety related)
• Maintain delay due to insufficient capacity below thresholds (capacity related)
• Maximise traffic load per operational position (cost-efficiency related)
• Balance workload between operational positions (safety related).
In order to overcome the limitations of existing research (see Section 3), this paper develops a novel methodology that captures both the accuracy of the planning process and the operating cost-efficiency on the day of operation, as previously defined in this paper.
5. METHODOLOGY
For planning accuracy, the findings in Tobaruela et al. (Reference Tobaruela, Majumdar, Ochieng, Schuster and Hendrickx2013) are adopted. This study assesses the accuracy of the different phases of the planning process on the basis of the OPE. As introduced in Section 4.1, this metric reflects the accuracy of the overall planning process as the ratio between the initial ATCO allocation (ORT) and the execution performance on the day of operation (executed SOT).
For the execution performance analysis, a new set of metrics is developed to assess the performance of the ASM function not only in cost-efficiency terms but also from a safety and capacity perspective. This is highly relevant because of the potential negative trade-off between these parameters: for example, a cost-efficient performance may lead to a degraded capacity or safety performance. In addition to the individual assessment of the four ASM objectives, a unique metric representing the overall ASM function execution performance is developed, as detailed in the next section.
From the planning process accuracy and the execution performance results, the Overall Cost-Efficiency (OCE) is computed. This metric represents the operating cost-efficiency of the ACC. This process is illustrated in Figure 5 and described in the next section.

Figure 5. Planning process accuracy, execution performance and OCE.
6. METRICS
This section develops the metrics used for the analysis. Table 3 details the meaning of each of the symbols used in the equations of this section.
Table 3. Symbols for the calculation of the analysis metrics.

6.1. Overall Cost-Efficiency (OCE)
The Overall Cost-Efficiency (OCE) is expressed as:
 $$OCE = OPE\;*\; Utilisation$$
This metric represents the cost-efficiency of the ATC centre in terms of workforce and airspace management, starting with the planning of the resources and ending with the tactical execution.
The OPE metric was discussed in Section 4.1; utilisation is detailed below.
6.1.1. Utilisation
Utilisation is a metric describing the extent to which the available sector capacity is being used (Bloem and Kopardekar, Reference Bloem and Kopardekar2008). In this paper, the traffic load per minute is used as the utilisation metric. The traffic load, averaged over all operational positions in a given day, quantifies the extent to which the operational sectors are loaded:
 $$\; \; \; \; Traffic\; Loa{d_{day}} = \; \displaystyle{1 \over {1440}}\mathop \sum \limits_{i = 1}^{i = 1440} {\left( {\displaystyle{1 \over n}\mathop \sum \limits_{\,j = 1}^n \displaystyle{{Occupanc{y_{i,j}}} \over {OTM{V_j}}}} \right)_i}$$
Traffic loads larger than one represent overloading whilst loads smaller than one correspond to under-loading, with associated cost inefficiencies.
Utilisation accounts for structural or airspace design and traffic flow factors. For example, if there are only nine flights in an operational sector with a maximum occupancy of 18, the optimum configuration is one sector, although the traffic load (9/18) would suggest that the efficiency of the configuration is just 0·5.
In the data analysis, the utilisation configurations with only one operational sector open (typically associated with low traffic scenarios during the night) have been removed. This prevents the results from being biased.
6.2. ASM Execution Performance (AEP)
As introduced in Section 5, the OCE indicator alone cannot capture the overall performance of the ASM function that affects safety, capacity and cost-efficiency at the same time. Therefore, this paper develops the ASM Execution Performance (AEP) metric, to provide a unique indicator of the quality of the ASM function execution performance.
The aim of the AEP is to capture the secondary effects that a cost-efficiency driven performance can have on other KPAs, i.e. fundamentally safety and capacity. In order to capture these side-effects the following metrics are calculated:
• Utilisation (introduced in Section 6.1.1): representative of cost-efficiency;
• Over-deliveries: representative of safety;
• Delays induced through staffing shortages: representative of capacity and
• Sector traffic imbalance, representative of safety.
These four metrics are in line with the four objectives of the ASM function introduced in Section 4.2.
6.2.1. Over-deliveries
An over-delivery occurs when the occupancy in a given operational sector exceeds the OTMV. There are safety implications arising from an over-delivery since the OTMV exists to prevent ATCO workload from rising above tolerable thresholds. Mathematically, an over-delivery can be expressed as follows:
 $$Overdeliver{y_{day}} = \mathop \sum \limits_1^p \left[{\left({actual\; occupancy - OTMV} \right) \; \ast \; duration} \right]$$
where the sum is over all over-delivery occurrences “p” in the given day. This equation accounts for the magnitude of the over-delivery and its duration, and is therefore measured in flights*seconds.
6.2.2. Staffing shortages
Insufficient capacity due to staff shortages are extracted from the Air Traffic Flow Management (ATFM) en route delays and are measured in minutes. These are provided by the EUROCONTROL Network Manager.
6.2.3. Sectors Traffic Imbalance
The traffic load imbalance between operational sectors is calculated as the standard deviation of the traffic load between all operational positions in a day. Since the standard deviation computes the amount of the dispersion of data from the average, this magnitude applied to the utilisation metric yields the dispersion of the sector utilisation from the average traffic load on the day (Equation (7)).
 $$Unbalancin{g_{day}} = \displaystyle{1 \over {1440}}\mathop \sum \limits_{i = 1}^{i = 1440} \sqrt {\displaystyle{1 \over n}\mathop \sum \limits_{\,j = 1}^n {{\left( {\displaystyle{{Occupanc{y_{i,\,j}}} \over {OTM{V_j}}} - {{\left( {\displaystyle{1 \over n}\mathop \sum \limits_{\,j = 1}^n \displaystyle{{Occupanc{y_{i,\,j}}} \over {OTM{V_j}}}} \right)}_i}} \right)}^2}_i} $$
For configurations larger than one sector, a sector traffic imbalance of zero corresponds to optimal traffic balance between all sectors i.e. no imbalances occur since the traffic load in all the sectors is the same.
6.2.4. ASM Execution Performance (AEP) Calculation
The AEP value corresponds to the area enclosed by a polygon such as the one depicted in Figure 6. The four axes correspond to the AEP cost-efficiency drivers. The better the performance of each individual driver, the larger the polygon area and AEP value are, meaning a better ASM execution performance.

Figure 6. AEP polygon.
The polygon area and therefore the AEP value is normalised to the optimum area (two area units) to capture the trade-offs between the dimensions, similar to the approach taken in Kallus et al. (Reference Kallus, Hoffmann, Winkler and Vormayr2010).
The main assumption of the AEP calculation is based on an equal weight of all the factors contributing to the AEP. This assumption is supported by discussions held with MUAC FMPs. These discussions indicated that even though over-deliveries (safety related indicator) should stand out from the rest of the factors, the reality of operations is that over-deliveries occur with the consent of FMPs because they are not considered more important than the rest of the factors. Therefore, FMPs agreed that an equal weight of the four factors should be representative of real ATC operations.
7. APPLICATION OF THE METHODOLOGY TO MUAC: RESULTS AND DISCUSSION
This section applies the methodology developed in this paper to the Maastricht Upper Area Control Centre (MUAC).
7.1. Data Set
The data set needed for the calculation of the metrics includes: Occupancy as a function of time for each operational sector (provided by MUAC); OTMV for each operational sector (provided by MUAC) and ATFM en route delays (provided by the EUROCONTROL Network Manager).
The data was analysed between 1 March 2012 and 30 September 2012 (seven months). This time period was selected to include the summer traffic peak, and avoid winter low traffic, in which the cost-efficiency is mainly constrained by the excessive available workforce rather than other operational factors (e.g. ASM performance) (Tobaruela et al., Reference Tobaruela, Majumdar, Ochieng, Schuster and Hendrickx2013).
In order to enable a comparison, the metrics were normalised to yield a range from 0 to 1. With this approach the “best values” of the four metrics are assigned a value of 1, whereas the “worst values” are assigned 0 (see Table 4). Intermediate values are linearly interpolated between 0 and 1. The normalised value represents the length of the axis.
Table 4. Worst and best values for the MUAC performance metrics during the period 1 March to 30 September 2012.

7.2. Overall Cost-Efficiency (OCE)
As shown in Figure 7, the OPE mean value is 0·82, suggesting a good performance of the planning process in cost-efficiency terms, but still less than the optimal performance (OPE = 1). OPE overshoots 1 only for one day, meaning that the plan for this day was short of ATCOs and back-up ATCOs or extended shifts had to be used (Tobaruela et al., Reference Tobaruela, Majumdar, Ochieng, Schuster and Hendrickx2013). However, the OCE is lower on the day of operation as a result of lower utilisation values, with a mean value of 0·58. The OCE ranges from a minimum of 0·37 to a maximum value of 0·63 with a standard deviation of 0·04. The mean value is 0·48. This implies that in practice, on average, only 48% of the total available workforce is used. The results of this analysis show that the OCE metric is fundamentally bounded by a low utilisation of the airspace sectors. This limiting utilisation effect could be even more penalising during other times of the year (e.g. winter) when lower utilisations occur.

Figure 7. OCE and its two source metrics, OPE and utilisation.
7.3. ASM Execution Performance (AEP)
Figure 8 depicts the results for the AEP metric and its four functional input metrics. Over-deliveries are apparent at all times, with higher values for the weekend than week-days (+5468 flights*minute). In respect of staffing shortages, only two days during the data period analysed display staffing-induced delays. Hence no definite conclusion can be drawn from this metric regarding staffing shortages.

Figure 8. AEP and its four functional input metrics: over-deliveries, staffing shortages, utilisation and sectors load imbalance.
The AEP mean value is 0·38 for the analysis period. This value means that the ASM function is performing at 38% of the best possible performance during the analysis period. Maximum and minimum values are 0·68 and 0·03 respectively, with a standard deviation of 0·12. The reason for this low AEP performance is due to the combined effect of utilisation, over-deliveries and sector balancing. The effect of staffing delays is negligible due to its low frequency of occurrence (mean value approximately 1). Figure 9 shows the similarity of the distributions of the normalised metrics, all showing normality at 5% significance level with a Kolmogorov-Smirnov test, with mean values of 0·59, 0·53 and 0·49 respectively.

Figure 9. Normalised AEP metrics distribution.
A multiple correlation analysis between the four metrics shows a medium to high correlation between utilisation with over-deliveries and imbalance with over-deliveries (see Table 5). The former is expected: the more loaded the sectors are, the closer they are to the capacity threshold, and hence the more prone they are to be overloaded.
Table 5. Multiple correlation results (all p < 0·01).

The even higher correlation between imbalance and over-deliveries is however surprising since it is expected that when an over-delivery occurs in a given sector, the rest of the sectors are experiencing high loads. However, when an over-delivery occurs the other operational sectors are much less loaded than the overloaded sector, hence the operational sectors do not tend to be overloaded all at the same time; instead they tend to be overloaded individually.
This result suggests that many over-deliveries could have been avoided by means of transferring the traffic to the low-loaded sectors. There is therefore a potential for the development of multi-sector traffic management initiatives such as dynamic Demand & Capacity Balancing (dDCB) (SESAR, 2012) to balance the traffic through un-loaded sectors, therefore relieving congested sectors and reducing safety risks.
8. CONCLUSION
This paper has developed a methodology to estimate the cost-efficiency of ACCs. It captures both the effect of the planning process and the daily management of airspace and staff on the cost-efficiency. It has further developed an indicator (AEP) able to capture the trade-offs of ACC performance between cost-efficiency, safety and capacity. Results for the case study of the MUAC have shown that on average only 50% of the workforce (ATCOs) is used in practice and that the performance of the ASM function only corresponds to approximately 40% of its optimum. These results are highly significant because they provide an estimation of the operating cost-efficiency based on post-operations analysis in a novel manner where all contributing factors are analysed individually. This individual analysis provides a means to identifying the source of the cost-inefficiencies.


