


1. Introduction
The volume of world maritime trade recorded 4⋅1% growth in 2017 and 2⋅7% in 2018. An annual average of 3⋅4% is predicted for the period 2019–2024 (UNCTAD, 2019). This growth affects global maritime traffic, contributing to increasing challenges for safety at sea (Dias et al., Reference Dias, Neves, Conceição and Lobo2018). Despite the technological developments and continually revised regulations to improve maritime safety, marine accidents cannot be reduced to none at all (Arslan et al., Reference Arslan, Zorba and Svetak2018). The main contributing factor to marine casualties is human error, and research demonstrates that human error accounts for 75% to 96% of various types of accidents (Rothblum, Reference Rothblum2002). Furthermore, according to accident research and investigations, human error in ships’ bridge operations plays a major role in marine accidents.
Bridge resource management (BRM), which has been adapted from the aviation industry, especially focuses on safer and more efficient teamwork on-board (Grech et al., Reference Grech, Horberry and Koester2008), while effective management and use of all aspects of BRM including liveware, hardware, and software provide safer operations (Manjeshwar, Reference Manjeshwar2014). Bridge navigation systems consist of hardware and software, the electronic chart display and information system (ECDIS) being one of the major components. ECDIS is designed to improve many aspects of navigation, such as: increasing situational awareness, route optimisation, reducing workload, reducing fuel consumption, and aiding decision making (Jie and Xian-Zhong, Reference Jie and Xian-Zhong2008; Manjeshwar, Reference Manjeshwar2014). However, it should be noted that ECDIS is also subject to human error, and even the best ECDIS is only as good as its operator (Manjeshwar, Reference Manjeshwar2014). The complexity of ECDIS is an issue and this is where matters of usability come in to play as an important factor affecting safety, as well as the training and skills of the users.
ECDIS is a software with many functions, requiring a complex menu and sub-menu system. Considering the number of manufacturers and the variety of ECDIS models used on-board ships, for navigation officers, becoming familiar with a new system with which they have to work is not a simple task. Broster (Reference Broster2016) counted as many as 38 ECDIS manufacturers in 2016, and stated that the difference between ECDISs from different manufacturers in terms of functionality and capability was gradually increasing.
It is proposed, in this study, that eye tracking could be utilised as an additional instrument for improving ECDIS interface and usability, which simply applies to how ship officers can operate with the system (Dumas and Redish, Reference Dumas and Redish1993). Usability studies with eye tracking technology have been used for many years with increasing prevalence (Bojko and Schumacher, Reference Bojko and Schumacher2005; Manhartsberger and Zellhofer, Reference Manhartsberger and Zellhofer2005), especially in human–computer interface research. The purpose of this study is to prove the value of utilising eye tracking in improving the usability of bridge navigation systems.
2. ECDIS
ECDIS is a mandatory computer-based navigation and information system, which provides critical navigational data such as position, heading, course, and speed of the ship and of other vessels in the vicinity, while allowing monitoring of the planned route, with many preset safety alarms, displayed on a digital chart (Weintrit, Reference Weintrit2009; IMO, 2017a; Turna and Ozturk, Reference Turna and Ozturk2019). ECDIS is described by the International Maritime Organisation (IMO) as a navigation system to assist the ship's bridge team in route planning and monitoring, providing the necessary up-to-date chart display with adequate navigational information for a safe passage (IMO, 2006).
The initial performance standards for ECDIS were published by IMO in 1995, and have been updated since then. The International Convention for the Safety of Life at Sea, chapter 5, includes ECDIS carriage requirements. According to these regulations, all ships had to be equipped with ECDIS from 1 January 2012 to 1 July 2018, depending on their type and tonnage (IMO, 2009). Additionally, minimum standards were defined in 2010 by IMO for the training and certification of navigation officers, and amendments entered into force in 2012 (IMO, 2010). STCW.7/Circ.24, published in 2017, provided that generic ECDIS training was mandatory. The ‘type-specific’ ECDIS training is left to the company's decision, while navigation officers are expected to be familiar with the system on-board, and are inspected for their skills and competence (IMO, 2017b).
ECDIS has made great contributions to safer navigation, such as easing workload, maintaining safe look out, collision avoidance, and improving route planning effectiveness (Jie and Xian-Zhong, Reference Jie and Xian-Zhong2008; Weintrit, Reference Weintrit2009; Yu Zhang et al., Reference Yu Zhang, Yin, Yi Cheng, Sun and Hong Xiang2011). As an innovative approach to maritime navigation, ECDIS is considered the main component of the integrated bridge system (Asyali, Reference Asyali2012). However, ECDIS has brought up some issues along with many benefits. Atik and Arslan (Reference Atik and Arslan2019) revealed, in their study comparing novice and expert users’ eye movements, that operation of ECDIS is multifaceted and complex, requiring effective training. Bakalar and Baggini (Reference Bakalar and Baggini2016) demonstrated that bridge officers had significant problems with ECDIS and that it is necessary to reassess the basic design criteria in terms of operation principles. Lusic et al. (Reference Lusic, Bakota and Mikelic2017) found that most of the participants in their experiment were not capable of using some of the most basic safety functions and alarms on the ECDIS. Jie and Xian-Zhong (2008) mentioned potential human errors, equipment errors and operational errors in use of ECDIS, and emphasised that over-reliance on ECDIS could eventually lead to accidents without solving existing problems. Sevgili et al. (Reference Sevgili, Kundakci and Atik2020) determined the probability of human error in route planning, monitoring and executing stages on ECDIS and pointed out some issues, such as over-reliance and insufficient chart work. Turna and Ozturk (Reference Turna and Ozturk2019) categorised ECDIS-related accidents as involving: human error, hardware and software failures (including electronic charts), environmental conditions, and management error. They also stated that inefficient procedures adopted, and inadequate training, resulted in human error. Moreover, accident investigation reports indicate hardware and software issues (Shipowners, 2015; Standard, 2015; INTERTANKO, 2017).
In ECDIS-related issues, the involvement of human factors frequently stands out. It should be emphasised that different merchant ships carry a variety of models of ECDIS, each with a specific interface, produced by a wide range of manufacturers. The variety and the complexity of the system is considered to affect the usability, and should not be overlooked.
3. Eye tracking
Eye tracking is a process in which eye positions and eye movements are captured in response to a visual stimulus (Bojko and Schumacher, Reference Bojko and Schumacher2005; Nivvedan, Reference Nivvedan2014). The equipment used in this process is commonly called an eye tracker (Nivvedan, Reference Nivvedan2014; Duchowski, Reference Duchowski2017). Eye trackers are frequently classified in two categories: remote and wearable (Bojko, Reference Bojko2013; Nivvedan, Reference Nivvedan2014). Most eye trackers measure and record a variety of information about the subject's eyes and eye movements (Van Orden et al., Reference Van Orden, Jung and Makeig2000).
Two main measurements are performed in eye tracking research. One is fixation, being the instants when the eyes are relatively inactive, processing information, and the other is saccades, which are rapid eye movements observed (captured) in between fixations. In addition to these basic measurements, there are numerous metrics derived from these two main measurements, such as scan path and gaze (Poole and Ball, Reference Poole, Ball and Ghaoui2006). A larger number of total fixations indicates less efficiency in a search, potentially due to poor layout design of the interface, while more saccades indicates more searching. A longer duration of scan path is regarded as sign of less efficiency in scanning. A higher ratio of saccade to fixation indicates more processing and less searching (Goldberg and Kotval, Reference Goldberg and Kotval1999; Poole and Ball, Reference Poole, Ball and Ghaoui2006).
Applications of eye tracking technology can be categorised in several ways. In general, one is categorisation based on the use of eye tracking, which is described in two categories: diagnostic or interactive. On the other hand, applications can be identified within four areas: neuroscience and psychology, industrial engineering/human factors, marketing/advertising and computer sciences (Duchowski, Reference Duchowski2017).
There is a wide range of studies on eye movements in the neuroscience and psychology field (Holmqvist et al., Reference Holmqvist, Nyström, Andersson, Dewhurst, Jarodzka and Van De Weijer2011; Duchowski, Reference Duchowski2017), from which many of the methods and metrics originate. The industrial engineering/human factors field, in which safety is an important aspect, aims at human attentional behaviour. Eye tracking can help to measure attentional behaviour. Moreover, eye tracking can help to observe, analyse, and understand the cognitive, attentional and visual aspects of human performance. Driving, aviation and visual inspection are some of the common research interests covered in this area. In addition, eye tracking has been used to assess the usability of newly developed equipment and systems. In the marketing/advertising field, eye tracking has been increasingly used to find out what people are paying attention to, making assessment of advertising effectiveness possible. Computer sciences, another area in which eye tracking is commonly used, includes many interactive applications, and diagnostic and interactive studies generally focus on human–computer interaction (HCI) (Duchowski, Reference Duchowski2017).
4. Eye tracking in usability research
Usability and functionality can come to a close understanding and can be considered as an attribute of a system. However, usability applies to how operators can work with a certain system, while functionality implies what can be done with the system (Dumas and Redish, Reference Dumas and Redish1993).
Usability is defined, using effectiveness, efficiency and satisfaction concepts, by the International Standards Organization (ISO). The ISO, in its definition of usability, emphasises efficiency, effectiveness, and user satisfaction (ISO, 2018). Satisfaction of users can be measured with questionnaires and interviews and it can also be evaluated using usability testing. It includes measuring the performance of users on specific tasks (Sharp et al., Reference Sharp, Preece and Rogers2015). On the other hand, Rubin and Chisnell (Reference Rubin and Chisnell2008) define usability as the situation in which the user can use the service or product she/he wants to use without hindrance, hesitation or questions.
There are many variations and components of a usability test. It can be said that it generally includes the following characteristics:
• Learnability, which can be considered a part of effectiveness, is associated with how easy it is to learn to operate the system. In another words, it relates to the ability of users to operate the system at a certain level of competence, after a certain period of training (Nielsen, Reference Nielsen1993; Rubin and Chisnell, Reference Rubin and Chisnell2008; Sharp et al., Reference Sharp, Preece and Rogers2015).
• Efficiency means how quickly the user, who learns to use the product, can perform a given task. In generally, the measure of time is used to evaluate it (Nielsen, Reference Nielsen1993; Rubin and Chisnell, Reference Rubin and Chisnell2008; Sharp et al., Reference Sharp, Preece and Rogers2015).
• Memorability is about how easy it is for operators to remember a system after learning it. The operator should be able to recall at least the basic functions, even if they do not use the system for a certain period of time. To do this, producers or designers may design reminder icons about menu and task options for users (Nielsen, Reference Nielsen1993; Sharp et al., Reference Sharp, Preece and Rogers2015).
• Satisfaction refers to users’ level of pleasantness, feelings, perceptions and opinions about a product or service. Users can perform better with a product or service they are satisfied with; in other words, it meets their requirements (Nielsen, Reference Nielsen1993; Rubin and Chisnell, Reference Rubin and Chisnell2008).
Other components such as utility (Sharp et al., Reference Sharp, Preece and Rogers2015), robustness and validity (Markopoulos and Bekker, Reference Markopoulos and Bekker2002) are also important to define the usability of a system.
Eye tracking technology in usability testing began with testing of cockpit design in the first instance (Fitts et al., Reference Fitts, Jones and Milton1950) and has been widely used since, with increasing practicality and decreasing costs (Bojko and Schumacher, Reference Bojko and Schumacher2005; Manhartsberger and Zellhofer, Reference Manhartsberger and Zellhofer2005). Fitts et al. (Reference Fitts, Jones and Milton1950) stated that the use of eye tracking technology in the field of usability began in the 1950s. However, it lost its usage value in the 1970s because of difficulties in analysing data procured from eye tracking equipment (Jacob and Karn, Reference Jacob, Karn, Hyona, Radach and Deubel2003). Eye tracking gained its popularity in the usability area with advances in eye tracking technology (Jacob and Karn, Reference Jacob, Karn, Hyona, Radach and Deubel2003) and moreover it came to be considered a tool for improving the computer interface in the 2000s (Alacam and Dalci, Reference Alacam and Dalci2009).
Goldberg and Kotval (Reference Goldberg and Kotval1999) found that a poorly-designed interface produced a greater number of fixations than a well-designed interface. This situation indicated that the number of fixations could be related to the process the user needs to handle. They also stated that long fixation time means that the user spends a lot of time on interpreting and internalising the interface components.
According to Ehmke and Wilson (Reference Ehmke and Wilson2007), heat maps and other visualisation techniques using fixations, saccades and other data are evaluated by usability researchers to identify reactions on the user's part, the scanning or reading behaviour of the user, or areas the user is not looking at. In addition, in their exploratory research, they associated pattern sequences for usability problems and brought a new perspective to eye tracking patterns research.
Alacam and Dalci (Reference Alacam and Dalci2009) examined the effects of symbolic representations on mapping websites, the use of pop-up windows and their parts on the usability of the sites. They concluded that more understandable symbols on the maps will decrease the cognitive burden and making the pop-up windows more useful will provide efficiency and effectiveness in the web mapping sites usage.
Obrist et al. (Reference Obrist, Bernhaupt, Beck, Tscheligi, Cesar, Chorianopoulos and Jensen2007) evaluated interactive television (iTV) using a variety of eye-tracking data including time to first fixation (TTFF), and heat maps. The TTFF values of elderly participants were higher than those of younger participants. The fixation values of the elderly were also higher than those of the young people. The heat maps also showed that older people do not look at certain elements in a designated task. These results indicate that elderly people had difficulty understanding and interpreting the information bar on an iTV display.
Russell (Reference Russell2005) used data such as average TTFF and heat maps to investigate whether users were successful in searching for specific hyperlinks on different webpages. The study showed that these data also allow usability test professionals to collect information about areas of interest, such as most distracting and most informative. Moreover, Russell emphasised that eye tracking was utilised as a tool for determining where and how users are searching the interface for a target link or web object.
Hernandez-Mendez and Munoz-Leiva (Reference Hernandez-Mendez and Munoz-Leiva2015) in their study on the effectiveness of online advertising on different web sites suggested that images draw more attention than text, and analysing TTFF and the number of fixations, the results supported their hypothesis.
Hareide and Ostnes (2017) published a study on the usability of the interface of integrated navigation system and ship bridge layout, and made suggestions for improvement.
5. Materials and methods
The experiment was conducted at the pilotage station in the Port of Ismir. The subject group consist of five experienced port pilots. Port pilots were selected as the sample group considering their experience with a wide range of ECDIS models, since they navigate on-board a variety of ships arriving and departing the port. It was confirmed that the participants were not familiar with the ECDIS systems used in the study. A total of 15 eye tracking recordings were captured on three different ECDIS models using Tobii Pro Glasses 2 with gaze sampling frequency of 100 Hz. The glasses were calibrated for each participant before recordings. The eye tracking data obtained from 15 recordings were analysed using Tobii Pro Lab Analyzer software to obtain the metric data and the heat maps. The TTFF metric data from 15 recordings were analysed using Statistical Package for the Social Sciences (SPSS) to test the hypothesis and to compare the usability of different ECDIS models. The heat maps collected from the participants’ recordings were compared with those of expert operators to compare their focus of attention. The recordings were examined and evaluated by one port pilot and two certified simulator trainers and assessors for qualitative analysis purposes.
The participants were required to execute given tasks, which were: checking their own ship's status on the ship data window (AOI 1), obtaining a distance and bearing to a certain object using the distance tool (AOI 2), and starting the procedure to create a waypoint (AOI 3). The tasks of checking the ship's data and obtaining a distance and bearing are relatively simple tasks which are considered as skills necessary for the port pilots when they go aboard ships arriving and departing the port. Creating a waypoint, however, is a task a port pilot would seldom, if ever, need to do, since the ships’ officers assist and provide information to pilots for such procedures. The tasks were also executed by a group of participants who were familiar with the ECDIS models used in the study, referred to here as ‘experts’, to compare heat map visualisations as indication of focus of attention.
The numbers on the areas of interest figure (Figure 1) indicate the areas of interest and corresponding descriptions on Table 1.

Figure 1. Sample displays of ECDIS A, B and C showing the three areas of interest
Table 1. List of areas of interest

TTFF, which indicates ‘the elapsed time between an interval start event until the first fixation occurs in that interval and in the target AOI’ (Tobii Pro, 2020), or how quickly an area of interest was fixated (Neta et al., Reference Neta, Tong, Rosen, Enersen, Kim and Dodd2017), was analysed for the purpose of this study. TTFF was used to evaluate the responses of the participants to the task given, which eventually gives an indication of the usability of the system, measuring and observing the duration that the participant took to notice the necessary button (tab) to enter the required function on the menu. Both descriptive and inferential analyses were used to evaluate the eye tracking data collected. The data met the non-parametric assumption in terms of normality, so the Mann–Whitney U test was used to compare two sample groups, while the Kruskal–Wallis test was used to compare three. The Kruskal–Wallis and Mann–Whitney U tests, as non-parametric tests (Howell, Reference Howell2011), were conducted to test the research hypotheses, which predicted that there would be significant differences between the different ECDIS models on the specified areas of interest. The means of the participants’ TTFF data and the heat maps were compared for the purposes of descriptive analysis. The participants were interviewed following the exercises to collect feedback on the tasks and usability of the ECDIS programs.
6. Results
The Shapiro–Wilk test of normality was conducted for the statistical analysis (Zimmerman, Reference Zimmerman2003; Guo, Reference Guo2012) and the results showed that the conditions for normally distributed data (P > 0⋅05) were not met. A non-parametric Kruskal–Wallis test was run to examine the differences in TTFF of participants on the three different models of ECDIS from different marine equipment manufacturers and software developers. As seen in Table 2, P values in the Kruskal–Wallis test results were less than 0⋅05, indicating significant differences were found among participants’ TTFF in the areas of interest of ship data, distance tool, and waypoint tool (Table 2).
Table 2. Kruskal–Wallis test results of first fixation measurements

A two-tailed Mann–Whitney U test with 95% confidence level was run to determine the differences between the TTFF of the participants on ECDIS A and B, A and C, and B and C in the designated areas of interest to contemplate the Kruskal–Wallis test results. The test run indicated that there are significant differences (P < 0⋅05) between the participants’ TTFF measurements on ECDIS A and B on all AOI (Table 3). The test showed that there is a significant difference (P < 0⋅05) between TTFF measurements on ECDIS A and C on AOI 3 (Table 4). The test indicated that there are no significant differences (P < 0⋅05) between TTFF measurements on ECDIS B and C on any of the AOI (Table 5).
Table 3. Mann–Whitney U test results of TTFF measurements of the participants on ECDIS A and B

Table 4. Mann–Whitney U Test results of TTFF measurements of the participants on ECDIS A and C

Table 5. Mann–Whitney U Test results of TTFF measurements of the participants on ECDIS B and C

The means of TTFF measurements are shown in Figure 2, indicating that the participants were able to check the ship data and use the distance tool faster on ECDIS A. TTFF values were longest on ECDIS B for the same areas of interest. TTFF values on AOI 3 were longest on ECDIS A and were close on ECDIS B and C.
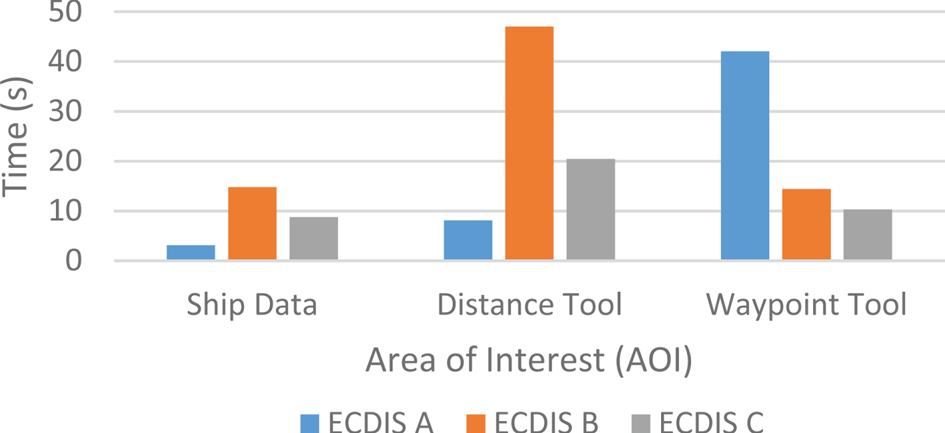
Figure 2. Comparison of means of time to first fixation measurements of the participants on ECDIS A, B and C
The heat map visualisations presented in Figures 3–5 are used to analyse focus of attention, where scattered eye movements indicate longer periods of time searching for a specific task, resulting in longer TTFF. Heat maps, which show how the eye movements are distributed over the ECDIS display, are visualisations that can effectively reveal the focus of visual attention. Heat maps can provide visual behaviour information, plainly and with extraordinary power. The areas appearing in shades of red (warm colours) indicate longer periods of fixation, while shades of green (cold colours) indicate shorter duration of fixation (Tobii Pro AB, 2020). Therefore, we can see the differences in distribution of attention between the participants and the experts while executing the given tasks, as detailed in section 5.
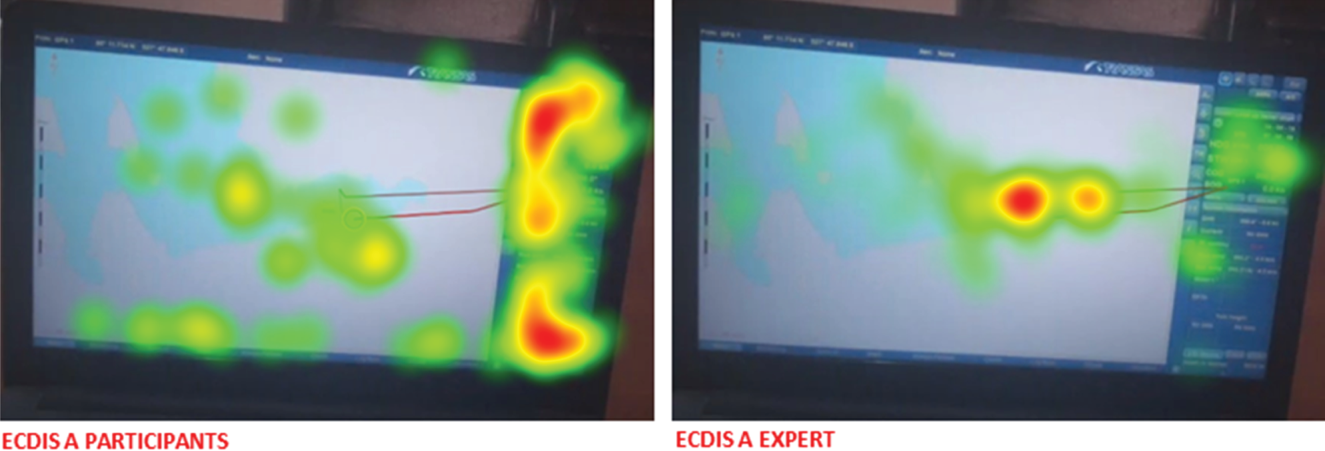
Figure 3. Comparison of the heat map visualisations of the participants combined and the expert on ECDIS A

Figure 4. Comparison of the heat map visualisations of the participants combined and the expert on ECDIS B
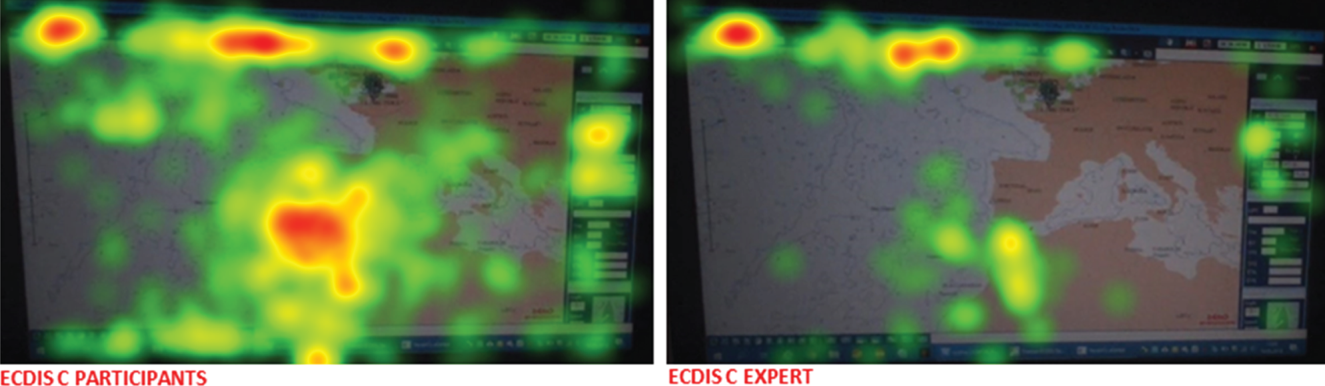
Figure 5. Comparison of the heat map visualisations of the participants and the expert on ECDIS C
7. Discussion
The statistical results validate the research hypothesis, which predicted that there would be significant differences between participants’ TTFF on different models of ECDIS. The results indicated significant differences between ECDIS A and B on all AOI, and on one AOI between ECDIS A and C.
The comparison of the means of TTFF revealed that ship data information is easily readable on ECDIS A, while the difference between models was minor. The ship's own data such as heading, course over ground, and speed over ground, presented in a relatively large window, is located on the right-hand menu on ECDIS A and C, and placed independent of the menus on ECDIS B, on the left of the display. A main menu or a larger data interface is usually presented on the right of the display on many ECDIS models, and the participants seem mainly to search for the data on the right-hand menu.
The distance tool is indicated by a divider symbol on the corresponding button (tab) on ECDIS A and C, while the button is labelled ‘ERBL’ (electronic range and bearing line) on ECDIS B, which seems to create a difference. The location of the distance tool is on the right on ECDIS A, on the bottom on ECDIS B, and on the top on ECDIS C, which could create a difference as well.
Entering the menu for creating a waypoint, which is relatively complicated, is labelled on a small button on the bottom menu as ‘voyage planner’ on ECDIS A. It is labelled on a large button on the main menu as ‘planning mode’ on ECDIS B. On ECDIS C, a small button on the top menu labelled as ‘Wpt’ is used to create a waypoint. Comparison of the means indicate that the participants entered the waypoint menu faster on ECDIS B and C than ECDIS A, which shows that the location and labelling of the menu are important in usability of ECDIS, as in general software design.
Heat map visualisations, showing the differences between the participants’ and the experts’ focus of attention during execution of tasks, are indicative of the complexity of the systems and the necessity for training. In all three ECDIS models, the experts focused more directly on the corresponding areas of the menu to complete given tasks while the participants’ focus of attention was scattered, gazing around the display, searching for relevant buttons.
8. Conclusion
Eye tracking has been used in a number of studies in the marine transportation field, however, the key contribution and the novelty of this study is the introduction of eye tracking in maritime research as a tool for testing the usability of navigational equipment and systems. This study aims to prove the value of eye tracking in testing the usability of ECDIS software. It is important to emphasise that the study was designed to test the practicability and use of eye tracking for testing ECDIS software usability, and potentially for improving software design. This study does not compare or reveal the quality or effectiveness of the different models of ECDIS used for the experiment by any means. Comparing functionality, practicability, ease of use, and other properties that determine the usability of systems requires further testing, which is not in the scope of this study.
Further study, to actually test the usability of different systems, shall be planned and carried out in coordination with the manufacturers. The support of the system manufacturers has great importance for further studies since one of the major limitations of the study was obtaining the programs to test. This study proves that eye tracking, as a usability testing tool, has great potential for improving the effectiveness of ECDIS, and the authors propose its integration in the product research and development stage for manufacturers and researchers.
Acknowledgements
This study was derived from the doctoral thesis of Ömer Arslan under the supervision of Assist. Prof. Dr. Oğuz Atik. This study has been also supported by Dokuz Eylül University as a part of ‘Use of eye tracking technology on simulator based maritime training as an assessment and evaluation method’ project (2018.KB.FEN.012) and has been approved by the Ethics Committee of Dokuz Eylül University Maritime Faculty (Ref. 13997729/903/07/02/24). We would like to thank all the participants for their support.


