


1. INTRODUCTION
Before GNSS signals can be processed in order to solve for the receiver's position the signals must be detected. The signals arriving at the receiver have an associated time delay due to the distance between transmitter and receiver but are also shifted in frequency (Doppler) due to relative movement of the platforms. The receiver must therefore perform a two dimensional search process to locate coarsely the desired signal in both frequency and delay (time) domains. Subsequently the acquisition or pull-in process improves the receiver's estimation of the incoming code delay and carrier frequency before handing over to the tracking processes.
Currently GNSS signals transmitted by the GPS Satellites use Phase Shift Keying (PSK) modulation. The search performance of PSK modulated signals is well understood (Ward Reference Ward1996). Through the modernisation of GPS and the introduction of the European Galileo GNSS, an entirely new family of modulations will be introduced largely based around the use of Binary Offset Carrier (BOC) modulation. BOC is a very different type of modulation to PSK and requires new approaches to the signal search process. Although some studies have addressed the performance of specific BOC signals, there are many types of BOC modulation, which have differing effects on the performance of the search.
This paper provides the necessary performance analysis of the receiver's search process for the various types of BOC modulated signals. Firstly the well-established theory for PSK signal search is summarised. This theory is subsequently extended to encapsulate BOC and new signal detection strategies conceived for this modulation. At each stage the theory developed is verified through Monte-Carlo analysis using representative computer simulations.
2. PSK MODULATED SIGNALS
A brief summary of the theory of GNSS signal search for PSK modulated signals will provide the necessary context and background information. Extension of the theory is then provided for the various types of BOC modulation in Section 3.
2.1. Search of PSK modulated signals
After signal conditioning and down-conversion to a suitable Intermediate Frequency (IF) by the receiver a PSK modulated signal can be represented as follows.
A is the amplitude of the signal, ω is the unknown carrier frequency, a(t) is the PRN code spreading sequence, d is the navigational data value having possible values of +1 and −1. τ is the time delay of the code sequence, φ is an unrelated phase shift due to the uncharacterised path from transmitter to receiver and n(t) is a general noise term. Signals from other GNSS satellites and interferers are not included in this representation.
The aim of the search process in a GNSS receiver is to achieve an estimation of the code delay, ![]() and carrier frequency,
and carrier frequency, ![]() estimation such that the receiver's acquisition process can reliably lock onto the signal. Much of the previous analysis (see Ward Reference Ward1996 and Kaplan Reference Kaplan and Hegarty2006) has concentrated on linear search techniques where a single code and carrier estimate is searched for during each receiver integration period (typically 1 ms). The linear search technique is inherently slow and may take a number of minutes to detect the presence of a signal reliably. Modern receivers use search techniques based on Fast Fourier Transforms (FFT), which can detect the signal presence within a matter of milliseconds (Van Nee Reference Van Nee and Coenen1991). To perform a good comparison of the search for PSK signals to BOC signals both search techniques are addressed in the following.
estimation such that the receiver's acquisition process can reliably lock onto the signal. Much of the previous analysis (see Ward Reference Ward1996 and Kaplan Reference Kaplan and Hegarty2006) has concentrated on linear search techniques where a single code and carrier estimate is searched for during each receiver integration period (typically 1 ms). The linear search technique is inherently slow and may take a number of minutes to detect the presence of a signal reliably. Modern receivers use search techniques based on Fast Fourier Transforms (FFT), which can detect the signal presence within a matter of milliseconds (Van Nee Reference Van Nee and Coenen1991). To perform a good comparison of the search for PSK signals to BOC signals both search techniques are addressed in the following.
2.2. Linear search of PSK signals
Although the received signal bandwidth may be over-sampled and allow fine slews of the replica code sequence, generally in linear search relatively wide code slews (Δτ=0·25 to 0·5 chip) are used to speed up search time. Figure 1 shows a depiction of the minimum correlation gain achieved as a result of the search granularity. In Table 1 the minimum and average correlation gains are detailed for a PSK search granularity of a half-chip.

Figure 1. Minimum correlation gain depending on the code slew interval of a PSK autocorrelation peak.
Table 1. Correlation gain in amplitude.

In order to assess the performance of the search process a number of different probabilities are commonly defined as follows (Ward Reference Ward1996):
• Probability of detection (Pd): The probability that the correlation peak corresponding to the correct signal location exceeds a predetermined threshold. This probability is dependant on the received C/N 0 of the signal and the threshold level.
• Probability of false dismissal (Pfd): The probability that the correlation peak corresponding to the correct signal location does not exceed a predetermined threshold. This probability is dependant on the received C/N 0 of the signal and the threshold level.
• Probability of false alarm (Pfa): The probability that a correlated noise sample exceeds the threshold when no signal is present. This probability is only dependent on the threshold level and noise distribution.
• Probability of correct dismissal (Pcd): The probability that a correlated noise sample does not exceed the threshold when no signal is present. This probability is only dependent on the threshold level and noise distribution.
The probabilities described here are the result of a single correlation for a specific code-delay and Doppler frequency. The receiver's search threshold is designed for a certain probability of false alarm. Once the threshold is defined the other probabilities can be computed.
In the absence of significant interference the probability of false alarm depends only on the distribution of thermal noise upon which the receiver's gain control is operating. The incoming signal is multiplied by in-phase and quadrature carrier replicas with an estimated frequency, ![]() and a replica code sequence with the delay,
and a replica code sequence with the delay, ![]() . These multiplications are then integrated to form the following two correlation results (w I and w Q), which are used for signal detection.
. These multiplications are then integrated to form the following two correlation results (w I and w Q), which are used for signal detection.

Where the Λ symbol is used to denote the idealised auto-correlation function as follows:

T c is the chip period and T is the integration time. In order to remove the dependence of the received carrier phase the envelope is now formed according to ![]() . Assuming that only white Gaussian noise is present on the I and Q channels the probability density function describing the noise envelope follows a Rayleigh distribution as shown in Equation (5) (Ward Reference Ward1996). Based on an integral over this distribution from a predetermined acquisition threshold, V t to infinity the probability of false alarm for a certain threshold can be determined following Equation (6).
. Assuming that only white Gaussian noise is present on the I and Q channels the probability density function describing the noise envelope follows a Rayleigh distribution as shown in Equation (5) (Ward Reference Ward1996). Based on an integral over this distribution from a predetermined acquisition threshold, V t to infinity the probability of false alarm for a certain threshold can be determined following Equation (6).
σn is the standard deviation of the noise. In Figure 2 the theoretical noise floor based on the Rayleigh distribution is plotted in pink together with the simulated noise of our receiver representation in blue. The simulated noise was normalised by its standard deviation. The threshold indicated corresponds to a probability of false alarm of 16%.

Figure 2. Probability density function of a PSK signal (40dB-Hz) and the noise compared to theoretical distributions.
When a signal is present the probability density function describing the envelope follows a Ricean distribution described by Equation (7). The signal amplitude determines the mean of the Ricean distribution. The mean depends therefore on the carrier to noise density, C/N0 of the signal. The probability of detection can then be calculated by integrating over the corresponding Ricean distribution from the threshold to infinity as displayed in Equation (8).
A is the signal amplitude and I 0 is a Bessel function. A Ricean distribution reflecting a signal with 40 dB-Hz is shown in Figure 2 (brown line) along with the corresponding simulated result (red line). The threshold indicated in this figure leads to a probability of detection of 99·7% for this scenario.
To determine the outcome of the whole search process more probabilities are defined, they extend the probability of a single correlation result to the result of the entire search process and are defined as follows.
• Probability of successful search (Ps): The probability of a signal that is present being successfully found; this is dependent on the C/N 0 of the signal.
• Probability of unsuccessful search (Pus): The probability of a signal that is present is not found, also dependent on the C/N 0.
• Probability of false search (Pfs): The probability of false signal detection when there is just the thermal noise present. This probability is only dependent on the noise and receiver's search parameters.
• Probability of search dismissal (Psd): The probability of no signal detection when there is just the thermal noise present. This probability is only dependent on the noise and receiver's search parameters.
The two most important probabilities can be expressed with these formulas P s=1−(1−P d)N and P fs=1−(1−P fa)N where N is the number of code shifts considered, 2046 in the standard GPS C/A code search approach (assuming a 0·5 chip slew rate).
2.3. Circular correlation based search of PSK signals
This algorithm is based on the use of Fast Fourier Transforms (FFT). The basic principle of a FFT based search is shown in Figure 3, first presented in Kilvington 1986, the algorithm makes use of FFT units to accelerate the computation of a circular correlation. The received IF signal is mixed into real (in-phase) and imaginary (quadrature) components and its Fourier transform computed. The result is then conjugate multiplied by the Fourier transform of the code sequence. Multiplication of signals in the frequency domain is equivalent to correlating signals in the time domain. Therefore, the circular correlation across all code offsets can be computed by taking the inverse Fourier transform. The envelope of the complex result is then calculated and compared to a predefined threshold value in order to determine presence of the signal. The use of the FFT units reduces the number of multiplications required for a circular correlation from N mul=n 2 to N mul=2nlog(n), assuming the FFT of the code sequence can be stored. Another implementation of the search algorithm uses the FFT algorithm to determine the Doppler frequency directly after removing the PRN-code modulation. A good explanation is given in Lannelongue 1998. Because of the wider use, only the technique implementing the circular correlation is considered here.

Figure 3. FFT search algorithm for PSK signals.
Unlike the linear search technique where a single result is compared against a threshold, the FFT search compares many thousands of results across the code delay space in a single detection. Many of these results may exceed the detection threshold either because they are very close to the correct time delay and hence are strongly correlated or the threshold is sufficiently low for detection to be induced through noise. After detection a decision must then be made to determine the receiver's best estimate of received code delay. A number of potential strategies can be conceived to make this decision (Rounds Reference Rounds and Norman2000). The approach assumed here is to choose the highest peak out of those that exceeded the detection threshold. This allows us to analyse the performance across a single circular correlation based search process. Modern receivers use combinations of coherent and non-coherent integration periods (Ziedan Reference Ziedan2006) to further improve the search but these algorithms are based on a single correlation, whose result can be easily extrapolated. All probabilities apply to one circular correlation on a specific Doppler frequency bin. The algorithm is identical for all frequency bins and therefore the results can be easily extrapolated to whatever the required Doppler range may be.
A very important property is that the number of points in the circular correlation (N) also defines the granularity of the code slew achieved by this search process unlike in the linear search where both are independent.
Throughout the following analysis the theoretically derived results will be verified using a computer-simulated model of a GNSS FFT-based search process. All codes are assumed to have the same length of 1023 chips as the standard GPS C/A code. This is chosen to ensure consistency across the results and provide a basis for comparison of various BOC search techniques.
For a signal to be found a correlation within a chip of the correct timing delay must be the biggest result across the entire circular correlation. The probability of successful search is therefore the probability of the correct signal peak being the biggest peak in the result of the circular correlation. The probability density function of N noise samples being less than the value x can be written as follows:
Integrating this probability with the probability density function of the signal results in the probability of successful search, shown in Equation (10). The probability density function for the signal present matches the Ricean distribution and depends on the carrier to noise density of the signal. This model applies only when the autocorrelation peak is sampled exactly at the maximum, thus having maximum gain in the correlation. Therefore only a single sample is considered to be within a chip of the correct timing delay. This corresponds to the case of maximal correlation gain (A=1 in Equation (7)) with half-chip search granularity.
If worst-case correlation gain of the peak is taken into account (half-chip spacing) then instead of comparing a single sample with the maximum correlation gain to N noise samples, we are now comparing two samples with the same worse-case correlation gain against N noise samples. The formula from Equation (10) needs then to be adapted for two peaks, either of which can be the maximal value. The probability density function for worse case correlation gain (A=0·75 in Equation (7) of the correlation peak can then be written as follows.
A comparison of the theoretically modelled probability of successful search and of a computer generated Monte Carlo simulation (1000 runs) is shown in Figure 4. The model for the best and the worst case sampling effects are shown for both the theoretical and simulated results. This model successfully links the probability of detection and the probability of successful search for a search process based on a single circular correlation.

Figure 4. Probability of successful search, comparison of model and simulation.
3. BOC MODULATED SIGNALS
An important feature of the new signals for both GPS modernisation and Galileo is an entirely new kind of modulation called Binary Offset Carrier (BOC). BOC modulation is a rectangular sub-carrier modulation (sine or cosine) of the PRN spreading code and is denoted BOC (f s, f c), where, f s is the sub-carrier frequency, f c is the PRN code chipping rate and both are multiples of 1·023×106. The sub-carrier frequency is chosen such that it has an integer number of half periods, T S (sub-chips) within a chip of the spreading sequence (see Figure 5). The effect of BOC modulation is to create a signal with a split frequency spectrum. This is desired to ensure spectral separation between multiple navigational signals transmitted in the same frequency band.
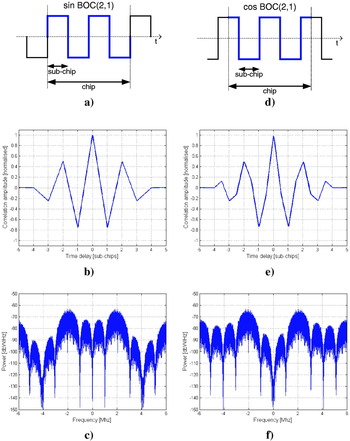
Figure 5. Sine-phased BOC (2, 1) modulated signal: a) Time-domain representation b) Autocorrelation function c) Power spectral density (1 W signal power). Cosine-phased BOC (2, 1) signal: d) Time-domain representation e) Autocorrelation function f) Power spectral density (1 W signal power).
To explain the effect of the BOC autocorrelation functions we describe the incoming BOC modulated signal in Equations (12) and (13) for sine-phased and cosine-phased sub-carriers respectively.
Where s S is a sine-phase sub-carrier s C is a cosine-phase sub-carrier and ωBOC is the sub-carrier angular frequency.
After correlation with a local replica code we obtain four correlation results covering the four combinations of multiplying by either sine and cosine carrier replicas or sine and cosine sub-carrier replicas. If the desired incoming BOC signal has a sine-phased sub-carrier the four correlation results are as follows:

If the desired incoming BOC signal has a cosine-phased sub-carrier the four correlation results are as follows:

These eight correlation results can be modelled using a set of new functions as shown in Equations (16) and (17).


A new set of functions for BOC signals are defined in Equation (18) and replace the equivalent Λ function in the PSK case. The trss (triangular sine sine) and trcc function are the auto-correlation functions of sine and cosine phased BOC modulated PRN-codes respectively. The trsc function is the cross-correlation function of the sine phased BOC code with the cosine phased BOC code and is identical to the trcs function.

The resulting correlation functions are shown in Figure 6 for the BOC (2, 1) case. In case of a cosine BOS signal the functions are not smooth and they contain high frequency content due to sharp edges.

Figure 6. Set of the BOC autocorrelation functions.
4. SEARCH OF BOC MODULATED SIGNALS
The search for BOC modulated signals is more complex due to the multiple peaks of the BOC autocorrelation shape (shown in Figure 5). The minimal and average BOC correlation gain can be computed in a similar way to the PSK example as in Figure 7. In Table 2 the minimum and average gains are shown for a BOC (2, 1) signal modulated with a sine and cosine phased sub-carrier. The lower gain for the cosine phased signal is a result of the narrower main peak due to sharpening of the central correlation peak from the cosine transitions, see Figure 5b and 5e. The width of the main peak of a BOC autocorrelation shape therefore depends on the code frequency, the sub-carrier frequency and the relative phasing of the sub-carrier to the code sequence. To obtain an average correlation gain equivalent to a standard PSK system using half-chip spacing, a BOC system must use a search granularity (spacing) of approximately a quarter of a sub-chip. If this search granularity is used the calculation of the probability of detection and the probability of successful search is equivalent to the PSK case with the correlation gains from Table 2.

Figure 7. Gain depending on the code slew interval of a sine BOC (2, 1) autocorrelation function.
Table 2. Correlation gain in amplitude for infinite bandwidth BOC (2, 1) signals.

Implementing a standard linear search technique the BOC modulation increases the search complexity compared to its underlying PSK modulation. There are a number of different approaches proposed in the literature to combat the complexity, each with different receiver hardware requirements. Here we focus on the BOC search techniques: direct search using circular correlation that performs direct BOC acquisition using FFT units for a code domain search, single sideband processing (Betz Reference Betz1999), (Fishman Reference Fishman and Betz2000) and sub-carrier cancellation (Ward Reference Ward2003), (Heiries Reference Heiries2004) which have used in current Galileo BOC receiver designs, see (De Wilde Reference De Wilde2006) and (Blunt Reference Blunt and Weiler2007a). For all these approaches the sine and cosine phased BOC signals are compared.
5. DIRECT SEARCH OF BOC SIGNALS USING CIRCULAR CORRELATION
The implementation of the circular correlation with FFT based methods has increased the search speed for existing PSK signals, thus an application for the BOC signals should be considered. As mentioned above the sample rate and the code slew resolution are coupled when using a FFT method. The algorithm for a direct BOC search using a FFT unit is depicted in Figure 8, which is very similar to the algorithm for PSK. The local generated spreading code is replaced by a local generated BOC modulated spreading code resulting in the auto-correlation function described in Figure 7.

Figure 8. Direct BOC signal FFT search algorithm.
5.1. Performance of the circular correlation based BOC search
Monte Carlo simulations were used to assess the performance of the direct FFT algorithm on the different BOC signals. The modelling is similar to that of the PSK FFT search extended to the multiple BOC autocorrelation peaks. Such analysis would go beyond the scope of this publication. Six different BOC signals were considered: a BOC (1, 1), a BOC (2, 1) and a BOC (6, 1) signal, all signals in sine and cosine sub-carrier phase variety. Four of these signals have the same code to sub-carrier ratio as existing BOC signals in GPS and Galileo (sine BOC (1, 1), sine/cosine BOC (2, 1) and cosine BOC (6, 1)). The simulation executed the search process 3000 times on each carrier to noise density level. The carrier to noise density range went from 30 dB-Hz to 50 dB-Hz in half dB steps. To ensure a realistic environment both main-lobes of the spectrum were considered and the sample-rate was chosen to cover these two main lobes. Sampling with an integer multiple of the code frequency introduces several problems (Akos 2006), so that a realistic sample rate is ![]() higher than the minimal sample rate was therefore taken. Table 3 shows the signal bandwidths, the required theoretical sample rate to cover the bandwidth and realistic receiver sample rate. The intermediate frequency was selected to be 5/4 of the sample rate of each individual signal. Also shown in Table 3 are the samples per sub-chip when using the specific sample rate. The different number of samples per sub-chip influences the performance of circular correlation based search algorithms as the sample-rate and the code-slew rate are tightly coupled in this algorithm. The number of samples per sub-chip is the inverse of the code search granularity. Four samples per sub-chip leads to a code-slew of a quarter of a sub-chip when using this search algorithm. Different code-slew rates for different signals result in a different probabilities of successful search, as shown in Figure 9. The figure shows the result for direct BOC acquisition considering an average correlation gain. It can be seen that the higher BOC-rate signals perform worse, but the degradation is reduced for the highest BOC rate due to successful detections of side peaks of the autocorrelation function.
higher than the minimal sample rate was therefore taken. Table 3 shows the signal bandwidths, the required theoretical sample rate to cover the bandwidth and realistic receiver sample rate. The intermediate frequency was selected to be 5/4 of the sample rate of each individual signal. Also shown in Table 3 are the samples per sub-chip when using the specific sample rate. The different number of samples per sub-chip influences the performance of circular correlation based search algorithms as the sample-rate and the code-slew rate are tightly coupled in this algorithm. The number of samples per sub-chip is the inverse of the code search granularity. Four samples per sub-chip leads to a code-slew of a quarter of a sub-chip when using this search algorithm. Different code-slew rates for different signals result in a different probabilities of successful search, as shown in Figure 9. The figure shows the result for direct BOC acquisition considering an average correlation gain. It can be seen that the higher BOC-rate signals perform worse, but the degradation is reduced for the highest BOC rate due to successful detections of side peaks of the autocorrelation function.

Figure 9. Probability of successful search of sine modulated BOC signals with the average correlation gain.
Table 3. Sample rate and sub-chip relations of different BOC signals.

5.2. Difference of sine and cosine phased BOC signals in direct circular correlation
Sine and cosine phased BOC signals perform differently in the search process. The difference of sine to cosine phased BOC modulated signals is shown in Figure 10 for BOC (2, 1) signals and in Figure 11 for BOC (6, 1) signals displaying in both cases the minimum and the average gain. The different gains, resulting from a geometric difference displayed in Table 2 for the BOC (2, 1) case, result in a reduced probability of successful search for cosine phased signals. Of particular interest are the two BOC (2, 1) signals as this ratio of sub-carrier frequency to code rate is used in existing GNSS systems with both sine and cosine subcarriers. The average gain cosine signal has a search probability of 50·4% and the average gain sine signal of 58·2% for a C/N 0 of 41 dB-Hz. This degradation comes from a narrower main peak in the cosine autocorrelation shape, shown in Figure 5 and band limiting, which affects cosine phased signals more.

Figure 10. Probability of successful direct search of sine and cosine BOC (2, 1) modulated signals.

Figure 11. Probability of successful direct search of sine and cosine BOC (6, 1) modulated signals.
The difference between sine and cosine phased signals is less significant at a higher sub-carrier rate. In Figure 11 the difference is displayed for a BOC (6, 1) signal. The cosine phased BOC modulation introduces two more side-peaks to the auto-correlation function; the effect of these two additional side peaks is less significant when the number of peaks is larger anyway. The cosine signal contains more high frequency content; and so the spectral energy is further away from the band centre. Filtering affects cosine signals more than sine signals as indicated in Figure 14, resulting in a reduced probability of detection.
6. SUB-CARRIER-CANCELLATION
Another approach to BOC search is to synthesise an unambiguous search function by using quadrature or orthogonal BOC correlations. This search technique was first proposed in Ward Reference Ward2003 and subsequently has been coined the ‘sub-carrier cancellation’ (SCC) technique (Heiries Reference Heiries2004). This technique works by combining correlations of the incoming signal with both sine-phased and cosine-phased BOC signal replicas as shown in Figure 12. This technique has the advantage of requiring no additional filtering and can be applied to any BOC signal. The additional correlations can also be used in BOC tracking techniques (Hodgart Reference Hodgart, Blunt and Unwin2007). The correlation result of the SCC is shown in Figure 13 for a BOC (2, 1) signal with sine and cosine phased sub-carrier. The resulting function approximates the single peak of a PSK autocorrelation function and search granularity of a half-chip can now be used, to accelerate the search process.

Figure 12. Correlator structure for sub-carrier-cancellation.

Figure 13. Sub-Carrier-Cancellation of sine (left) and cosine (right) BOC (2, 1) signals.
The SCC search technique creates an approximation of a single PSK-like correlation peak. The advantage of this is clear compared to the traditional linear search technique because using SCC allows code searches with wide granularity, which significantly reduces the linear search time. Comparing Table 4 and Table 2 we can see that the SCC technique provides approximately the same correlation gain as a conventional BOC (2, 1) search with code search granularity four times wider. Comparing sine-phased BOC (2, 1) with cosine-phased BOC Table 4 also reflects the results of Table 2 finding that the cosine variety has a slightly worse search performance.
Table 4. Correlation gain in amplitude for BOC (2, 1) signals using sub-carrier-cancellation with half chip sampling.

Applying a filter with a bandwidth of 8 MHz affects the cosine BOC (2, 1) signal more than the sine BOC (2, 1) signal. This bandwidth is chosen to be equivalent with the bandwidth used for the BOC (10, 5) signal transmitted by the Galileo satellites. The SCC autocorrelation functions for cosine BOC (2, 1) signals band-limited to 8 MHz along with the unfiltered autocorrelations are shown in Figure 14.

Figure 14. Sub-carrier-cancellation of sine (left) and cosine (right) BOC (2, 1) signals. Signals band limited to 8 MHz are shown in red; the unfiltered signals are shown in blue.
Table 5 gives the gain values for the band-limited SCC autocorrelations. Again the cosine-phase BOC signal is shown to perform slightly worse than its sine-phased counterpart.
Table 5. Correlation gain in amplitude for BOC (2, 1) signals using sub-carrier-cancellation and considering filtering.

6.1. Probability of detection for Sub-Carrier-Cancellation
The effect of the sub-carrier is now removed by forming the envelope according to ![]() for an incoming BOC signal with a sine-phased sub-carrier and
for an incoming BOC signal with a sine-phased sub-carrier and ![]() for an incoming BOC signal with a cosine phase sub-carrier. The assumption to form the probability density function for no signal present is white Gaussian noise for all correlation results. The probability density function of the noise is composed by the summation of two Rayleigh distributed random variables. An approximation for the PDF of the summation is formulated in Hu 2005 as follows:
for an incoming BOC signal with a cosine phase sub-carrier. The assumption to form the probability density function for no signal present is white Gaussian noise for all correlation results. The probability density function of the noise is composed by the summation of two Rayleigh distributed random variables. An approximation for the PDF of the summation is formulated in Hu 2005 as follows:

The probability density function of N noise samples for the SCC combination being less than the value x can be written as follows:
The blue curves in Figure 15 shows the theoretical noise floor based on the approximation to the Rayleigh sum distribution and the Monte Carlo simulated noise of our receiver representation using sub-carrier-cancellation envelope calculation. As shown in Figure 15 the approximation achieves good agreement with the simulated results.

Figure 15. Probability density functions of the direct BOC and Sub-carrier-cancellation correlation results (40 dB-Hz) and their associated noise components.
When a signal is present the envelope is formed by the summation of two random variables that follow a Ricean distribution. The offset is dependent on the C/N 0. This summation can be approximated with a κ-μ distribution according to Santos 2005, the parameters of the κ-μ distribution are calculated using the statistical moments of the summation of the Ricean distributed variables. In Figure 15 the result of a Monte Carlo simulation (1000 runs) of a signal with a carrier to noise density of 40dB-Hz is plotted in red together with the theoretical approximation of the summation of Ricean variables. The model of the Ricean sum using the κ-μ distribution is too extensive to be detailed here, for derivation see Santos 2005.
The Rayleigh and the Ricean distribution from the case of direct BOC modulated signal, displayed with black points in Figure 15, are now replaced with two different distributions. The new distributions are a good approximation for the result of the sub-carrier-cancellation. The mean of the SCC distribution is significantly higher than a PSK signal with the same C/N 0 level (see Figure 2). This increase is due to the additional noise correlations combined to form the SCC envelope. In comparison with PSK a higher threshold is needed (3·375 instead of 1·915) to maintain the same false detection rate of 16%. This threshold leads to a probability of detection of 98·5% in this scenario. This is more than one percent less than the direct search without sub-carrier-cancellation. Sub-carrier-cancellation however allows the search to be carried out with fewer trials in the code domain and thus increases the speed significantly with a slight degradation of the probability of detection.
7. SINGLE SIDE BAND SEARCH
The ‘single sideband (SSB) acquisition’ technique was proposed in Betz 1999. This method treats each of the two BOC sidebands as separate PSK signals. It requires independent filtering of each sideband. In addition, each sideband must have a separate carrier demodulation stage, requiring an additional local oscillator to be implemented in the receiver's correlator architecture. Figure 16 shows the receiver hardware required for BOC acquisition using the SSB technique combined with search based on circular correlation. The BOC sidebands can be separated using analogue filters. However, either a multiplexed or additional ADC stage will be required. Using digital filters imposes considerable demands on the receiver's correlator resources. The advantage of having two PSK like signals is the possibility of using well established algorithms existing for PSK, in the case of Figure 16 the code domain search using FFT units.

Figure 16. Correlator structure for single-side-band-search with non-coherent combining using digital filtering.
The result of a SSB search is an unambiguous PSK correlation peak. If only one sideband is tracked, a reduction of 3dB or greater, (filter dependent) in signal power is inevitable. It has been shown (Fishman Reference Fishman and Betz2000) that applying the single sideband technique to each side-lobe and combining non-coherently as shown in Figure 16 almost compensates for the signal power loss. This technique can easily be implemented to BOC signals which are well separated from the centre frequency, but would require an extremely sharp filter roll-off (Nyquist filtering) for narrowly spaced signals, such as BOC (f, f). Therefore, the SSB technique is best applicable for BOC signals whose sub-carrier frequency is greater than the code rate.
7.1. Probability of detection for single-sideband and direct BOC search
To analyse the difference of sine and cosine phased BOC signals when using a single-side-band search, the algorithm of Figure 16 was simulated. The signals considered are the sine and cosine phased BOC (2, 1) signals with a sample rate according to Table 3, the sample-rate is chosen higher than needed to investigate the ideal case for single-sideband. Having a PSK-like signal would also allow a lower sample rate but to allow comparisons to be drawn the same parameters as for the direct acquisition are used. In a real system re-sampling would be used to reduce the number of points in the circular correlation and thus optimise the hardware and the search time. But for an assessment of the difference of sine to cosine phased BOC signals this model is sufficient.
The probability of successful search is displayed in Figure 17 for a sine and cosine BOC (2, 1) signal. The probability is in the same range as for the direct search in Figure 10. The important point here is that the treatment of the BOC signal as two separate PSK signals reduces the difference between search performance for sine and cosine phased BOC signals. The dependence of the sampling interval described in Table 2 and Table 3 is not relevant as the PSK peak is significantly oversampled and thus the loss insignificant. The remaining difference is due to the lower spectral energy of the cosine phased signal as a result of band-limiting.

Figure 17. Probability of successful single sideband search of sine and cosine BOC (2, 1) modulated signals.
8. CONCLUSION
In this paper the search performance of various BOC signals was analysed and a comparison drawn between three different approaches to BOC signal search. It has been shown that sub-carrier-cancellation and single sideband techniques are beneficial for the search process; they can greatly reduce the average time needed to find a signal but have drawbacks in sensitivity. A mathematical description of the FFT search process for PSK signals was derived and verified with simulations to derive the fundamentals for the search for BOC signals.
The performance of the BOC signals search was presented for various BOC signal varieties. The mathematics describing the BOC signals was extended to include also the cosine phased BOC signals.
The most important contribution is analysis of the search performance of the sine and cosine BOC signals. It has been shown that cosine BOC signals have a lower probability of successful search. Of particular interest is the lower performance of the cosine BOC (2, 1) signal, whose results can be transformed to the GPS sine BOC (10, 5) and the Galileo cosine BOC (10, 5) signals. The properties of the cosine signals, which may lead to a lower timing jitter (Blunt Reference Blunt2007b), do result in poorer search performance. The maximal degradation is more than 7% when using a direct search approach. However, when using sub-carrier-cancellation the difference is reduced and when searching with the single-sideband method there is almost no difference visible between sine and cosine phased signals. The 7% degradation in the direct search is the worst case possible. In a real system however, longer coherent and non-coherent correlations are used, allowing compensation for this effect. There is therefore no need for a specific search algorithm for cosine modulated signals.
ACKNOWLEDGMENTS
Firstly, I would like to thank very much Mitsubishi Electric Europe whose kind sponsorship provided me with the environment to work on this research. In particular I would like to thank Rob Heaton and Nongji Cheng for their constant support. I would also like to thank the members of the GNSS team at Surrey Satellite Technologies Limited for frequent inspirations. Last but not least I would like to express my appreciation for the help from Paul Blunt whose input given in his free time made this publication possible.


