


1. INTRODUCTION
Determining fairway width, in order to ensure an adequate level of safety of navigation, is a complex process. That process starts before a new fairway is built and continues during fairway exploitation. One of the reasons why the process is a continuous one is that ships sizes (length, width and draught) are constantly increasing. The process can be divided into two stages: conceptual and detailed design. In Permanent International Association of Navigation Congress (PIANC) (2014) report No. 121: Harbour approach channels – Design guidelines, conceptual design is defined as a preliminary stage of fairway design in order to estimate rough dimensions. Detailed design is described as a more rigorous process, which follows the conceptual design, to determine the final dimensions of the fairway. The described design methodologies can be used both on existing fairways and for new fairways. Conceptual design uses empirical and deterministic methods and formulae which are determined during the research process of certain ship hull forms and fairway types. These methods are fast and adequate for the conceptual stage, but the resulting dimensions are rough, and the fairway is in most cases over-dimensioned, due to high safety factors which are included in the formulae. This is acceptable for areas where additional dredging is not required, and where a large area (width and depth) is available for ship navigation. In areas where dredging is most likely required, a detailed stage has to be carried out. The detailed stage in most cases uses navigational simulators, real time or fast time, in order to determine the ship trajectory, which can be used to determine fairway dimensions. Nowadays, ship simulators use reliable mathematical and hydrodynamic models which predict real ship dynamic trajectories very accurately. However, this is a very long and costly process, because it is necessary to prepare the project area and project vessel, find suitable and experienced personnel, perform a great number of simulations and finally analyse the gathered data.
In order to improve deterministic methods for determining fairway width, in this case additional width due to ship-bank interaction, a navigation simulator is used to propose a reliable deterministic model. Such an approach uses the benefits of a navigational simulator and eliminates most of the necessary preparations since they are included in the process of model design. The created model enables users, in the conceptual design phase, to determine accurate additional fairway dimensions due to ship-bank interaction, which can eliminate additional costs without impairing with the safety of navigation.
For the work reported here, the research methodology was divided into several stages. Stage one included determining the fairway conditions and selecting vessel models. This included establishing fairway depth, slope, vessel distance from the bank, Under Keel Clearance (UKC) and vessel speed. Also, in this stage, vessel motion was tested in order to determine the differences between different autopilots and hand steering. The second stage included performing simulations and data mining. After all simulations were completed, the collected data was organised and analysed. This also included comparing the gathered ship-bank forces with other similar research to verify simulator reliability. The last stage consisted of analysing vessel trajectories and determining the cross-track error which was then used as input data for the model. The determined model was tested with a control data pack, which was gathered using similar ship types and fairway conditions in a simulator and the determined model was compared with international recommendations for ship-bank distance.
2. BANK EFFECT
When a ship enters a restricted fairway, the asymmetric flow around a ship induced by the vicinity of banks causes pressure differences between port and starboard sides. This results in lateral forces acting on the ship, mostly directed towards the closest bank, as well as a yawing moment pushing the bow towards the centre of the waterway. This is how Lataire et al. (Reference Lataire, Vantorre, Laforce, Eloot and Delefortrie2007) describe the bank effect. Lataire et al. (Reference Lataire, Vantorre, Laforce, Eloot and Delefortrie2007) also state that the bank effect will depend on the bank shape, water depth, ship-bank distance, ship properties and ship speed. Researchers in the field, such as Norrbin (Reference Norrbin1976; Reference Norrbin1985) and Vantorre et al. (Reference Vantorre, Delefortrie, Eloot and Laforce2003), have tried to propose a reliable model for predicting ship-bank forces.
Serban and Panaitescu (Reference Serban and Panaitescu2015) state that a reduction in the distance between the hull and the channel boundary influences the hydrodynamic forces. The produced hydrodynamic forces may affect the manoeuvring performance of the ship considerably, especially in extremely shallow channels and canals, making it difficult to steer. The ship may collide with the side bank and/or run aground due to this phenomenon. This phenomenon is confirmed in the research by Sian et al. (Reference Sian, Maimun, Priyanto and Ahmed2014), which assessed the ship-bank interaction on a Liquid Natural Gas (LNG) tanker. The research concluded that for a given ship-bank distance, the bank effect is more pronounced with an increase in ship's speed.
Regarding the safety of navigation, Barrass (Reference Barrass2004) defended the general rule of thumb regarding interaction forces. It is generally known that a reduction in speed is the best preventive measure. Also, in determining ship squat, the same author divided vessels by form. Vessels with a block coefficient larger than 0·7 (Cb > 0·7) are considered to be full form vessels and vessels with a block coefficient lower than 0·7 (Cb < 0·7) are considered as fine form vessels. Demirbilek and Sargent (Reference Demirbilek and Sargent1999) describe the bank effect on vessel manoeuvrability. A vessel in a confined channel does not respond as quickly to rudder and engine commands because of channel bank effect, reduced speed and confined propeller/rudder dynamics.
Besides the ship speed, Eloot and Vantorre (Reference Eloot and Vantorre2011) investigated the influence of bank slopes on bank effect. In this research, a towing tank was used, and the results showed that if ships sail above the slope, sloped banks generate greater force than vertical banks and thus present a greater risk to safety of navigation.
All of the above-mentioned literature analyses the hydrodynamic forces around the ship's hull. That is a well-known phenomenon in shallow water and restricted fairways and reliable models have been developed. However, for practical use, none of the models and research has defined the ship trajectory caused by interaction forces and fails to propose the minimum required distance between the ship and the bank to avoid contact. This is possible only by means of navigational simulators which use such hydrodynamic models to precisely assume the vessel trajectory, but that is a long and costly process and such information is necessary in order to establish an adequate level of safety during ship navigation in restricted fairways and in the design stage of a new fairway. Using the proposed model, additional width due to ship-bank effect can be determined more precisely and quickly without using simulators.
3. ADDITIONAL RESTRICTED FAIRWAY WIDTH DUE TO BANK EFFECT
International recommendations, such as PIANC Harbour Approach Channels Design Guidelines Report No. 121-2014 (PIANC, 2014), Puertos Del Estado (1999) Recommendation for Maritime Works ROM 3·1-99. Designing Maritime Configuration of Ports, Approach Channels and Floatation Areas, and the Japanese Ministry of Land, Infrastructure, Transport and Tourism (MLIT) (2009) Technical Standards and Commentaries for Port and Harbour Facilities in Japan, are generally used for determining fairway dimensions. Such recommendations use deterministic methods, which define fairway width as the sum of the basic width and additional width due to external forces. The difference between these methods is observed through the process of determining the basic and additional widths.
The PIANC (2014) methodology is the simplest to use and the most predetermined. The width of a one-way fairway using this method consists of the sum of the basic width, additional width due to external forces of the wind, currents, waves and the bank effect. Every element is predetermined and given as a coefficient which is multiplied by the ship's width, whereby the magnitude of the coefficient depends on the given fixed parameters. The final result is the sum of all elements which include a certain amount of safety factor, due to general application of the given method as given by:
 $${Width}_{one-way} = W_{BM}+\sum W_{i} +W_{BR}+W_{BG} $$
 $${Width}_{two-way} = W_{BM}+2\sum W_{i} +W_{BR}+W_{BG}+W_{p} $$
where W BM is the width of the basic manoeuvring lane, ∑ W i is the sum of additional width due to external forces of the wind, currents, waves, W BR and W BG are bank clearances on both sides and W p is the passing distance in a two-way fairway. The result of this approach is an over-dimensioned fairway, with a great level of safety and very large cost if dredging is required.
In the Japanese MLIT (2009) methodology most of the data is determined using given formulae and a small part is predetermined. In this method the basic fairway width includes additional width caused by external forces, which is determined by given formulae. Additional width is added due to external forces and a safety factor which is determined using risk assessment methods. This method, in comparison with the other two described methods, is the most accurate. All of the given formulae are the result of research which was conducted in situ or in towing tanks. Also, the given formulae allow the user to obtain accurate fairway dimensions with an adequate level of safety as given by:
 $${Width}_{one-way}=\lpar W_{BM}+W_{IF}\rpar C_{SF} $$
where W BM is the width of the basic manoeuvring lane, W IF is the additional width due to interaction forces and C SF is the safety factor based on risk level. For a two-way fairway, the width is obtained by the same formula with additional width between two tracks, which is determined by the ship type.
The Puertos Del Estado (1999) method for determining fairway width is a combination of two other methods. Half of the elements are predetermined, and the other half are calculated by the user. In this method the basic width of the fairway is equal to ships' width and additional widths are determined by drift angles caused by external forces which are calculated separately. Other elements, such as bank effect, position errors, vessel reaction time are predetermined and calculated using coefficients. The additional width due to vessel reaction has included risk analysis. This method provides simplicity in order to promptly obtain fairway dimensions with an adequate level of accuracy, without over-dimensioning the fairway width as given:
 $${Width}_{one-way}=B+b_{d}+2\lpar b_{e}+b_{r}+b_{b}\rpar +\lpar {rh}_{sm}+{rh}_{sd}\rpar _{i}+\lpar {rh}_{sm}+{rh}_{sd}\rpar _{d} $$
where B is the maximum width of a ship, b d is the additional width due to ship's swept path produced by a certain drift angle, b e is the additional width due to position errors, b r is the additional width due to navigator reaction time, b b are errors due to fairway marking system, rh sm is the additional bank safety clearance and rh sd is the bank safety margin. The two-way fairway dimension is obtained by adding additional width between fairways.
All three described methods predefine the additional width due to bank effect. PIANC (2014) provides additional width for inner sheltered and outer exposed fairways. The width is determined by the bank slope and vessel speed. However, only input data is described (Table 1), which means they are not defined by a specific number and depend mostly on the user's assumptions.
Table 1. PIANC (2014) bank effect additional fairway width calculation

Puertos Del Estado (1999) provides additional width due to ship-bank force using similar input data, bank slope and vessel speed. In this method, bank slope and ship speed are defined by a number. The final width is the sum of two values, the clearance of the bank and the safety margin or unhindered horizontal clearance which must always be available between ship and bank (Table 2).
Table 2. Puertos Del Estado (1999) bank effect additional fairway width calculation

MLIT (2009) only provides data for fairways with vertical or structural banks, which is given as a distance for 15 different ship types. The provided values were determined in towing tanks and represent the distance from the bank where a small rudder action (up to 5°) can overcome bank forces.
It can be seen that all three methods provide predetermined additional width due to bank effect which is not accurate or adequate to satisfy the detailed design stage. The most accurate data is provided by in situ research and in towing tanks or using navigational simulators. However, that is a time-consuming and costly process. Ideally, the best method would include simulator or towing tank data accuracy and the use of deterministic methods. The proposed model combines these two methods, because it includes data gathered from a simulator and provides a very accurate formula. This enables the improvement of current recommendations for additional fairway width due to bank effect and facilitates the process of fairway design.
4. DATA GATHERING PROCESS
In order to prepare the model, an adequate amount of entry data is required. In this research, entry data was gathered using a full mission navigational simulator, a Transas NaviSailor 5000 v5·35 (2016). To authentically reproduce a vessel trajectory, such a simulator incorporates all mathematical and hydrodynamic force models which are tested and verified by the manufacturer. The purpose of this research was not to test the simulator's ship-bank interaction model or to propose a new ship-bank interaction hydrodynamic model (a nautical simulator is not an appropriate tool for such research, Computational Fluid Dynamics (CFD) software is more representative and credible) but to use the simulator to determine the trajectory and cross-track error due to ship-bank effect and based on those factors propose a deterministic model for determining the fairway additional width due to such an effect.
Before performing the simulations, it was necessary to prepare the simulation scenarios, the fairway and ship models. Three fairway types were designed, using the Transas Model Wizard program package (Transas, 2019), a fairway with a vertical bank, a steep slope bank (height length ratio 1:2) and a medium sloped bank (height length ratio 1:4). For this research, the models of three fine formed ships were selected; two container ships and one pure car carrier. Data of the ship models used are shown in Table 4.
Simulation scenarios parameters were the following: the UKC was set to depth draught ratio (h/T) 1·2 and 1·5 accordingly for every ship model, ship speed was 2·5 m/s, 3·75 m/s and 5 m/s, ship-bank distance was 10, 20, 30, 40 and 50 metres, and there were no external forces of wind, waves and currents.
The UKC, expressed through depth-draught ratio, was selected because h/T = 1·2 (according to PIANC (2014)) represents limited depth, and h/T = 1·5 represents sufficient depth for safe ship navigation with a small possibility of touching the bottom. A vessel speed of 2·5 m/s is in most cases the lowest safe speed where the ship reacts to rudder commands. Ship speed over 5 m/s is the assumed to be the speed which represents a risk for the safety of navigation in narrow fairways. Bank distances from 10 to 50 metres represent the minimum and maximum values of ship-bank distance for safe navigation where ship bank forces have significant impact on the ship trajectory (Table 3). The distances were measured on sloped banks from the ship hull to the grounding point (Figure 1).
Table 3. MLIT (2009) bank effect additional fairway width calculation

Table 4. Ship models used in simulations


Figure 1. Measuring the ship-bank distance (d) on sloped banks.
Ship steering was set to autopilot. Preliminary research was conducted to investigate how a ship reacts to bank force on manual and autopilot steering. During this phase it was noticed that the initial impact of ship-bank force has the largest impact on ship trajectory, after which ship trajectory stabilises, both on manual and autopilot steering (Figure 2). It is important to emphasise that the difference between manual and automatic steering is only in the trajectory stabilising stage after the initial ship-bank force impact which is not part of this research and enables the use of autopilots in simulations. Also, during the vessel trajectory stabilising stage, it was noticed that autopilot track control setting was most similar to manual steering in comparison to head on autopilot setting. In head on autopilot setting, the ship swayed away from the designated route, while on track control setting the ship was swaying and yawing and the ship stayed closer to the designated route. Autopilot steering enables identical situations for all simulations.
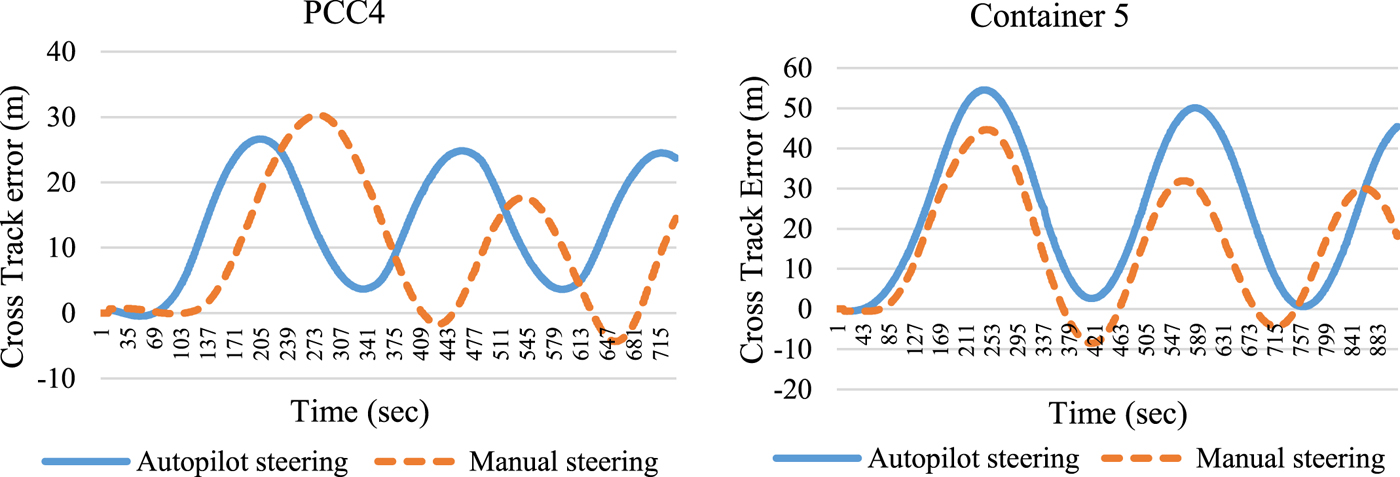
Figure 2. Vessel trajectory comparison between manual and autopilot steering in bank proximity.
Human reaction was also tested. The proper action, when ship-bank force occurs, would be to turn the helm towards the bank in order to reduce the ship sway moment, but the improper action would be to turn the helm to the opposite side which would lead to an increasing sway moment induced by bank effect. Model tests showed that for this type of vessel, if improper action is taken, the cross-track error will be 16% higher than in the case when proper action was taken.
In total, there were 540 real time scenarios (simulations), and every scenario was repeated five times in order to confirm the stability of simulator data. In each case, the following parameters were measured: lateral ship-bank force, UKC, cross track error, yawing and ship speed.
5. MODEL
All data gathered through the simulation process was analysed in order to determine the ship trajectory due to ship-bank effect. Every simulation gave a certain amount of input data for each measured parameter which was first analysed using a Pearson correlation matrix. At first, nine parameters were used (Table 5).
Table 5. Model input parameters correlation analysis

The parameters of ship dimensions (Table 5) showed a great amount of collinearity which would give false positive results in the model and overfitting (Figure 3). To avoid that, the ratios of ship dimensions were used in the model; in this case, ship's length overall and width. This dimension ratio was chosen because it yielded the best results in the model testing stage.
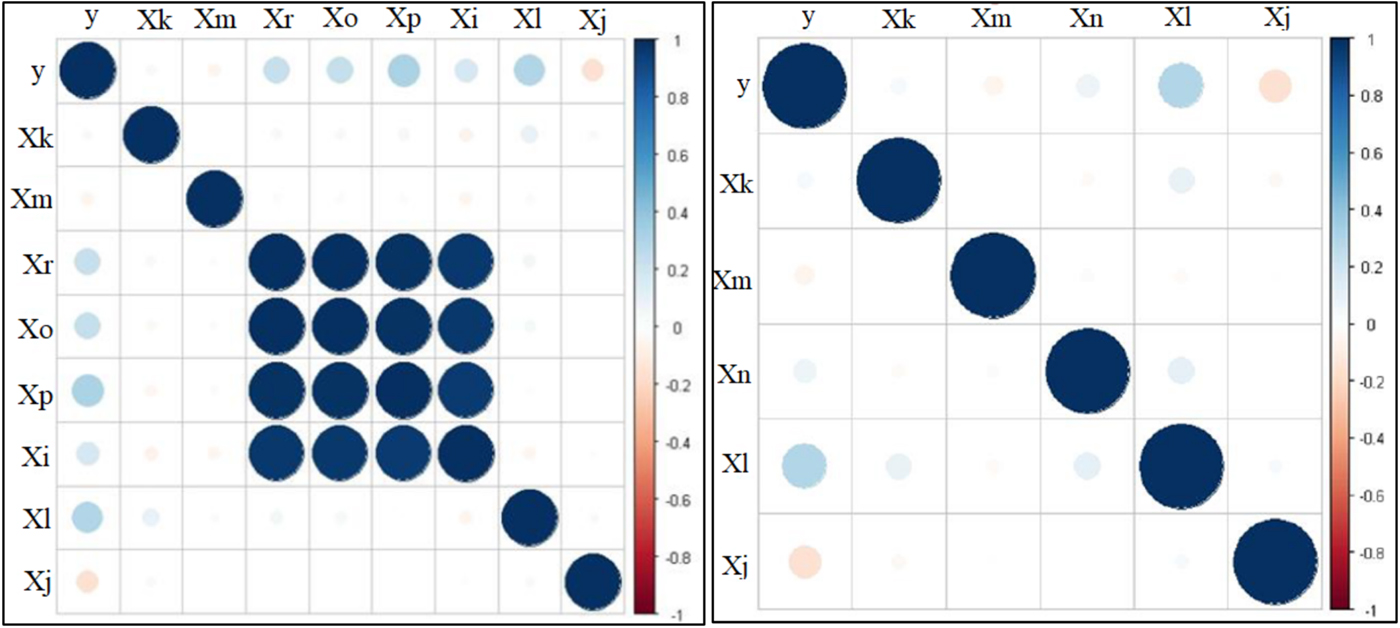
Figure 3. Model parameters input data correlation testing (Pearson correlation). Blue and red dots represent the level of correlation, as the dot gets bigger the level of correlation is greater.
After changing the input data, the data sets were also divided into two groups. A larger amount of data, approximately 70%, was used as model input data. The rest was used as the model testing data set. This ensures that the model is reliable and that there is no overfitting of the model.
During simulations, the lateral ship-bank force was measured and analysed. However, this was not used in the model as input, because it was not available during fairway dimension design, and was used only as information to prove the simulator model accuracy.
Figure 4 shows ship-bank forces measured in the scenarios. The y-axis shows the measured forces and the x-axis shows the scenarios divided by distance from slope, slope type and ship speed. As can be seen, the force increases with ship speed. However, the biggest force is recorded with a medium sloped bank (1:4) and h/T = 1·5 ratio. That is because in the simulation the ship was over the slope and the ratio between fairway cross-section and ship cross-section was reduced. This phenomenon also occurred in Lataire et al. (Reference Lataire, Vantorre, Laforce, Eloot and Delefortrie2007), where the authors tested a container ship model in a towing tank with similar banks (vertical bank and sloped bank). The results showed the increment of force when the ship model was near the slope bank in comparison to a fairway with a vertical bank (Figure 5). This confirms the accuracy of ship-bank interaction force data generated by the simulator and the reliability of the model used on the simulator.

Figure 4. Force measured in simulated scenarios. Dashed lines represent force for h/T = 1·2 and dots for h/T = 1·5. Scenario description at x axis as follows: distance from bank, slope type, vessel speed.

Figure 5. Sway force induced by sloped and vertical bank on a container ship (Lataire et al., Reference Lataire, Vantorre, Laforce, Eloot and Delefortrie2007).
After the input data was prepared, the model was generated. In this case, for generating the model, multiple polynomial regression was chosen and generated using MathWorks software, Matlab R2009b (2009). This regression used unknown parameters and their estimation using the least squares method. In this model the estimation of coefficients is made using the given expression:
 $$\varepsilon \lpar a\rpar =\sum_{1\le Xj\comma Xk\comma Xl\comma Xm\comma Xn\le 5} \lpar y_{1}-y_{Xj\comma Xk\comma Xl\comma Xm\comma Xn}\rpar ^{2}=\min_{\wedge} $$
where term y 1 represents results from measurements and term y Xj, Xk, Xl, Xm, Xn are modelled results using input parameters. The model is validated using the adjusted multiple correlation coefficient defined by the following expression:
 $$R_{corr}^{2}=1-\displaystyle{{\lpar y_{1}-y_{1}^{\wedge}\rpar }\over{\lpar y_{1}-y_{1}^{-}\rpar }}{\cdot} \displaystyle{{n-1}\over{n-k-1}}\comma \; $$
where n represents the number of input data, k the number of regression coefficients, ŷ 1 are modelled data and  $\bar{y}_{1}$ represents the arithmetic mean of the dependant input variables. The best result for the model was generated using multiple polynomial regression of the fourth degree, and the model final expression is:
 $$\eqalign{y & =a_0+\sum_{j=1}^{5}a_jx_j+\sum_{1\le j\comma k\le5}a_{jk}x_jx_k+ \sum_{1\le j\comma k\comma l\le5}a_{jkl}x_jx_kx_l \sum_{1\le j\comma k\comma l\comma m\le5}a_{jklm}x_jx_kx_lx_m \cr & \quad +\sum_{1\le j\comma k\comma l\comma m\comma n\le5}a_{jklmn}x_jx_kx_lx_mx_n} $$
where a represents regression coefficients and there are 92 regression coefficients in this expression. The accuracy of the model expressed by the corrected multiple correlation coefficients is 0·9775. To appreciate the model, a comparison between certain modelled and simulator-gathered vessel cross track error (vessel movement from the desired track due to interaction forces) is shown in Figure 6.

Figure 6. Comparison between certain modelled and gathered data.
The comparison of ship-bank distance given by PIANC (2014), Puertos Del Estado (1999) and MLIT (2009) and modelled data is given in Table 6. The data in the table are given for different conditions and are shown as a ratio between ship-bank distance and ship width. Also, for easier understanding and comparison, the modelled data are shown in Figures 7 and 8.
Table 6. Comparison of ship-bank distance given by PIANC (2014), Puertos Del Estado (1999) (ROM 3·1), MLIT (2009) and modelled data.


Figure 7. Comparison of values for ship-bank distance with h/T = 1·2 ratio.

Figure 8. Comparison of values for ship-bank distance with h/T = 1·5 ratio.
Figure 7 shows a data comparison of ship-bank distance with ratio h/T = 1·2. The bars represent the ratio between the ship-bank distance and the ship's width if proper rudder action was taken and the black lines represent an increment due to improper rudder action. The chart clearly shows that there is a great difference between ship-bank distances given by analysed recommendations and modelled data. This is because the recommendations are only general and do not include other important parameters which are included in the proposed model. Also, the recommendations include large safety factors. The recommendations from MLIT (2009) are given only for fairways with vertical banks and there is no input data for sloped banks. The recommendations from PIANC (2014) are given for different ship speed and fairway slopes; however, they are very general and do not represent real situations. For the cases with moderate slopes, PIANC (2014) states that it is not necessary to have an additional ship-bank distance, whereas the model data contradicts this in cases where a ship can sail over a bank slope.
The provisions from Puertos Del Estado (1999) are also general, but these recommendations recognise the danger of sloped banks. A similar situation can be found in Figure 8, which represents the comparison of values for ship bank interaction with h/T = 1·5.
Figure 8 shows that for situations with bigger UKC the required ship-bank distance is smaller compared to the situations with smaller UKC. However, this depends on the fairway situation, but most of all on ship's speed. In this case, the biggest difference occurs for fairways with vertical banks and steep slope banks (ratio 1:2). For fairways with moderate slope banks (ratio 1:4) there is a small difference between the model proposed and the analysed recommendations for the required minimum ship-bank distance. This can be explained by the safety factor involved in the recommendations, which is determined by the type of ship bank.
6. CONCLUSIONS
Through the analysis of the recommendations for fairway dimensions, it can be seen that the required minimum ship-bank distance is the least developed part. In all analysed cases it is predetermined in relation to ship width and there is a small amount of input data. A possible reason could be the design process itself, because ship-bank distance is the last parameter in determining the fairway additional width and by the time other parameters are determined, the fairway width is considerably increased. Also, most of the ship-bank interaction is defined for fairways with vertical banks and the result of research are ship-bank forces, moments and their prediction which are then used on sloped banks. This leads to recommendations which are not realistic, which is shown through this and other research which have proved that sloped banks in particular cases could generate significant ship-bank forces. The deterministic model proposed here enables the user to quickly determine the additional width due to ship-bank effect based on fairway and vessel data with greater accuracy. This expands the availability of deterministic methods in the detailed stage of fairway determination processes. However, sometimes it will be necessary to further test the given data based on local circumstances. It is necessary to emphasise that in the proposed model there are no safety factors, as they are included in the analysed recommendations. These safety factors should be determined by user for specific situations on the fairway which is being analysed. Future research will include more ship models and more fairway types in order to expand the application and improve the accuracy of the proposed method.


