1. INTRODUCTION
There is increasing activity in space inspired by economic potential and scientific curiosity. According to the plans released by a number of national space agencies, over the next 20 years, approximately 40% of space missions will operate at Medium Earth Orbit (MEO), Geosynchronous Orbit (GSO), Highly Elliptical Orbit (HEO) and Cislunar/interplanetary (Cáceres, Reference Cáceres2008). There is therefore, increasing demand for navigation capability for space vehicles. The existing technology for navigation can be categorized into two types: ground monitoring and on board navigation systems. The former is based on traditional combined Very Long Baseline Interferometry (VLBI) with Unified S-Band (USB) telemetry and control technology. The ability to acquire navigation data depends on the distribution of ground stations. It may not be possible to set up ground stations outside a country's territory in order to have good visibility from the ground. It is also costly to set up a network of ground stations to ensure that the space vehicles are always observed by ground stations. The second type employs on board navigation systems including geomagnetic, celestial, inertial and X-Ray pulsar. The geomagnetic sensor is susceptible to interference and solar activities. Inertial navigation has the characteristics of error accumulation, which make it unsuitable for long period operation. Celestial navigation on the other hand is vulnerable to interference from the sun. X-Ray pulsar-based navigation has the limitation of requiring long-period filtering. Therefore, there is a need for a better method for the positioning and navigation of space vehicles.
Global Navigation Satellite Systems (GNSS) are designed for users on or near the surface of the Earth. They have also been used for Low Earth Orbit (LEO) space vehicles. However, it is usually difficult to provide reliable Position, Navigation and Timing (PNT) services for space vehicles above 3000 km altitude. At the end of the last century, an experiment exploiting the Global Positioning System (GPS) signal at geosynchronous altitude demonstrated that it is indeed practical for routine and reliable orbit determination of GEO satellites (Kronman, Reference Kronman2000). In September 2001, GPS first activated a practical test on AMSAT-OSCAR (AMateur SATellite-Orbiting Satellites Carrying Amateur Radio) 40 spacecraft to measure L1 main lobe and side lobe signals, and optimistically demonstrated the importance of specifying performance characteristics for GNSS signals transmitted in the SSV (Moreau et al., Reference Moreau, Davis, Carpenter, Davis, Jackson and Axelrad2002). The NASA Goddard Space Flight Center (GSFC) developed the PiVoT GPS receiver to conduct an actual weak signal tracking test in High Earth Orbit (HEO) (Moreau et al., Reference Moreau, Axelrad, Garrison, Wennersten and Long2001), and thereafter utilised a high-sensitivity GPS receiver to indicate that steady state position accuracies below 10 m are achievable for GEO GPS users (Bamford et al., Reference Bamford, Naasz and Moreau2006). Recently, research by the European Space Agency (ESA) has shown that it is feasible to use GNSS for navigation up to geostationary orbits or even as far as the Moon (GPS World, 2013). However, the antennae of navigation satellites are designed to point towards the Earth. Therefore, navigation signals from one satellite can only be received within a cone shape. The implication of this is that the higher the object or vehicle height, the higher the possibility of losing GNSS signals. Thus, with the majority of GNSS signals blocked by the Earth, any space vehicle travelling above the GNSS constellations can only detect signals from the Earth's far side. ESA's GIOVE-A made use of signals emitted sideways (side lobes) from GPS antennas. It was able to fix its position, velocity and time from GPS signals despite orbiting more than 1000 km above the GPS constellation (GPS World, 2013).
The signal from the side lobe is very weak because ideally there should not be a signal outside the main signal beam cone. The signal from the main beam is also very weak when it reaches the far side of the Earth. It is necessary to understand the characteristics of these weak signals in order to assess if they can support the required navigation services. The Space Service Volume (SSV) first proposed by NASA (Miller and Moreau, Reference Miller and Moreau2012) is usually used for the characterisation. The service volume is the three-dimensional (3-D) space within which PNT services are provided. In order to distinguish conventional services on or near the surface of the Earth from the others, the Service Volume is divided into two parts. The volume of the space between the Earth surface and a height of 3,000 km is referred to as the Terrestrial Service Volume (TSV). The volume of the space between 3,000 km and 36,000 km heights is referred to as the Space Service Volume (SSV). The TSV covers most of the LEO space vehicles; while the SSV covers MEO and GEO vehicles' space height. The SSV concept has been adopted by Working Group B of the International Committee on GNSS (ICG). There are three parameters for the characterisation of navigation system performance for SSV: (1) the minimum received power level; (2) signal availability (minimum number of visible GNSS satellites) and (3) pseudorange accuracy. This paper replaces signal availability with satellite visibility to avoid misunderstanding and includes the fourth parameter, the Geometric Dilution of Precision (GDOP).
NASA has developed the main method to evaluate the GPS SSV performance in terms of the three parameters (Bauer et al., Reference Bauer, Moreau, Dahle-Melsaether, Petrofski, Stanton, Thomason, Harris, Sena and Temple2006). The method is based on a single constellation of MEO navigation satellites taking into account antenna gains and signal path loss for minimum received power assessment and grid points at 6°×6° for signal visibility assessment. This paper proposes an analytical method for carrying out the assessment for both MEO and GEO navigation satellites. The method is employed to characterise SSV for single and multiple GNSS constellations. The simulation analyses of minimum received power, satellite visibility, pseudorange accuracy and GDOP are presented respectively. A variable height vehicle for lunar exploration is also taken as an example. The results show the potential of GNSS to support the first stage of orbiting in lunar exploration.
Section 2 of this paper introduces the characterisation methodology. Section 3 provides the SSV data for BDS III and its combination with other GNSSs. Section 4 analyses GNSS service quality in a typical lunar injection mission. The paper is concluded in Section 5.
2. SSV ASSESSMENT METHODOLOGY
The four parameters used for SSV performance characterisation are closely linked to the GNSS constellations and navigation satellite design including the transmitting power and gain pattern of the antenna.
The geometry of MEO and GEO navigation satellites in the SSV are used to calculate the relevant parameters over grid points at different heights. This section derives the models for the characterisation of each parameter for the shadowed areas as show in Figures 1 and 2. A simplified schematic diagram for the main lobe and side lobe signals emitted by a single MEO navigation satellite can be seen in Figure 1, while Figure 2 depicts the diagram of beam coverage for a single GEO or IGSO (Inclined Geosynchronous Satellite Orbit) navigation satellite. In both scenarios, the cut-off angle of the main lobe and valid angle for the side lobe are important in the definition of the geometry (shape and size) of the shadowed areas.

Figure 1. SSV visibility for BDS MEO satellite.
Figure 2. SSV visibility for BDS GEO/IGSO satellite.
2.1. The Determination of Minimum Received Power
The signal power at a GNSS receiver can be expressed by the Friis free-space transmission formula (Hogg, Reference Hogg1993):
 $$P_r = P_t + G_t - L_S - L_a + G_r - L_p $$
where P t is the output power of power amplifier, G t is transmitting antenna gain, L S is the free space propagation loss, L a is atmospheric loss usually taken as 0·5 dB. Receiving antenna G r is usually taken as 0 dBic when Right-Hand Circularly Polarized (RHCP) antennas are adopted by SSV users, and L p represents the loss due to polarisation mismatch usually taken as 4 dB.
Equivalent Isotropically Radiated Power (EIRP) is considered to be the output of the power amplifier plus transmitting antenna gain. If the ambient temperature is T which is assumed to be 290 K under normal circumstances, we can get the noise power spectrum density:
 $$N_0 = 10 {\rm lg}kT = - 203 {\cdot} 98\,dBW/Hz$$
where k is the Boltzmann constant and equals 1·3806505×10−23 J/K. Based on the minimum receiving power P r, the carrier-noise ratio is:
 $$C/N_0 = P_r - N_0 - L_{\,proc} $$
The space propagation loss L S in free space is related to the signal transmission distance D.
 $$L_S = 20\log _{10} \left( {\displaystyle{{4\pi Df} \over c}} \right)$$
The minimum received power is at the maximum distance. Therefore, the maximum signal transmission distance must be determined. This requires analysis of the space geometry shown in Figure 3.
Figure 3. Diagram of space geometrical relationship.
The spherical surface of the spherical segment formed by the AB and CD planes in Figure 3 is the area where a space vehicle at GEO height can potentially receive the main lobe of navigation signals. The lower bound of valid off-nadir angle is referred to as the Earth Blocked Angle (θ). Based on the geometry shown in Figure 3, this angle for the BDS MEO scenario is:
 $$\theta _{MEO} = \arcsin \left( {\displaystyle{{r_E} \over {R_{MEO}}}} \right)$$
where r E represents the Earth radius and R MEO represents the orbit radius of MEO satellites. In the same way, the Earth blocked angle for GEO/IGSO signals is smaller:
 $$\theta _{GEO/IGSO} = \arcsin \left( {\displaystyle{{r_E} \over {R_{GEO/IGSO}}}} \right)$$
while R GEO/IGSO represents the orbit radius of GEO/IGSO satellites.
Using geometric derivation, the maximum transmission distance for signals from MEO satellites to the farthest user (worst location) in SSV is:
 $$D_{MEO}^{\max} = R_{MEO} \cos \theta _{MEO} + R_{GEO/IGSO} \cos \theta _{GEO/IGSO} $$
The maximum transmission distance for signals from GEO/IGSO satellites to the GEO height user is:
 $$D_{GEO/IGSO}^{\max} = 2R_{GEO/IGSO} \cos \theta _{GEO/IGSO} $$
These maximum transmission distances are used in Equation (4) to calculate the maximum signal loss in order to calculate the minimum received power of GNSS signals. From Equation (1), it can be seen that the transmission power (P t+G t) of a navigation satellite is one of the dominant factors of the minimum received power because the signal path loss cannot be controlled and the receiving antenna gain is limited for space vehicles.
2.2. The Determination of Satellite visibility
Satellite visibility is defined as the number of GNSS satellites in direct line-of-sight with the receiver at any given time in the SSV. The satellite visibility for main and side lobe signals is analysed separately.
As satellite visibility is an issue of geometry and statistics, the research is carried out based on grid sample points. In fact, height is the dominant variable that determines GNSS satellite visibility in the SSV (Stanton et al., Reference Stanton, Parker Temple and Edgar2006). The worst situation must be met at the furthest height, so the height of 8000 km and 36000 km are selected for MEO and GEO SSVs respectively. A grid of 5°×5° is used for demonstration purposes. A smaller grid interval can be used for a more accurate assessment.
2.3. The Determination of Pseudorange Accuracy
SSV pseudorange accuracy (P A) is determined by orbit and clock errors σ CS, propagation errors σ P as well as receiver measurement errors σ RNM, i. e.,
 $$P_A = \sqrt {\sigma _{CS}^2 + \sigma _P^2 + \sigma _{RNM}^2} $$
Where σ CS is the equivalent of the User Range Accuracy (URA) used in various standards. There is a 4-bit unsigned binary digit (0~15) in the almanac for the User Range Accuracy Index (URAI), which can be converted to the URA (GPS SPS PS, 2008). Once a GNSS receiver decodes the ephemeris, the URAI can be resolved by decoding, and then the corresponding URA is computed by the following equations:
 $$URA = \left\{\matrix{2^{URAI \over 2} + 1, 0 \les URAI \lt 6 \cr 2^{URAI - 2}, 6 \les URAI \lt 15 \cr N/A,URAI = 15} \right.$$
It must be noted that the standard deviation of propagation errors is about 5 m for ordinary terrestrial users (Kaplan and Hegarty, Reference Kaplan and Hegarty2006), then the σ P for SSV users ought to be 5 m.
In coherent mode with narrow spacing, the standard deviation of C/A-code measurement error caused by thermal noise can be expressed as follows (Van Dierendonck et al., Reference Van Dierendonck, Fenton and Ford1992):
 $$\sigma _{RNM} = \sigma _{tDLL} = \sqrt {\displaystyle{{B_L D} \over {2 {\cdot} C/N_0}}} $$
where B L represents loop noise bandwidth, and D represents 1·0 chip early-late correlator spacing.
2.4. The Determination of GDOP
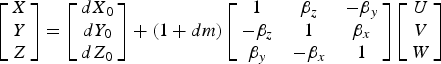
Suppose G is the geometry matrix, and the measurement matrix H=(GTG)−1. For a standalone GNSS constellation, its GDOP equals the square root of trace(H) (Kaplan and Hegarty, Reference Kaplan and Hegarty2006). It is straightforward to calculate other DOPs. For the use of multiple GNSS constellations, there are differences in the time and spatial reference systems. In order to compute the DOPs for using multiple GNSS constellations, the differences are taken into account through appropriate transformation models. In this paper, the UTC time and WGS-84 reference system are used. All the other times are converted to UTC time. All the other spatial references such as CGCS2000, GTRF (ICD-GALILEO, 2010) and PZ-90.02 (ICD-GLONASS, 2008) are transformed toWGS-84 using the Bursa-Wolf 7-parameter model.
 $$\left[ {\matrix{ X \cr Y \cr Z \cr}} \right] = \left[ {\matrix{ {dX_0} \cr {dY_0} \cr {dZ_0} \cr}} \right] + (1 + dm)\left[ {\matrix{ 1 & {\beta _z} & { - \beta _y} \cr { - \beta _z} & 1 & {\beta _x} \cr {\beta _y} & { - \beta _x} & 1 \cr}} \right]\left[ {\matrix{ U \cr V \cr W \cr}} \right]$$
where [X Y Z]T and [U V W]T are two different geocentric positions in different coordinates, [dX 0dY 0dZ 0]T and [β XβY βZ]T represent translation parameters and rotation angles between two coordinates respectively, while dm is the scale factor (Yu et al., Reference Yu, Cui, Zheng, Chen and Nie2009). The seven conversion parameters are not constant. They change slowly over time. As long as the coordinates of at least three spatial points in the two converting coordinate system are known, they can be computed directly by using Equation (12). If there are more known points in the SSV, the least-squares method can be used to determine these parameters.
3. GNSS SSV PERFORMANCE
In order to have a full understanding of the characteristics of the SSV, both single and multiple GNSS constellations should be assessed. In addition, both the main lobe signals and their combination with side lobe signals are assessed. For the single constellation case, BDS III is more representative than the others because it consists of both MEO and GEO navigation satellites. The BDS III constellation is taken as an example for single constellations for the characterisation of the SSV. The assessment of multiple constellations is based on BDS III together with GPS, GLONASS and Galileo.
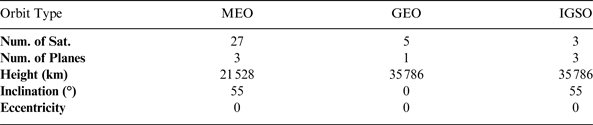
BDS III is planned to be in full operation in 2020. The BDS III constellation consists of 27 MEO satellites, five GEO satellites and three IGSO satellites. The hybrid constellation structure makes it distinctive from other GNSSs. The equatorial projections of the five GEO satellites are 58·75°E, 80°E, 110·5°E, 140°E and 160°E, while the crossing longitudes of the three IGSO satellites locate at 118°E. 24 out of 27 MEO satellites shape up into Walker 24/3/1. The other three satellites are spares with one in each orbit plane. The basic orbit parameters are shown in Table 1.
Table 1. Basic orbit parameters of BDS III constellation.
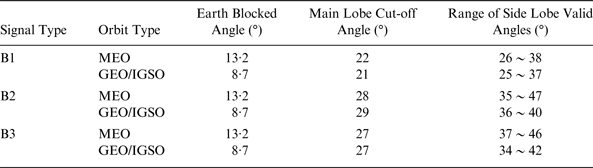
Based on the design of BDS II, we assume a similar peak gain of the BDS III transmitting antenna at 15 dBic. The transmitting gain curves over off-nadir angle are as in Figure 4. Although different in value, the variation tendency for GEO/IGSO is similar to MEO. The transmitting antenna gain pattern is a driver for the SSV characteristics. On the condition that the required transmitting antenna gain is at least −5 dBic, which is constrained by the minimum tracking sensitivity for user receivers at GEO altitude, Table 2 presents the valid angles of the main lobe and side lobe signals in the B1/B2/B3 bands. The results herein and below prove the transmitting gain of −5 dBic is reasonable:
• If the value is greater than −5 dBic, side lobe signals will be useless;
• If the value is lower than −5 dBic, the requirement for receiver sensitivity will be too stringent.
Figure 4. Assumed BDS III transmitting gain for B1/B2/B3 vs. off-nadir angle. (EB represents ‘Blocked by Earth’)
Table 2. Overall off-nadir angles of available signals.
Each SSV user is assumed to mount two 0 dBic receiving antennas on board, one faces the Earth and the other is directed towards the zenith. This will enable a user to capture all available signals from satellites both upward and downward.
3.1. Standard SSV Characteristics of BDS III
The standard SSV characterisation is to assess only the main lobe of BDS III signals. Both MEO and GEO navigation satellites are assessed.
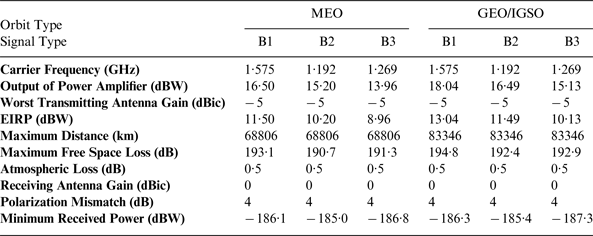
3.1.1. Minimum Received Power
Table 3 describes the minimum received power for GEO SSV users in B1/B2/B3 in detail. Referring to the receiver designs in Zarlink Semiconductor (1999), the process loss L proc in Equation (3) derives from three-stage series devices including low noise amplifiers (LNA), cables and RF front-ends. Suppose that the LNA has a noise factor (NF) of 2 dB and a gain of 26 dB, the loss in the cable is 2·5 dB, and the NF of RF front-end is 9 dB, we can calculate the LNA's noise temperature T 1 and its gain G 1, the cable's noise temperature T 2 and its gain G 2, as well as the noise temperature of RF front-end T 3. Then the total noise temperature is:
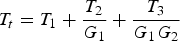 $$T_t = T_1 + \displaystyle{{T_2} \over {G_1}} + \displaystyle{{T_3} \over {G_1 G_2}} $$
And the process loss equals:
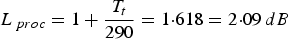 $$L_{\,proc} = 1 + \displaystyle{{T_t} \over {290}} = 1 {\cdot} 618 = 2 {\cdot} 09\,dB$$
According to Equation (3), the carrier-noise ratio is 14·59 dB-Hz for a minimum receiving power of −187·3 dB, so the sensitivity threshold of a receiver used to track such weak signals is no more than 15 dB-Hz.
Table 3. Minimum received power budget in the domain of SSV for BDS III.
3.1.2. Satellite visibility
The distribution of the number of visible satellites is shown in Figure 5 at different heights. The simulation results show that satellite visibility at the GEO height is poorer than at the MEO height. The visibility conditions for users above Central America are quite different. The users at a height of 8000 km above Central America have fewer visible satellites compared with other areas at the same height. This is because most of the signals transmitted by GEO and IGSO satellites from the other side of the Earth are blocked by the Earth. However, the number of visible satellites in this region is still enough to get position solutions. On the other hand, the users at the orbit of 36000 km height above Central America can view more GEO and IGSO satellites than other locations at the same height. This is because the signal beams from GEO and IGSO satellites overlap each other above Central America. The size of the area drops with a decrease in height.
Figure 5. (a) Satellite visibility at the height of 8000 km (b) Satellite visibility at the height of 36000 km.
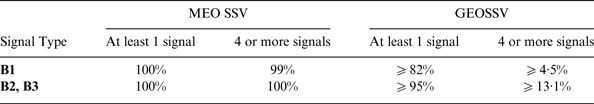
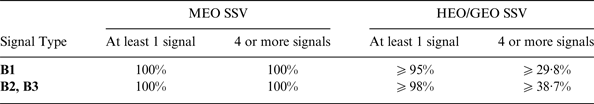
The statistics of satellite visibility are calculated for two categories: one or more visible satellites and four or more visible satellites. The former is assessed for potential precise on board timing at all times for users within the GEO SSV to reduce the need for expensive on board clocks (Bauer et al., Reference Bauer, Moreau, Dahle-Melsaether, Petrofski, Stanton, Thomason, Harris, Sena and Temple2006). The assessment can also identify potential benefits of integration with other navigation systems such as inertial. The specification of four or more visible satellites is assessed for the capability to provide GNSS navigation services for users. The assessment results for both categories are shown in Table 4.
Table 4. Visibility of BDS III main lobe.
The MEO height users have close to 100% chance to view four or more BDS III satellites at the same time. However, most of the users at GEO height cannot view enough BDS III satellites to have a position solution.
3.1.3. Pseudorange Accuracy
In general, the URAI of each BDS satellites is 0, which means the real-time URA is 2·0 m according to Equation (10) (ICD-BDS, 2012). Suppose B L=2 Hz, D=1·0chip (293 m), for a minimum received C/N0 of 14·59 dB-Hz analysed above, σ RNM=4·48 m based on Equation (11). Using Equation (9), the actual pseudorange accuracy is approximately 7·00 m.
3.1.4. GDOP
The GDOP is calculated when there are four or more visible satellites. It is a function of the user's height.
The characteristics of GDOP for BDS III main lobes are shown in Figure 6. For comparison purposes, the characteristics of GDOP enhanced by side lobes are also shown. The values of GDOP range from 1·604 to 31·520 in the SSV.
Figure 6. BDS III GDOP vs. the height.
Position error can be estimated by the Position DOP and pseudorange accuracy. Given the fact that PDOP is smaller than GDOP, the position error should be over 224 m for 7 m pseudorange accuracy when there are enough satellites in view.
3.2. Enhanced SSV Characteristics of BDS III
The characterisation for enhanced SSV refers to the assessment of both main lobe and side lobe signals for the four parameters.
3.2.1. Minimum Received Power
The transmitting power from the side lobe is weaker than that from the main lobe. However, the signal path is shorter than the main lobe signal path to reach the same height as shown in Figures 1 and 2. The lower path loss can compensate to some extent for the weak signals from side lobe. Table 3 is also applicable to the minimum power budget for the side lobe.
3.2.2. Satellite visibility
More satellites can be observed by users by adding the side lobe. Comparing Figure 7 with Figure 5, it can be seen that the number of visible satellites increases for both the MEO and GEO heights.
Figure 7. (a) Enhanced satellite visibility at the height. of 8000 km (b) Enhanced satellite visibility at the height of 36000 km.
From Figure 7, it can be seen that satellite visibility for MEO SSV is superior to that for GEO SSV. Similar to what Figure 5 shows, the same characteristics for users above Central America can be found.
Referring to BDS III satellite visibility with side lobes in Table 5, SSV performance is improved, but still insufficient for HEO/GEO SSV service most of the time. Therefore, the use of multiple GNSSs is still necessary.
Table 5. Visibility of BDS III main and side lobes.
3.2.3. Pseudorange Accuracy
Even though the signal power of the side lobe is no better than that of main lobe, their URA remains the same. Owing to greater off-nadir angles, side lobe signals are less likely to be disturbed by the ionosphere, but their receiver error may be slightly larger than that of main lobes, so the real-time pseudorange accuracy is still about 7 m.
3.2.3. GDOP
The curve of enhanced GDOP characteristics is also shown in Figure 6 for comparison. Obviously, the contribution of side lobe signals is not significant for LEO users, but their involvement would play an effective role to improve GDOP as the height rises in the SSV.
3.3. SSV Characteristics of Multiple Constellations
The pseudorange accuracy depends on the ephemeris errors, clock errors, atmospheric delay errors, multipath errors as well as the properties of GNSS receivers. The minimum received powers of different navigation systems vary. They cannot be directly influenced by modern GNSS technologies. As a consequence, the following discussions focus on the performance of satellite visibility and GDOP.
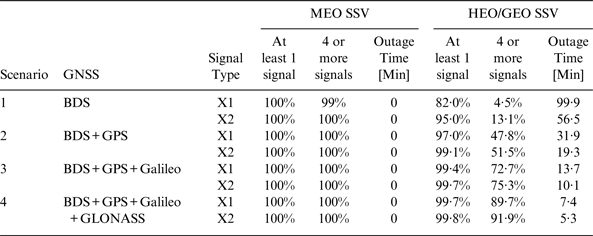
Four scenarios are sequentially built up as shown in Table 6. The performance characterisation of Scenario 1 containing the single BDS III constellation has been carried out in Section 3.2. Scenario 2 is built on dual systems, the prospective BDS III and GPS. The GPS constellation used consists of 32 MEO satellites, which have an off-nadir angle of 23·5° for L1 signals and an off-nadir angle of 26·0° for L2 and L5 signals. Under its combination with BDS III, a MATLAB experiment can be executed through an interface with the Satellite Tool Kit (STK). The statistical information is presented in Table 6. In Scenario 2, the signal type X1 represents B1 and L1, while X2 includes B2, B3, L2 and L5. The additional parameter, outage time, represents the longest intervals during which no signal is available at the minimum power level suitable for tracking.
Table 6. Satellite visibility in different scenarios.
The combination of GPS and BDS III could satisfy the requirements of MEO SSV, and play a more important role in the HEO/GEO SSV than the effect of a single system. Even without side lobe signals, its performance is much better than Scenario 1. It should be noted that HEO/GEO users benefit the most from the combination of GNSS. The average number of visible satellites is increased from 2·8 in Scenario 1 to five.
In Scenario 3, Galileo is simulated as a Walker 27/3/1 constellation lying in an orbit of 23223 km height. This is an addition to Scenario 2. The signal type X1 here involves B1, L1 and E1 which have a smaller half beam-width, while X2 includes E5a, E5b and E6 besides B2, B3, L2 and L5 which have a larger half beam-width. The statistical results are also shown in Table 6.
It can be seen that nearly 100% of HEO/GEO users can view at least one satellite and over 70% can view four or more satellites enabling a positioning solution. The average number of visible satellite is 7·3 and the outage durations are halved compared to Scenario 2.
Scenario 4 is an addition of GLONASS to Scenario 3. Based entirely on the actual state, GLONASS is designed as a Walker 24/3/2 constellation operating at 19100 km height. The statistical results for Scenario 4 are listed in Table 6.
It can be seen that nearly 100% of HEO/GEO users can view at least one satellite and over 90% can view four or more satellites enabling a positioning solution. The outage durations are halved compared to Scenario 3.
Average GDOPs of four GNSS constellations at different heights are shown in Figure 8. The comparison of performance is made between X1 signals with a smaller half beam-width and X2 signals with a large half beam-width. It can be seen from the figure that the maximum GDOP at GEO height is improved to about 20. The performance is even better when multi-frequency signals are used.
Figure 8. GDOP of using four GNSSs vs. the users' height.
Position error can be estimated by the Position DOP and pseudorange accuracy. Given that fact that PDOP is smaller than GDOP, the position error should be less than 126 m for 7 m pseudorange accuracy when there are enough satellites in view.
4. POTENTIAL APPLICATIONS WITHIN AND BEYOND SSV
Many aerospace applications will be developed aiming at formation flying, rendezvous and docking, innovative scientific exploration, and so on. The interest will be in how GNSS can support the whole process of specific space missions. As a typical application, lunar exploration turns out to be an appropriate study case.
4.1. Trajectory of a Lunar Exploration Spacecraft
In general, the injection process of lunar exploration probes can be divided into three stages:
• Stage I: Earth phasing orbit
• Stage II: Trans-Lunar orbit
• Stage III: Circumlunar orbit
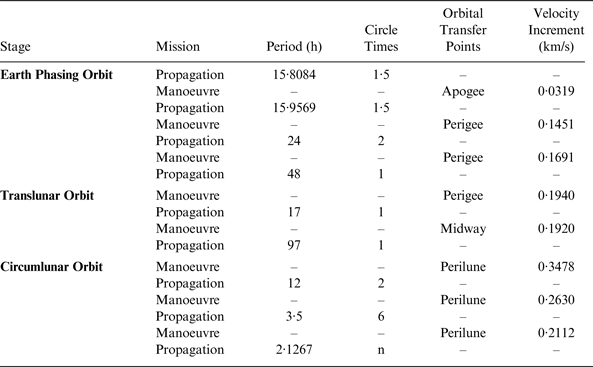
In fact, we are particularly concerned with the states of the probe after it is separated from the launch rocket at the height of 200 km. From there, it enters a Geostationary Transfer Orbit (GTO) with the perigee at 200 km and the apogee at 51000 km. The period is 15·81 hours. After orbiting a circle and a half, the probe makes an orbital manoeuvre and raises the perigee to 600 km. Consequently, its orbital period is extended to 16 hours. When arriving at the new perigee for the second time, another manoeuvre is made to change the period to 24 hours. A third manoeuvre is followed leading to a period of 48 hours. It takes about six days to complete the Earth phasing (Yang, Reference Yang2010).
At the end of Earth phasing orbit, the fourth manoeuvre enables the probe to enter translunar orbit. Through two to three midcourse correction manoeuvres, the spacecraft reaches the perilune after about 114 h along the track towards the Moon. In Circumlunar orbit, the probe needs three deceleration manoeuvres to lower its height, and finally goes into the mission orbit, which is 200 km away from the lunar surface. Finally, the standard parameters of mission orbit include: a semi-axis of 1932·850 km, an eccentricity of 0, inclination of 90°, and a period of 127·088 min (2·1267 h). Table 7 lists the mission control sequence of the entire process in detail. The total time needed is 12·61 days.
Table 7. The mission control sequence of lunar exploration probe.
However, the orbits beyond a height of 36000 km exceed the regime of SSV according to its definition. The GNSS service in space outside GEO orbit sphere is an extension of conventional SSV and can be called ‘Beyond SSV’. Although Stages II and III do not belong to SSV, they are still worth analysing for the purpose of comparing Stage I with them and evaluating the GNSS potential for deep space services.
4.2. Performance Analysis Based on Simulation
According to the mission control sequence, the graphics of the designed trajectory are shown in Figure 9. In order to research GNSS performance in mission orbit, the simulation time was extended to 15 days to cover the entire process. The four scenarios described above are set up for this test.
Figure 9. The trajectory of lunar probe.
4.2.1. Minimum Received Power
On the mission orbit, the probe is about 0·4 million kilometres away. This causes radio signal path loss of 208·43 dB in free space. Utilising the method introduced in Section 2.2, the minimum received power is −207·93 dBW. It is not possible for an on board receiver to reach this level of sensitivity with existing technology. Considering the power level in practice, only Earth phasing orbit and the earlier part of Trans-Lunar orbit can benefit from the GNSS Service in the SSV.
4.2.2. Satellite visibility
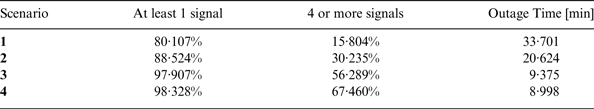
The variation of visible BDS III satellites number for the lunar probe is shown in Figure 10(a) for different stages. Based only on BDS III, the number of visible satellites is zero when the probe reaches the apogee in Stage I, and the satellite visibility is inadequate especially for Stage II and III because the visibility becomes poorer with the increase in height. Figure 10(b) shows the variation of visible BDS and GPS satellites. It is clear that visibility is better than with BDS alone. In the case of the visibility near the apogee in Stage I, signal outages have reduced significantly. Figures 10(c) and 10(d) show the visibility of Scenarios 3 and 4. It can be seen that the visibility improves with the addition of another constellation. There is almost no signal outage when the probe moves around the apogee in the Earth phasing orbit with all four constellations. The comparisons of statistical results are shown in Table 8 and also support this conclusion.
Figure 10. (a) Number of visible satellites in Scenario 1 (one constellation) (b) Number of visible satellites in Scenario 2 (two constellations) (c) Number of visible satellites in Scenario 3 (three constellations) (d) Number of visible satellites in Scenario 4 (four constellations).
Table 8. Satellite visibility performance during lunar exploration mission.
4.2.3. Pseudorange Accuracy
If multiple constellations are used for navigation, the pseudorange accuracy depends on the worst URA of all the involved GNSSs. In view of propagation errors and receiver noise, the values vary with operating conditions. In addition, it is highly recommended that all GNSS service providers carry out space experiments corresponding to AMSAT-OSCAR 40 (Moreau et al., Reference Moreau, Davis, Carpenter, Davis, Jackson and Axelrad2002) to test the actual performance of pseudorange measurement.
4.2.4. GDOP
By processing sample points for Scenario 4, Figure 11 demonstrates the average GDOP at different heights of the probe when there are enough visible satellites for positioning. Its value increases with the change of height. The value of GDOP is just over 1800 at 400,000 km.
Figure 11. Average GDOP vs. the height of probe.
Position error can be estimated by the Position DOP and pseudorange accuracy. However, the DOPs are not always available, resulting in non-continuous navigation solutions. In addition, reliable reception of navigation signals is still one of the biggest challenges. If navigation signals can be received by an on board receiver, GNSS combined with force models, multiple GNSSs and their integration with other sensors may be able to support the entire lunar operation. The foreseen applications of GNSSs are at the volume covering Earth phasing orbiting and the earlier part of translunar orbiting, and the phase covering Earth entry when the probe is returning to the Earth.
5. CONCLUSIONS
This paper adopts the basic SSV concept and extends the parameters to include GDOP enabling the position errors to be estimated. An analytical methodology is proposed to characterise the minimum received power for worst location. A grid based assessment method for satellite visibility and GDOP is proposed based on grid points at different height layers.
BDS III is taken as an example for single constellation characterisation with both main lobe and side lobe signals. The BDS III dual frequency main lobe signals or BDS III single frequency main lobe signals enhanced by side lobe signals can provide 100% availability of potential navigation services (more than four visible satellites) for MEO space vehicles. With all current constellations in full operational capability, about 92% availability of potential navigation services can be provided. The methods proposed in the paper are transferable for MEO navigation constellations together with geostationary navigation satellites in Satellite Based Augmentation Systems (SBAS).
The characterisation is useful in understanding the potential of GNSS signals in the SSV and beyond. However, in order to fully characterise the navigation performance, future work will include the assessment of the positioning accuracy, continuity, integrity and availability in the space service volume.
For a typical lunar exploration mission traversing the SSV and beyond SSV, multiple constellations can potentially support the first stage of orbiting towards the Moon. The characteristics of SSV are promising for future space explorations. There will be considerable challenges in the exploitation of GNSS for space users including mitigation of errors originated from space environments and special features related to space vehicle dynamics which may affect GNSS signal acquisition, tracking and re-acquisition. In addition, it is recommended that high-sensitivity all-constellation GNSS receivers be developed enabling the reception of the minimum power of GNSS signals at the intended height of operation.
ACKNOWLEDGEMENTS
This work was carried out with sponsorship from the Chinese National High Technology Research and Development Program (863) under the contracts 2011AA120503 and the National Natural Science Foundation of China (NSFC: 61328301). The authors would also like to thank China State Administration of Foreign Experts Affairs for supporting this collaborative research through its High-end Foreign Experts Recruitment Program.