


1. Introduction
The marine environment is known to be harsh and variable, characterised by visibility issues like the sun's glare on the surface of the sea, rapid changes in light between indoor/outdoor and night and day conditions, waves that obstruct the horizon and floating obstacles, and atmospheric phenomena such as fog, rain, snow, etc. Another aspect which adds complexity to offshore navigation is the lack of landmarks; the seafarer has no visual reference, it is like trying to move in a desert. Historically, marine navigation was supported by instruments like the compass, the sextant and the log, and infrastructure like lighthouses and radio beacons. These tools evolved over the centuries implementing radar, electronic compasses, GPS systems and digital marine charts. In order to continue this constant and inevitable evolution, the next step in the evolutionary chain is the use of augmented reality (AR) as an aid system for maritime navigation. This is part of a larger study that aims to design a specific AR solution for nautical applications.
As sailors, the authors strongly believe in this AR evolution for a fundamental reason – to improve safety and reduce stress on board. Nautical navigation is a complex and very strenuous activity from the point of view of physical and psychological stress: continuously needing to deal with a powerful and hostile natural environment, the awareness of human fragility in relation to nature, having to steer a boat, which in the case of the seafarer is very demanding, coexistence with the other crew members in reduced and almost always common spaces, dealing with guard shifts that do not always coincide with natural rhythms and many other factors. The authors believe that the use of AR in the nautical field can improve, firstly, safety but also life on board by simplifying navigation and monitoring of the marine environment in which the boats operate in accordance with Grabowski (Reference Grabowski2015).
The density of maritime traffic, the increasing number of UFOs (unidentified floating objects) caused by waste and ice floes present at ever lower latitudes, have increased the risks of navigation, leading companies to equip ships with a greater number of sensors and instrumentation. This has increased the amount of information available and the associated information display (Figure 1).

Figure 1. Bridge on a cruise ship, the cockpit area with the control monitors
In this scenario, even the most trivial operations can become complex. This increases possible distractions and can increase lack of concentration. AR can be a great help to humans if we understand it as that medium which, by infreasing perception of the marine navigation environment, makes it a little less hostile thanks to the use of visual information that can become an integral part of the environment. We can imagine the visualisation of the route on the water, the identification of obstacles difficult to perceive or the display of information on the sea and wind directly where the phenomenon is taking place. Compared with sailing (Laera et al., Reference Laera, Foglia, Evangelista, Boccaccio, Gattullo, Manghisi, Gabbard, Uva and Fiorentino2020), the visible sea surface is larger because the point of optical vision in the maritime field is also much higher than a common sailboat (20 m compared with 3–4 m above sea level); this is an advantage for the use of maritime AR systems, in fact this allows the user to ‘paint’ navigation information (e.g., route, obstacles, information) directly on to the sea surface.
The use of AR on board will be essential to reduce the cognitive ergonomic load of human operators and increase safety. However, there is currently a trends for the reduction of on-board personnel made possible with the help of electronics, and progress towards remote and later autonomous driving systems (Rolls-Royce, 2016). In this context, this paper discusses AR as a maritime application in industry.
This paper presents a systematic review of the AR maritime solutions for navigation. The paper aims to create a state of the art of the solutions adopted so far in this field to produce a sample of solutions and evaluate trends to understand the future developments of AR in the maritime field. This systematic review, together with a previous specific survey on sailing, could provide a complete view of the studies and research on the use of AR in nautical navigation, with visible differences and trends in the maritime field and for smaller boats.
2. Systematic review
Reviewing the various AR solutions available, the authors have analysed the technology of the AR devices used in the graphic interfaces, classifying them into monoscopic and stereoscopic devices and cataloguing the type of device used; this is to identify technological trends to create a mapping of the most suitable solutions for the representation of information in specific AR maritime solutions for the marine field defined in Appendix A. The identification of AR solutions was conducted on a selection of publications, selected with the systematic review method applied by Gattullo et al. (Reference Gattullo2020) in an investigation on AR technologies conducted on industrial patents. The authors decided to use this approach because it is suitable for this type of investigation regarding the theme of AR devices, in order to give a stronger scientific validation to the work. The sensors and how data are processed is not an objective of this study.
3. Methodology
The approach employed is similar to that of Evangelista et al. (Reference Evangelista2020) and Booth et al. (Reference Booth, Sutton and Papaioannou2016). The research was carried out using Scopus, WOS and IEEE Xplore for scientific literature on 30 April 2020. The search string used was: ({Augmented Reality} OR {Mixed Reality}) AND (‘maritime’ OR ‘marine’ OR ‘nautical’ OR ‘ship’ OR ‘vessel’ OR ‘naval’) NOT (‘blood’ OR ‘vascular’ OR ‘surgery’ OR {industry 4⋅0} OR ‘maintenance’ OR ‘medicine’ OR ‘medical’ OR ‘shipbuilding’ OR ‘underwater’ OR ‘robot’) in the title, abstract and keywords. The search found 180 papers in Scopus, 121 in WOS and 122 in IEEE Xplore and these were merged into 339 unique papers.
Of these, 62 papers not related to the AR domain were discarded. After this preliminary selection, an additional 219 papers were discarded for various topical reasons including: off-topic (165), learning, training, and education (22), autonomous vehicles and underwater operations (14), no maritime navigation (11), other marine applications (7). Out of the remaining 58 papers, another 28 proceedings documents and 12 papers were discarded because they did not show proposals for graphical AR application solutions in the maritime field. The authors did not have access to seven papers; therefore, 11 scientific papers were available to assess for the review.
For each solution, the methodology in List 1 was followed. Firstly, the publication type, citations (for scientific papers only) and year of publication were investigated because the authors wanted to study the relative trends and the impact of this research field in the scientific community.
With regard to the AR system, the AR display type was distinguished and if it is stereo or monoscopic, and thus its ability to render information elements that leverage stereoscopic depth cues was assessed. AR displays can be head-mounted (HMD) – using optical see-through (HMD-O) or video pass-through (HMD-V) combiners –, or opaque handheld AR (mobile AR or MAR) using video see-through (e.g., smartphones, tablets). In this work, head-up displays (HUD) are considered as HMD since the display occupies a small portion of the user's field of optical vision, even though these HUDs often use a miniature opaque display. In this field, HUDs are advertised as AR in some commercial solutions though the information is not strictly overlaid onto the real world. These HUDs are included in the assessment since the commercial solution is attempting to leverage the head-up benefits of AR and the information presentation methods may be of value to the analysis.
The frame of reference of each of the AR solutions was evaluated considering each of the visual assets visualised and an extended classification provided by Gabbard et al. (Reference Gabbard, Fitch and Kim2014) was used, adding ‘body-relative’. Each visual asset was thus distinguished as: world relative (WR) – co-located in the world; body relative (BR) – fixed to the user's body; screen relative (SR) – fixed onto the screen; or hybrid (H) – for solutions with a non-homogeneous frame of reference.
The spatiality (three- or two-dimensional: 3D or 2D) of the visual assets was also classified. Planar areas, lines or points when presented in WR and BR were considered as 3D assets since they can be placed anywhere in the real world and are perceived as elements in the 3D scene via stereo vision. Alternatively, 2D assets are positioned on a single augmentation plane, such as seen in the traditional vehicle and aeronautic HUDs. The 2D WR solutions provide a simulated augmentation (i.e., a 2D label following a moving target). The option of 2D SR is not a real augmentation according to the scientific definition (e.g., an analogic time display in a corner of the screen) (Figure 2).

Figure 2. The spatiality of AR assets: 3D world relative (WR), 2D world relative (WR), 2D screen relative (SR)
The spatiality and the frame of reference of the AR solutions was evaluated considering each of the graphical assets presented. When they present non-homogeneous spatiality or frame of reference, they are called hybrid (H). For each solution identified in the review, the maximum simultaneous number of information elements, the name and the spatiality, and the frame of reference of the related assets was considered.
At a development level, it was considered if and how each of the AR maritime solutions presents a scientific evaluation: AR tested (ART), virtual reality tested (VRT), not tested (NT) and not specified (NS). In scientific papers, the presence of user studies was checked, while for commercial products, publicly available reports and/or whitepapers were searched for.
Finally, each solution was evaluated according to its technology readiness levels (TRLs) according to the definition of C(2014)499 (2014), ranging from 1 to 9 and defined in Appendix B. The evaluation was performed by a panel of five marine experts.
List 1. Classification of the solutions
Publication
• Year of publication
AR Solution
– Visualisation device (mono, stereo)
– Device type (HMD-O, HMD-V, MAR, HUD)
– Frame of reference: world relative (WR), body relative (BR), screen relative (SR), hybrid (H)
– Spatiality: 3D, 2D, hybrid (H)
Displayed information elements
– Number of information elements
– Name of each information element
– Frame of reference for the visual asset (WR, BR, SR, H)
– Spatiality of each visual asset (3D, 2D)
Development level
– Evaluation via user studies (ART, VRT, NT, NS)
– Technological readiness level TRL (1–9).
The solutions for each category are presented below in chronological order of publication.
4. Scientific literature
Hong et al. (Reference Hong, Andrew and Kenny2015) used a monoscopic MAR (monitor AR) for operators of unmanned maritime vessels in which information from other sources such as maps and radar can be co-located on the same screen using AR. This is a hybrid solution that combines 3D WR graphics with 2D non-contextual SR data (Figure 3). The peculiarity of this solution is to display and increase both the front scenario – looking towards the bow, and the rear one – looking towards the stern. This AR maritime solution has not been developed for any AR monitor system in particular.

Figure 3. Hong et al. (2015): hybrid AR maritime solution
There are three information elements represented simultaneously in this solution: compass, heading and obstacles. The compass has a double representation: the first (A1) is represented as an arch drawn on the sea using two colours to indicate the port side and the starboard side, the second (A2) is a 2D SR with a scale with numerical values in sexagesimal degrees; in the centre, the heading (B) is represented. The obstacles (C) are 3D WR coloured elements, which are shown in the heading dial on which it is possible to read the detection of the obstacle in relation to the ship.
To evaluate this AR maritime solution, an experiment was conducted to assess the situational awareness and workload of the operator with 12 participants aged between 26 and 40 years who took part in the experiment. All the participants had completed the Powered Pleasure Craft Driving Licence (PPCDL) Course and knew the maritime port rules and regulations. The experiments were conducted in a laboratory-based environment in which the participants were required to review the video footage of the AR maritime solution recorded using a prototype boat navigating. For this reason, the readiness level was evaluated as 4.
Moulis and De Larminat (Reference Moulis and De Larminat2015) developed a 360° AR maritime solution for MAR as an intermediate prototype for a future solution using Vuzix AR glasses. This solution also displays both the front and rear scenarios, as in Hong et al. (Reference Hong, Andrew and Kenny2015). The remote or distant users and ships are protected against terrorist attack via this system (project VISIPROT®: VISual Information system for PROTection). Hong et al. (2015) proposed a hybrid AR maritime solution combining 3D WR graphics with 2D non-contextual SR data (Figure 4).

Figure 4. Moulis and De Larminat (2015): early case study 360° AR maritime solution on MAR
Three information elements are represented simultaneously: route (A), obstacles (B) and compass (C). This 360° solution is simple and presents the route and obstacles represented in the real marine environment (WR), and the compass represented at the bottom of the visual area, in SR referencing. The early prototype allowed three French navy mariners to operate in defence scenarios against a speed boat during an experiment. The experiment is not specified and for this reason, the readiness level is set to 2.
Ostendorp et al. (Reference Ostendorp, Lenk and Lüdtke2015) used AR HMD optical see-through to address two critical maritime scenarios: navigation in restricted areas like rivers and the mooring of large ships. The first is a hybrid solution that combines 3D WR graphics with 2D non-contextual SR data. Five information elements are represented simultaneously in this AR maritime solution: heading, boat speed, waypoint, no-go zone, tide direction.
In this solution, the sea area is divided into three different areas indicated by three different colours. These three areas are defined by an information element that augments reality to give an indication of the safety of the navigable areas: the green area represents a safe navigation area, the yellow area warns that the user's vessel is entering dangerous waters, the red area represents waters where it is not possible to navigate (Figure 5). Sea current (A) and speed restrictions (B) are also represented respectively by a planar arrow on the surface and a virtual speed limit sign. In the lower part of the solution, a 2D non-contextual graphic represents additional alphanumeric data (C1) and indicators (C2).

Figure 5. Ostendorp et al. (2015) use AR for adding coloured areas, current direction arrow and virtual signs
The AR maritime solution analysed has been evaluated using a scenario-based questionnaire, thus the TRL is set to 2.
Lee et al. (Reference Lee2016) present an AR maritime solution on a monoscopic monitor video see-through displaying geo-located AIS (automatic identification system) and GPS data. This solution has not been developed for any AR monitor system in particular. They use a hybrid AR maritime solution with 2D WR contextual graphics, and SR and 2D non-contextual graphics (Figure 6).

Figure 6. Lee et al. (2016): AR maritime solution proposal
Two information elements are represented in addition to AIS and GPS: obstacles (A), displayed as a yellow rectangle with the AIS information text inside in world relative referencing, roll and pitch (B) boat's angle as SR text.
Lee et al. distributed questionnaires to evaluate their AR maritime solution, and bridge sailors were interviewed to confirm the prototype results. For this reason, the TRL was set to 2.
Oh et al. (Reference Oh, Park and Kwon2016) presented an AR maritime solution using a large screen on the dashboard as well as a monoscopic video see-through AR cockpit. They proposed a hybrid solution that combines a 3D and 2D AR WR representation together with SR non-contextual 2D graphics. The interface layout is divided into two areas: the first main area with 3D AR WR representation of the route (A in Figure 7) and 2D AR WR 2D labels in the central vision area dedicated to the navigation showing compass, route, radar and AIS information for obstacle avoidance according to the IHO S-57 standard for Electronic Navigational Chart (Figure 7). The second area is the upper part of the interface with 2D non-contextual graphics, static and non-immersive (Figure 8), with boat-related parameters like speed and engine RPM.

Figure 7. Oh et al. (2016): the lower area of video see-through AR maritime solution shows WR 2D marine traffic information

Figure 8. Oh et al. (2016): the upper area is dedicated to 2D screen fixed information elements display
The 12 information elements are: compass, obstacle, heading, route, boat speed, latitude and longitude, waypoint, distance to waypoint, traffic information, course over ground, rudder angle and depth.
The prototype solution was initially tested in virtual reality (VR) on a simulator and was then tested on a real ship in the open sea. For this study with final users, the TRL is evaluated as 7.
Nam et al. (Reference Nam, Lee and Lee2017) proposed an AR maritime solution using a monoscopic AR monitor. The solution is a combination of the 3D information elements in WR view, and the 2D non-contextual data in SR view (Figure 9).
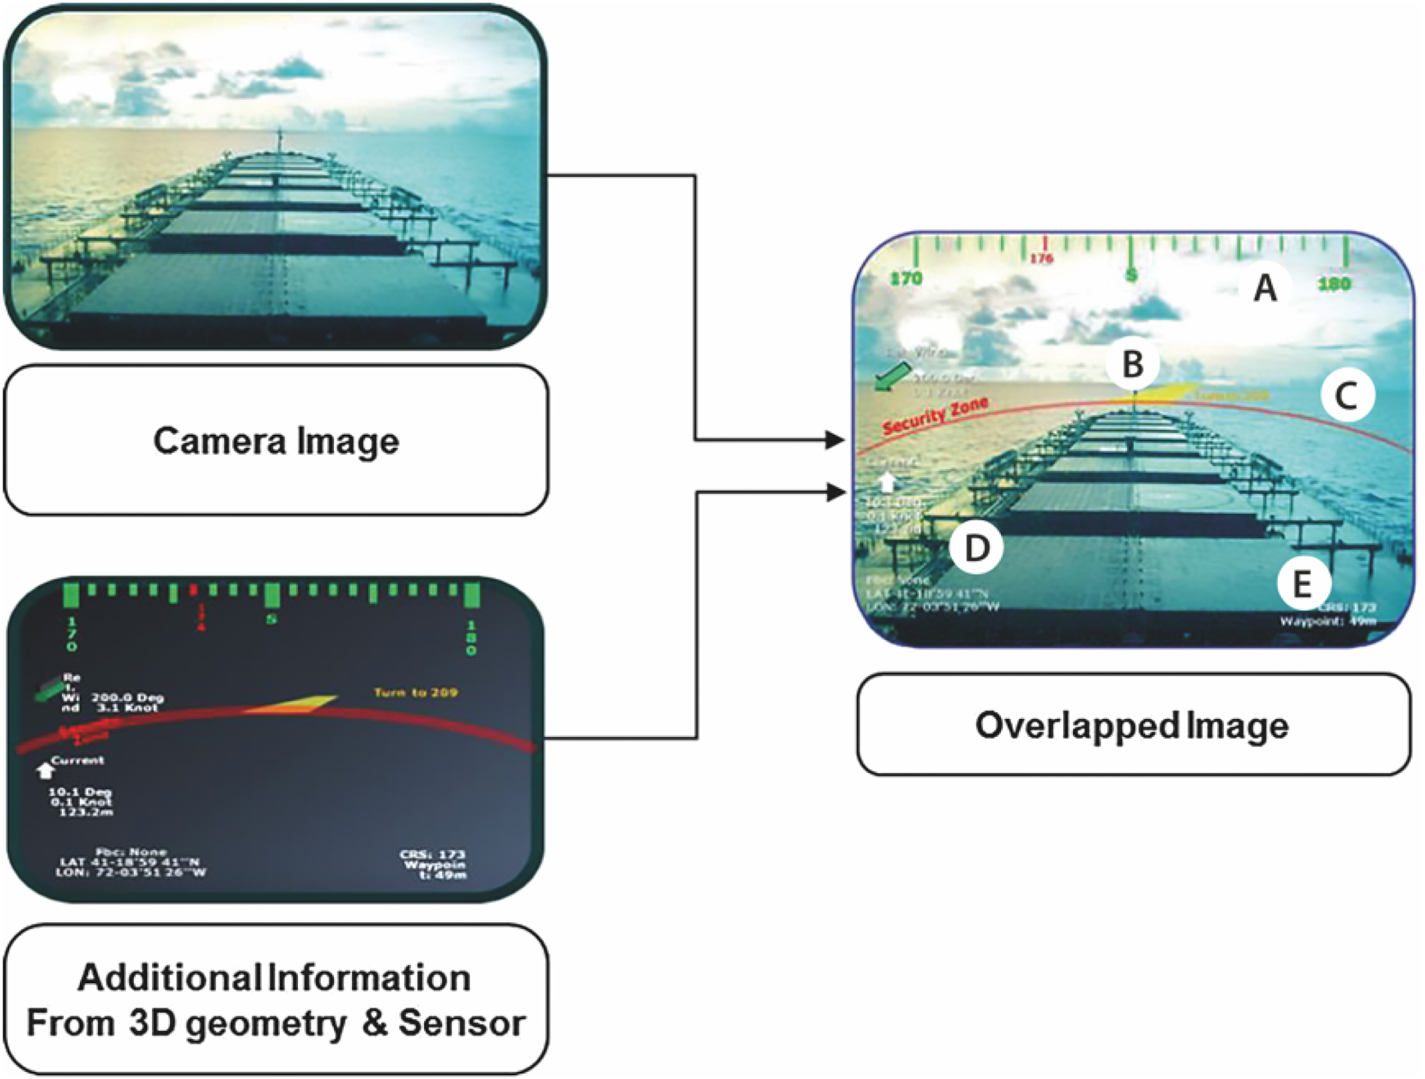
Figure 9. Nam et al. (2017): video composition of maritime information elements using video see-through HUD AR
Seven information elements are represented simultaneously in this AR maritime solution: heading, compass, distance to waypoint, route, latitude and longitude, wind direction and tide direction. In this case, the compass (A) is shown in green as a 3D object, at the top of the screen (Figure 9). It represents the route (B) to follow with a yellow line and the course angle as a number in degrees. The ship is inscribed in a circumference (C) that delimits the safety zone, represented on the sea with a red line. In the left part of the screen, there is the numerical data (D) of angle and intensity indicating the direction of the wind and current in 2D non-contextual graphics. Alphanumeric data, such as latitude and longitude and distance from the waypoint, are shown in white in the lower area of the screen (E).
This AR maritime solution has not been developed for any AR monitor system in particular, no tests have been carried out, for this reason, the readiness level is set to 2.
Okazaki et al. (Reference Okazaki, Takaseki, Shoji and Matsubara2017) developed a monoscopic sea route AR maritime solution, which displays the shipping route on the surface of the sea, GPS based. It is a full WR solution with 3D information element (Figure 10).

Figure 10. Okazaki et al. (2017): AR maritime solution during the sea route experiment
The AR image is made overlapping the real environment image from the bridge taken by web camera and 3D object of sea route using an AR toolkit and displayed on an AR monitor. There are two information elements represented simultaneously in this solution: route and tack.
The solution presents three groups of AR information elements. The sea route (A) is indicated with a line between the buoys to equip the navigator with the right information of sea route to prevent getting out of the path; the pole indicates the tack point (B) as a graphical element. The information elements change colour according to the distance from the ship to give the navigator a more precise sense of distance by clarifying the position error calculation system.
This AR maritime solution was tested in a sea route experiment and operational environment in the Uraga Channel and Nakanose Traffic Route and has not been developed for any AR monitor system in particular, for this reason the readiness level is set to 7.
Bergström et al. (Reference Bergström, Hirdaris, Valdez Banda, Kujala, Thomas, Choy, Nordby, Li, Ringsberg, Lundh, Stefenson, Kujala and Lu2018) proposed applying AR technology to improve ship bridge systems operating in Arctic conditions. Only an AR maritime solution hypothesis has been proposed to show the potential of AR technology applied to the maritime domain. The type of AR device to be used has not been specified, and this solution has not been developed for any special device. The information elements are represented in 2D contextual graphics in a full WR solution (Figure 11). The only information elements represented are obstacles (A), specifically ice, as an area identified on the sea surface and a label connected to the obstacle showing ice data such as thickness, ice age and recommended speed. No user tests are reported, and the solution is a concept, for these reasons the TRL is evaluated as 2.

Figure 11. The Bergström et al. (2018) hypothesis of AR maritime solution for improved situation awareness in Arctic ship operations. ®Amalie Albert
Frydenberg et al. (Reference Frydenberg, Nordby and Eikenes2018) proposed a solution for maritime navigation using stereo HMD, but no specific HMD is mentioned. They use a hybrid solution with an immersive 3D approach using co-located WR graphics on the sea, and a label with 2D SR contextual graphics for navigation and engine data and 2D non-contextual information (Figure 12).

Figure 12. Frydenberg et al. (2018): 3D assets and world stabilised frame of reference: heading is a dotted line; true course is a continuous line and the ‘no-go zones’ are red areas
There are six information elements represented in total, from two to a maximum of six depending on the navigation situation: heading, compass, boat speed, route, no-go zone and engine data.
All the information elements are virtually located on the sea surface: the heading (A) as a dotted line, true course (B) as a continuous line and the ‘no-go zones’ (C) as red areas, (Figure 12). Compass degrees (D) are always represented on the horizon line.
This AR maritime solution was specifically designed to improve safety in Arctic conditions, characterised by low contrast and visibility. For this reason, AR was considered as an advantage and the main focus was dedicated to studying and optimising the readability of the information elements in different environment and light conditions.
No user tests are reported, therefore the TRL is evaluated as 2.
Jeon et al. (Reference Jeon, Park and Woo2019), in collaboration with Hyundai, developed the advanced navigation assist system (Hi-NAS) vision module that consists of an object detection part and a visualisation part to augment the navigation information on board through an MAR. In the paper, a hybrid solution with WR 2D contextual text is presented, to identify the obstacle (A), and SR texts and graphics (B) for navigation, engine and environment data in 2D non-contextual representation (Figure 13).

Figure 13. Jeon et al. (2019): AR maritime solution based on HHI Navigation Assistant System (Hi-NAS)
There are 12 information elements represented simultaneously in this solution: compass, course over ground, boat speed, wind direction and speed, tide direction and speed, traffic information, obstacle, engine data, rudder angle and latitude and longitude.
The object detection part of the vision module consists of a camera module and a deep-learning computing device. The position, speed, heading and course of the ship are collected by using the speed log, anemometer and GPS. For the collection of information on the target ship and topography, AIS (Automatic Identification System), ARPA (Automatic Radar Plotting Aid) and ENC (Electronic Navigational Chart) are used. The visualisation module provides the user with the calculated collision risk information on the images, using AR technology, for both their own ship and target ships.
No user tests are reported and, for this reason the TRL is evaluated as 2.
Takenaka et al. (Reference Takenaka, Nishizaki and Okazaki2019) proposed a monoscopic AR maritime solution, the obstacle zone by target (OZT) system, using a MAR. The solution is fully 3D in a WR system and displays the position in which a ship is at risk of colliding with another ship (Figure 14). Two information elements are represented simultaneously in this solution: compass and obstacle.

Figure 14. Takenaka et al. (2019): OTZ system for AR maritime navigation
This study develops a manoeuvring support solution that displays the OZT on the surface of the sea. The AR maritime solution consists of a 3D information element of the OZT and a scene from the bridge taken by a web camera using an AR toolkit and AIS system. The solution presents a large 3D compass on the cockpit area and a 3D element with an arrow on the sea surface to augment the obstacle ship's silhouette.
The solution was tested in VR on a ship manoeuvring simulator to test the interface and to define which colour is best for 3D obstacle information elements. The solution has not been developed for any AR monitor system in particular, no tests have been carried out. For this reason, the TRL is set to 4.
5. Results and discussion
Most AR solutions are monoscopic (7 out of 11) and only three devices are stereoscopic (Figure 15). One of these is not specified because it is a concept. It is important to note that all AR monoscopic solutions use a monitor and all the stereoscopic solutions use HMD-O. This result is the opposite of what happens in the world of sailing, where HMD-Os are the most common systems. The result depends on the differences between maritime navigation and sailing: in fact, maritime navigation takes place in a specifically designated point for the control of operations which justifies the use of MAR systems, while in sailing the user physically passes from below deck to deck navigation and this dynamism requires the use of HMD-O systems (Laera et al., Reference Laera, Foglia, Evangelista, Boccaccio, Gattullo, Manghisi, Gabbard, Uva and Fiorentino2020). We can also observe that, while scientific literature started to investigate full stereoscopic AR solutions by 2014, the industry had to adapt to the available field-ready technology.

Figure 15. AR device type chart: stereo HMD-O is preferred
A greater presence of stereo solutions might be expected in the development of AR maritime solutions. However, the predominance of monoscopic solutions can be explained by the current structure and organisation of ship control boards. Indeed, the command areas are located in closed spaces of the ship, protected from external light and bad weather, and the position of the crew is quite static and does not need to be moved from the point of optical vision. Monoscopic displays can be sufficient in the open sea, where distances of objects are generally in ‘vista space’ (>70 m) and binocular disparity cues are less important (Cutting and Vishton, Reference Cutting, Vishton, Epstein and Rogers1995). However, maritime navigation does include situations where targets are under 70 m, for example, docking and the mooring operations. The monoscopic solution of the AR monitors integrates well with the current control panels and may be more familiar to the crew members responsible for monitoring and reading the parameters and the navigation area.
Another important aspect in the AR maritime solutions is the hybrid solution (Hybrid WR + SR) which is the most used frame of reference (8), followed by WR (3) and there is no SR solution (Figure 16). This result is in line with the predominant use of MAR on board (Figure 14); in fact, the use of hybrid solutions almost fully coincides with the use of MAR devices. This is an interesting result because a larger number of WR solutions was expected compared with non-registered AR solutions commonly rendered as SR.

Figure 16. The frame of reference of the solution: the hybrid solution, world relative + screen relative, is the most common solution utilised
The hybrid results may be explained simply by the difficulty of transforming all information elements in 3D while maintaining legacy systems and ease of use. It is interesting to note that there are no SR AR maritime solutions. This data is particularly significant and indicative of a new approach linked to the AR technology used, which radically deviates from the current graphic solutions present on traditional monitors for the control of navigation phases
Another important aspect is the absence of body-referenced systems. This is because the control and command operations carried out on board are related to the ship, from monitoring the route to speed, from the presence of obstacles to checking the engine parameters. The ship is the subject of every action and therefore the referenced system refers to the ship. Compared with sailing navigation, the ship's bridge is designed for a person who is standing or seated in a protected fixed position, and most of the data concerns distant and quasi-static targets. Unlike the dynamism of the crew members on a sailing vessel, the position of the crew members during maritime navigation is quite static, as the decisions and monitoring of navigation activities take place on the bridge. This aspect also affects the absence of a body-referenced system that is better suited to more dynamic navigation situations in which a human body is at the centre of the action. Regarding the spatiality of the AR solutions, Figure 17 shows that most of the AR maritime solutions use hybrid spatiality assets (8) followed by full 3D spatiality (2). Just one solution uses a full 2D spatiality assets in a WR view.

Figure 17. The spatiality of the AR solutions: most of the AR maritime solutions use pure 2D assets, mostly WR
The number of information elements displayed simultaneously ranges from one to 12 with a median of 5⋅1 (Figure 18). Five simultaneous information elements on the AR screen can be considered an empiric optimal among the number of information elements displayed, with regard to the user's cognitive load and readability according to the resolution of the display. Perhaps not coincidentally, it aligns with Miller's magic number of 7 ± 2 (Miller, Reference Miller1956).

Figure 18. Frequency of the simultaneously displayed information elements (red line is median of 5.0)
This study aimed to investigate the most common information elements in the different solutions by using their frequencies (see Figure 19). The most visualised information elements are: compass (7) and obstacle (7), followed by heading (5), route (5) and boat speed (4). Tide direction and latitude and longitude both appeared in three solutions (Figure 19). This result is predictable because the traditional navigation instruments, like the magnetic compass and the ship's log, continue to be used today precisely because of their fundamental roles. Besides, the representation of obstacles is achieved in accordance with safety and obstacle avoidance criteria.

Figure 19. Frequency of the information elements found in the AR maritime solution, and their spatiality and frame of reference
The other information elements are: wind direction, waypoint, distance to waypoint, traffic information, no-go zone, course over ground, engine data and rudder angle (2). These information elements are very important for monitoring and calculating the route, for the main checks of the state of the vessel and the control of the navigation area.
In Figure 19 it can also be seen how information elements are displayed across spatiality and frame of reference. From the analysis of the representation of the information elements, we notice there is a difference in the representation, in fact, there is no univocal representative choice for each information element. This tells us that there is no representative standard of navigation information elements related to AR technology and that the issue has yet to be investigated and tested on end-users to define representative guidelines. This mix of representations can be attributed in part to the habit of displaying data on classic monitors and to delay in the detachment from this type of representation. It is more likely, however, due to the awareness that there is no single way of representing information and that some data must be represented in SR view, while other data is WR only. A proof of this is given in Figure 19, where we note that the choice of how to represent the data is quite well aligned and we find some types of data represented only in WR (obstacle, route, waypoint, no-go zone), while numeric data are represented only in SR (boat speed, latitude and longitude, course over ground, engine data, rudder angle).
This study also aims to evaluate the scientific grounds of the interfaces developed in the AR maritime solutions. Figure 20 shows that only two solutions have been tested in AR, and none were carried out in the sea environment. We can explain this result by the difficulty of performing user tests in real marine conditions. Only two solutions claim to have evaluated their interface (Oh et al., Reference Oh, Park and Kwon2016; Okazaki et al., Reference Okazaki, Takaseki, Shoji and Matsubara2017) using AR simulation, and two other solutions (Hong et al., Reference Hong, Andrew and Kenny2015;Takenaka et al., Reference Takenaka, Nishizaki and Okazaki2019) using VR simulation. Two further solutions used a questionnaire test their interface. This method is not suitable for a test on a graphical interface, however, it is useful for a preliminary check of the solution. Almost half, 46% (37% + 9%), of the selected solutions lack any user validation (4) or do not specify it (1). The graph of technological readiness levels (Figure 21) shows how most solutions (7) are rated as 2. This result is in line with what is shown in Figure 20, as only four solutions have actually been tested. In these four solutions, two AR tested and two VR tested, TRL values 7 and 4, respectively, were assigned.

Figure 20. Evaluation of the solutions: only two solutions present user evaluation in AR

Figure 21. Technological readiness levels: most solutions are rated 2
6. Conclusions
The paper presents a study on the use of AR applications in the maritime field based on the analysis of 11 scientific papers that propose or present specific solutions for the sector. For each solution, the type of AR solution, the frame of reference, the spatiality, the frequency of the displayed information elements, the name of the information elements, the evaluation system and the technological readiness level were analysed.
As expected, compass and obstacle are very commonly visualised (7), followed by heading (6) and route (5). Note that in AR systems the compass retains the traditional representation of the physical compass object, the heading retains the numerical representation of the data as in current non-AR instruments, while only the route has a representation congruent with the AR technology; it is represented as a 3D WR road on the sea in all the systems analysed.
Most solutions (8) use a hybrid integrating 3D information with 2D information, in both WR and SR views.
The number of information elements represented was an average of 5⋅1, theoretically in line with the amount of information allowed to maintain a regular cognitive load, except for two solutions which present a significant number of information elements (12). However, the number of information elements used refer to the hypotheses of the solutions. Therefore, these hypotheses of solutions need to be verified by tests since only two of the solutions were tested in AR in real conditions of use.
It is interesting to note how the use of monoscopic solutions such as MAR (7) is predominant and how only three propose the use of HMD-O. The reason for this choice may be due to the work environment dedicated to controlling the ship which is mainly the command bridge. The command bridge is a closed and well-sheltered place where the amount of light is more constant than in an open space and where personnel are sheltered from the weather. Moreover, the cost-effectiveness and ease of integrating an AR monitor into the cockpit compared with an HMD-O viewer is a first choice. An AR monitor is a single object that is available to multiple crew members, while use of HMD-O requires that a device should be given to each navigator. In the near future, the use of AR monitors would mean lower cost for shipping companies.
In conclusion, it can be said that the application of AR in the nautical field, and specifically the maritime one, has not been sufficiently investigated and there is still much to be done regarding interface proposals. From this systematic review, it is evident that the research on AR in the maritime field is still in its early days and usable solutions still have not been developed and are not ready for the market. This is confirmed by the scarcity of tests carried out in the field to guarantee a functional product. However, the authors consider that the reference AR device in the maritime field will continue to be the AR monitor, and this could help with the development of interfaces that are already suitable for this display technology. This would make the development process more effective by offering systems suitable for market testing. The application of AR for maritime navigation is in its early stages, and the latest trends to focus on autonomous or unmanned ships and work boats could require new needs, splitting the maritime sector into on-board navigation and remote navigation. This would mean the use of AR for maritime navigation in specific applications for the two above-mentioned sectors (on board and remote).
Companies like Rolls-Royce are investing heavily in the development of autonomous vessels and believe that the crew can better manage operations remotely rather than implementing solutions on board ships. The future is still uncertain and in the coming years, we will see what the predominant choice will be.
Appendix A. Definitions in alphabetic order
Boat speed: The speed of the boat relative to the surface of the earth.
Compass: A digital graphic element that reproduces the display of the degrees of the boat's course, as happens on an analogue compass.
Course over ground: Describes the direction of motion with respect to the surface of the earth.
Depth: Distance between the sea floor and the surface of the sea.
Engine data: Information on the state of the engine such as: RPM, temperature, oil pressure and engine hours.
Heading: the direction that a boat is pointed at any time relative to the magnetic North Pole.
Lat. long: The geographical coordinates of the current boat position. The is an imaginary line extending from the objective to indicate the point at which a boat should tack or gybe in order to just clear the mark on the correct side.
Maps: Digital map display of a navigation area.
Obstacle: Obstacle signalling, position and movement data.
Route: The drawing of the route on the sea surface or on the map considering the point of departure and the point of arrival passing through the intermediate points.
Rudder angle: The acute angle between the rudder and the fore-and-aft line of a ship or a boat.
Tack: The change of direction of the ship, or in a sailing boat when sailing close-hauled by turning the bow to the wind and shifting the sails so as to fall off on the other side at about the same angle as before.
Tide direction: The tide direction expressed in sexagesimal degrees or graphically of the movement of sea water.
Traffic info: Maritime traffic information in order to monitor navigation waters.
Waypoint: Point to reach or turn, part of the course line. it can be a buoy, a port or a coordinate on the route.
Wind direction: The direction of the wind expressed in sexagesimal degrees.
Appendix B. Definitions of technology readiness levels (TRL)
TRL 1 – Basic principles observed
TRL 2 – Technology concept formulated
TRL 3 – Experimental proof of concept
TRL 4 – Technology validated in laboratory
TRL 5 – Technology validated in relevant environment (industrially relevant environment in the case of key enabling technologies)
TRL 6 – Technology demonstrated in relevant environment (industrially relevant environment in the case of key enabling technologies)
TRL 7 – System prototype demonstration in operational environment
TRL 8 – System complete and qualified
TRL 9 – Actual system proven in operational environment


