
1. Introduction
Despite being one of the most widely studied features of Southern English, the pin-pen merger—the merger of /i/ and /ɛ/ before nasals—has rarely been examined or mapped on a broad geographical scale; most studies have focused on the merger within particular communities or particular regions. A notable exception to this is the Atlas of North American English (Labov, Ash & Boberg, Reference Labov, Ash and Boberg2006), which reports that although the merger predominantly occurs in the US South, it is also present in other parts of the country (as has also been reported by a number of previous studies), and that the merger appears to be expanding in apparent time. This study updates and expands on the results of the ANAE by closely examining the phonetic realization of the merger. Additionally, like the ANAE, this study examines production and perception together, focusing particularly on the incidence of near merger.
2. Previous research
2.1 Regional and social distribution
The pin-pen merger has been widely documented in the dialectological and sociolinguistic literature, though as noted above most studies have focused only on a particular community or region. Generally, the merger is associated with the US South and with African American speakers, and to a lesser extent with rural areas and lower class/less educated speakers. The merger is widespread throughout the South, with the exception of New Orleans (Labov et al., Reference Labov2006). Outside of the South, merged white speakers have been reported in Detroit (Edwards, Reference Edwards, Cynthia, Thomas and Robin1997), southern Illinois (Bigham, Reference Bigham2005), southern Indiana (Labov et al., Reference Labov2006), Kansas (Labov et al., Reference Labov2006), Oklahoma (Bakos, Reference Bakos2013), and parts of California (Geenberg, Reference Geenberg2014; Labov et al., Reference Labov2006; Podesva et al, Reference Podesva, Annette, Janneke Van and Kyung Kim2015; Warren & Fulop, Reference Warren and Fulop2014).
Labov et al. (Reference Labov2006) report that Black speakers are more consistently merged than white speakers both in Southern cities and outside of the South. Likewise, in the Linguistic Atlas of the Gulf States (Pederson, McDaniel & Adams, Reference Pederson, McDaniel and Adams1986), Black speakers are more likely to be merged than white speakers.Footnote 1 However, Black speakers are not universally merged, and are less likely to be merged in some cities than in others: Coggshall and Becker (Reference Coggshall and Becker2009) report a lack of merger in New York City (but see Labov (Reference Labov1968)), whereas in Pittsburgh (Eberhardt, Reference Eberhardt2009) and Detroit (Edwards, Reference Edwards, Cynthia, Thomas and Robin1997) African American speakers tend to be merged. It is unclear whether there are larger regional patterns to be observed within African American English—for instance, if Black speakers are more likely to be merged in the Midwest than in the Northeast—or whether this variation is city-specific.
In some communities, the merger correlates with lower social status and/or lower levels of education. At a national level, less educated speakers are more likely to be merged (Labov et al., Reference Labov2006), and in some individual communities like Charleston, South Carolina, lower class speakers are more likely to be merged (Baranowski, Reference Baranowski2013). In other places, there is no apparent social stratification and speakers are equally likely to be merged across different levels of education, such as in West Virginia (Hazen, Reference Hazen2005). Within the same city, social stratification of the merger may differ across racial/ethnic groups: Edwards (Reference Edwards, Cynthia, Thomas and Robin1997) reports that in Detroit, both middle class and working class Black speakers are merged, but only working class white speakers are merged. In contrast to the typical association between the merger and lower social status or education, in the Linguistic Atlas of the Gulf States (Pederson et al., Reference Pederson1986), more educated speakers are more likely to be merged, and middle and upper-middle class speakers are more likely to be merged than lower class speakers (though upper class speakers are the least likely to be merged). This contrast to the pattern reported elsewhere could be attributable to the older nature of the Atlas data. The merger may have once been a prestige feature in the South (cf. Brown, Reference Brown1991), but has subsequently lost its prestige.
The relationship between the pin-pen merger and gender and age is unclear. For gender, some studies find that men are more likely to be merged than women (across the United States: Labov et al., Reference Labov2006), others that women are more likely to be merged than men (in West Virginia: Hazen, Reference Hazen2005; in the South generally: Pederson et al., Reference Pederson1986), and others no gender differences at all (among white speakers in Charleston, South Carolina: Baranowski, Reference Baranowski2013; among African Americans in Detroit: Edwards, Reference Edwards, Cynthia, Thomas and Robin1997).
Whether the pin-pen merger represents a change in progress is similarly inconsistent across communities. At a national level, Labov et al. (Reference Labov2006) find that the merger is expanding in apparent time; this also seems to be true in West Virginia (Hazen, Reference Hazen2005) and among white speakers in Charleston, South Carolina (Baranowski, Reference Baranowski2013). In contrast, in large Southern cities such as Atlanta, Dallas, and Houston, the merger is reported to be reversing itself, with younger speakers less likely to be merged (Koops, Gentry & Pantos Reference Koops, Gentry and Pantos2008; Tillery & Bailey, Reference Tillery, Bailey, Schneider, Kate, Bernd, Rajend and Clive2004). Taken in combination, these results suggest that the merger may be expanding geographically to areas that were historically non-merged—such as West Virginia and Charleston, South Carolina—and may especially be expanding in rural areas, potentially moving towards becoming a marker of rural versus urban speech rather than Southern versus non-Southern speech.
2.2 Phonetic realization
Where phonetic descriptions are given, the pin-pen merger is typically described as a merger towards [i], such that pen sounds like pin to non-merged listeners (e.g., Bailey & Thomas, Reference Bailey, Thomas, Mufwene, Rickford, Guy and John1998:101; Bakos, Reference Bakos2013; Brown, Reference Brown1991; Edwards, Reference Edwards, Cynthia, Thomas and Robin1997; Hazen & Fluharty, Reference Hazen, Fluharty and Margaret2004; Wise, Reference Wise1933; Wolfram & Schilling, Reference Wolfram and Schilling1998). However, some descriptions also mention speakers who merge towards [ɛ], such that pin sounds like pen to non-merged listeners (Bigham, Reference Bigham2005; Ito & Campbell-Kibler, Reference Ito and Campbell-Kibler2011; Labov, Reference Labov1968; Pederson, Reference Pederson1965:41-42; Thomas, Reference Thomas, Schneider, Kate, Bernd, Rajend and Clive2004). Still, other studies describe a merged vowel that is intermediate between [i] and [ɛ] (Koops et al., Reference Koops, Gentry and Pantos2008; Baranowski, Reference Baranowski2013). From these studies, it is clear that a variety of realizations of the merger exist (see Bigham (Reference Bigham2005) for a thorough review of the literature). However, the relative frequency of these different pronunciations is unclear: Thomas (Reference Thomas, Schneider, Kate, Bernd, Rajend and Clive2004), discussing rural white Southern speech, states that a majority of speakers merge towards [i], with fewer speakers merging towards [ɛ], whereas in southern Illinois, Bigham (Reference Bigham2005) finds that a majority of his participants merge towards [ɛ] rather than towards [i]. In the Linguistic Atlas of the Gulf States (Pederson et al., Reference Pederson1986), 36% of participants merge towards [i] (across seven pen words), whereas only 17% merge towards [ɛ] (in the item pin).
It is unclear whether these different descriptions of the merger’s phonetic realization can be attributed to the different populations studied: to date, no study has examined the extent to which this variation in the merger’s phonetic realization is constrained by geographic or social factors. Comparing across studies, there is no obvious geographic, social, or temporal pattern as to which studies report [i] versus [ɛ]. For studies which report multiple realizations within a particular community, there are no clear social differences between speakers who merge towards [i] versus those who merge towards [ɛ].
2.3 Production versus perception
Most previous work on the pin-pen merger has focused on the merger in production, i.e., whether speakers pronounce pin and pen words differently. However, merger may also be assessed in terms of perception, i.e., whether speakers can hear the difference between pin and pen words. Merger in perception need not always go hand in hand with merger in production: in a “near merger,” speakers cannot hear the difference between two sounds, yet still pronounce them at least subtly differently (Labov, Reference Labov1994:ch.12). Near mergers have been attested for a number of mergers (e.g., Bowie, Reference Bowie2000; Di Paolo, Reference Di Paolo1992; Labov, Reference Labov1994). The converse situation, a merger in production but not in perception—i.e., producing two sounds the same, but being able to perceive the difference between them—seems to be less common or nonexistent. Labov et al. (Reference Labov2006:29) report some speakers who appear to be merged in production but not perception, but comment that this is likely the result of participants thinking that words are pronounced differently because they are spelled differently. Other studies have found speakers who are merged in production, but who can distinguish between the two sounds at higher-than-chance levels when produced by non-merged speakers (Hay, Drager & Thomas, Reference Hay, Drager and Thomas2013; Thomas & Hay, Reference Thomas and Hay2005).
Despite the widespread attestation of near merger for other mergers, little work on the pin-pen merger has examined production and perception together. An exception is Labov et al. (Reference Labov2006), which collected both production (elicitation of pin and pen) and perception (asking participants whether they judged pin and pen to be the same or different) data. Labov et al. found that fifty participants judged pin and pen to sound the same, but produced them differently—i.e., had a near merger—as compared to 183 who were merged in both production and perception, and only eight who judged pin and pen to sound different but pronounced them the same. Labov’s earlier work on African American speakers in New York City (Labov, Cohen, Robins & Lewis, Reference Labov, Cohen, Robins and Lewis1968:119–120) also found a similar pattern, where “quite a few” participants produced pin and pen differently but perceived them as being the same. In both of these works, what demographic characteristics might make a speaker more likely to be near merged are not examined. In looking at the map in the atlas, there is no obvious geographic pattern as to where these speakers are located—they are found in roughly equal numbers both inside and outside of the isogloss for the merger and are not confined to any particular region. Thus, while this work demonstrates that near merger for pin-pen exists, it is still unclear whether there is any geographical or social pattern as to which speakers are more likely to be near merged.
The results of other work examining production and perception together have been contradictory: in Charleston, South Carolina, Baranowski (Reference Baranowski2013) found that speakers were more likely to be merged in production than in perception, where perception was assessed by asking speakers to judge whether pairs of words sounded the same during a minimal pair wordlist reading task. Baranowski speculates that these results are due to the merger being above the level of awareness in Charleston: speakers might be more likely to judge two words as different because they know they are “supposed” to be different (under a standard language ideology), regardless of whether they can actually hear the difference between the two words. Thus this task may not be measuring speech perception per se but rather speakers’ ideologies about the merger and about their own speech. Potentially the inverse ideological stance can be found in southern Maryland (Bowie, Reference Bowie2000), where some participants reported that they merged pin and pen but in fact did not. These studies, then, suggest that speakers’ reports of their own production and perception may not always reflect their actual linguistic behavior.
3. Research questions
As outlined above, no study other than Labov et al. (Reference Labov2006) has examined the pin-pen merger on a US-wide scale, and no study has examined the merger’s phonetic realization on a US-wide scale, despite the differing descriptions of the realization across (and sometimes within) studies. Additionally, while previous studies have shown that some speakers have mismatches between production and perception of the merger, whether there is any geographical or social patterning to these mismatches remains unclear. Thus, this study asks four research questions:
-
1. What is the geographic and social distribution of the merger in production?
-
2. What is the geographic and social distribution of the merger in perception?
-
3. What is the relationship between production and perception of the merger, and is this relationship geographically/socially conditioned?
-
4. Among speakers who are merged in production, is there any geographic or social conditioning to the phonetic realization of the merged vowel (towards [i] or towards [ɛ])?
4. Methods
4.1 Participants
Participants from across the United States were recruited via Amazon Mechanical Turk, an online platform where people do tasks for pay over the Internet. In the past several years, Mechanical Turk and similar platforms have been used for a variety of linguistic research (e.g., Degen & Goodman, Reference Degen and Goodman2014; Kanwal, Smith, Culbertson & Kirby, Reference Kanwal, Smith, Culbertson and Kirby2017; Kim, Wyschogrod, Reddy & Stanford, Reference Kim, Wyschogrod, Reddy and Stanford2016; Tamminga, Reference Tamminga2017), and have been shown to produce results similar to those of laboratory studies (Berinsky, Huber & Lenz, Reference Berinsky, Huber and Lenz2012; Enochson & Culbertson, Reference Enochson and Culbertson2015; Tamminga, Reference Tamminga2017; Wang, Huang, Yao & Chan, Reference Wang, Huang, Yao and Chan2015). Participation was limited to users in the United States, and data from participants who reported having grown up outside of the United States or not speaking English as a native language were discarded (n=12). Data from an additional 9 participants were discarded for failing attention checks in the perception task (described below). Participants were paid $2.50 each.
Production and perception data were analyzed from 277 participants, with perception-only data from an additional 94 participants from whom production data could not be collected due to technical difficulties. Participant hometowns were fairly evenly scattered across the US, as shown in Figure 1a. Of the 277 participants with both production and perception data, 48% were female and 52% were male. The median age of these participants was 34 (Figure 1b). As compared to the US population as a whole, white, Asian, and mixed race speakers were overrepresented (77% white participants compared to 64% of the US population; 6% Asian as compared to US 5%; 4% mixed race as compared to US 3%), and Black and Latino speakers were underrepresented (8% Black as compared to US 12%; 5% Latino as compared to US 16%) (Figure 1c). On average, participants were more educated than the general US population (47% of participants had achieved a Bachelor’s degree or higher, as compared to 31% of the US population) (Figure 1d). Demographics for the perception-only participants were similar (median age 36; 73% white, 7% Black, 10% Latino, 7% Asian, 2% mixed race; 46% with a Bachelor’s degree or higher), though more heavily male (37% female, 63% male).
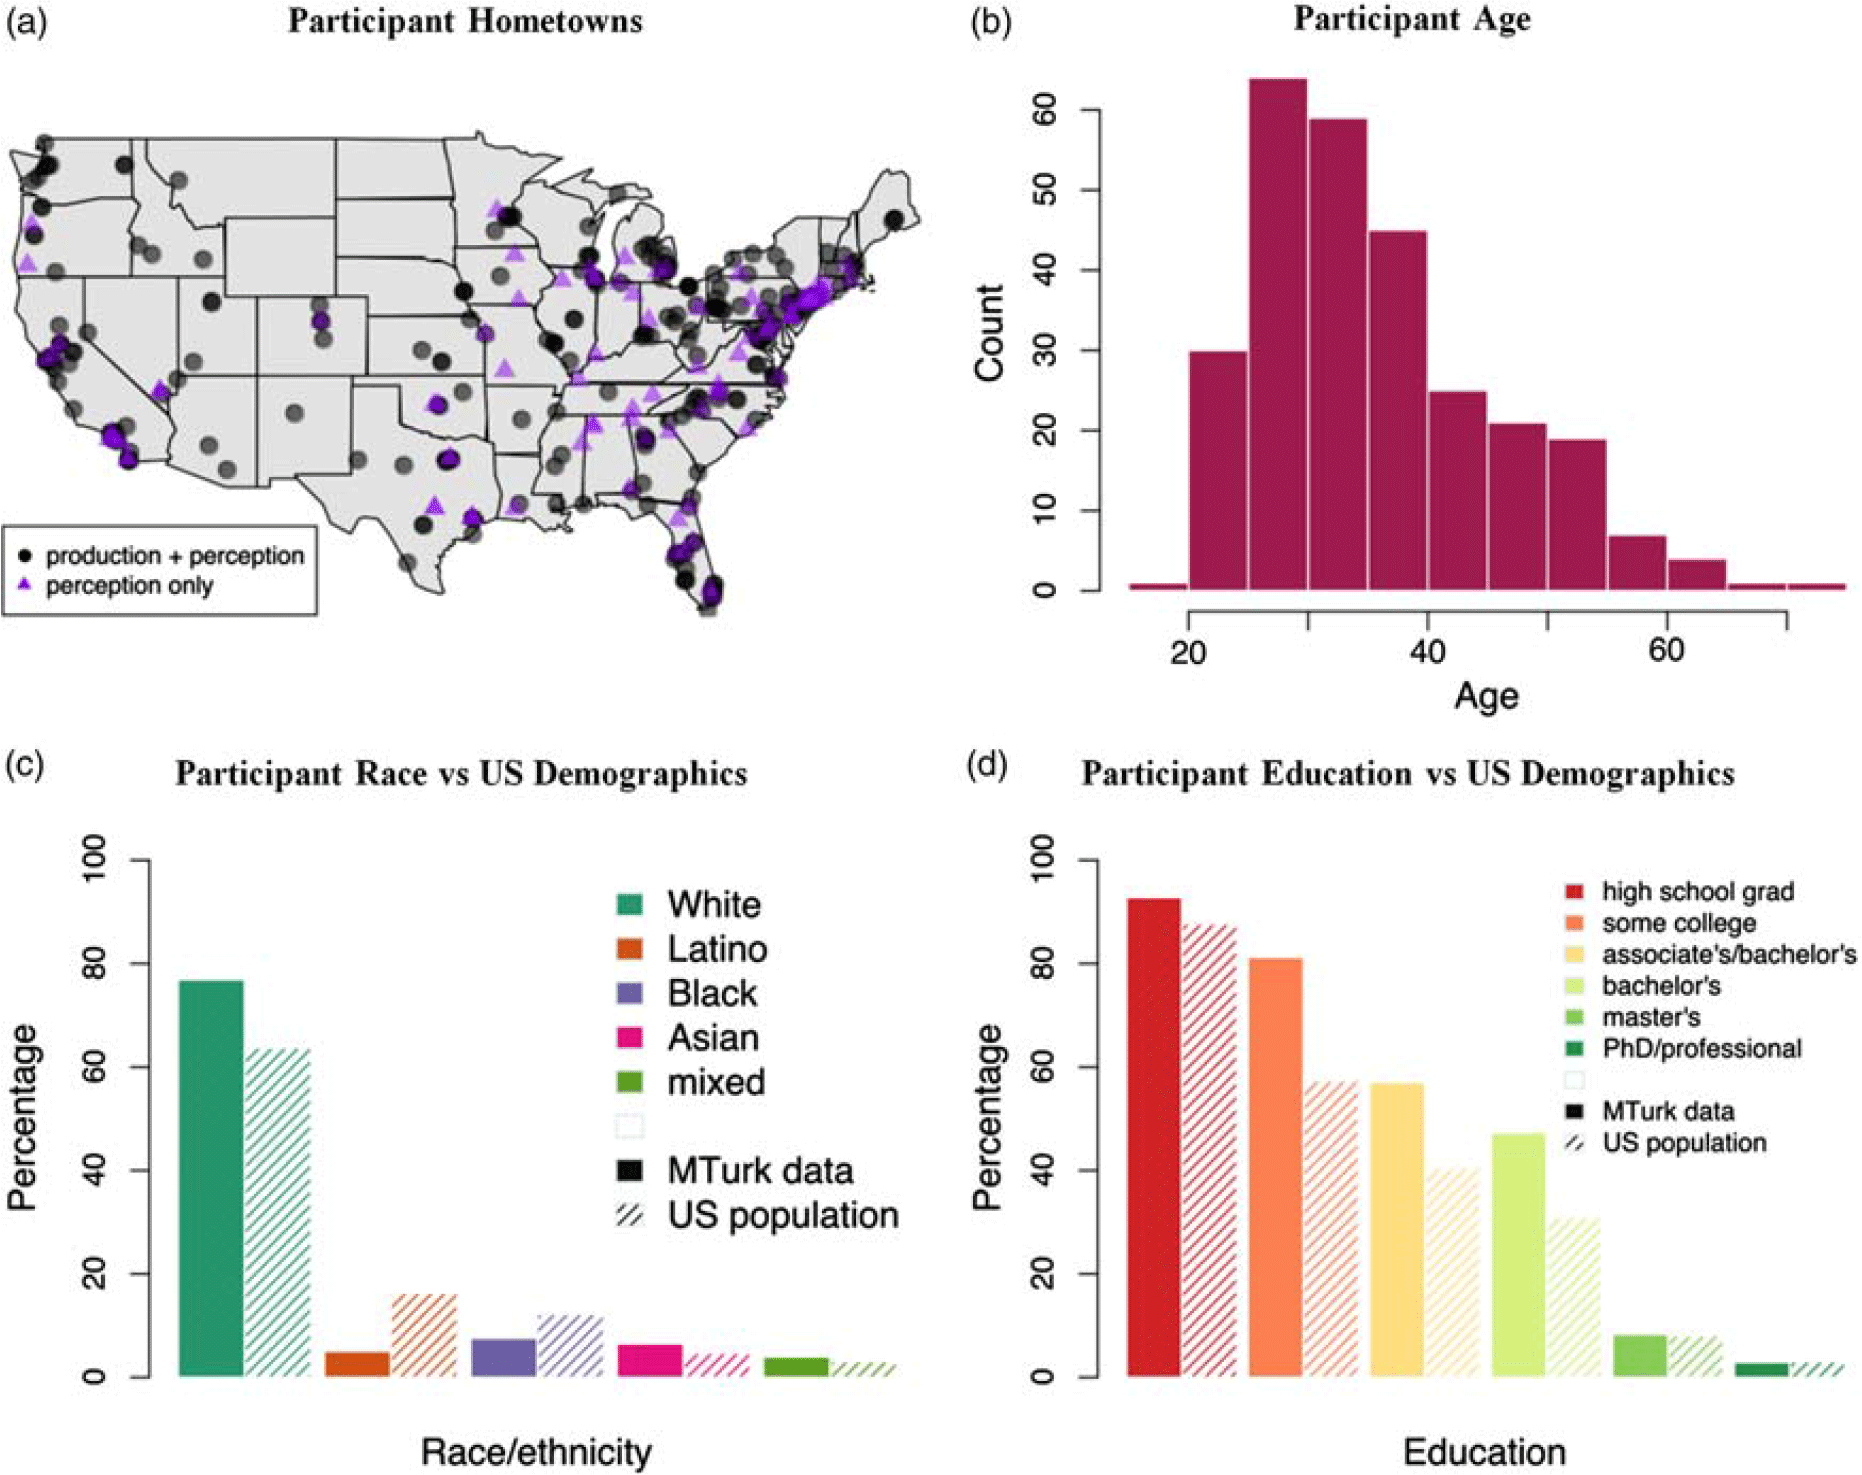
Figure 1. Demographic characteristics of participants.
4.2 Procedure
At the beginning of the experiment, participants completed a matched guise task involving pin-pen words realized both with [i] and [ɛ]. The structure of this task and its results will be described in future work by this author (see also Austen, Reference Austen2017) and will not be discussed here, but are mentioned because the pin-pen words in the task may have prompted participants to be more aware of pin-pen words in the subsequent tasks described below. In the task, participants heard talkers read sentences aloud and were then asked to rate the talkers along a series of Likert scales (e.g., How educated does this person sound?). Each target sentence contained one pin-pen word. Participants heard an equal number of merged and non-merged pronunciations. Of the merged pronunciations, participants heard an equal number of mergers towards [i] and towards [ɛ].
4.2.1 Production: wordlist
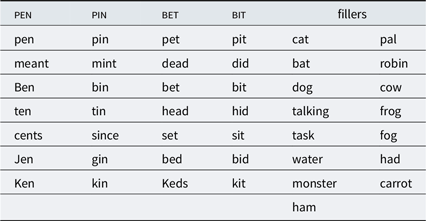
Following the matched guise task, participants recorded themselves reading a wordlist presented in random order, using either their computer’s microphone or an external microphone. The wordlist contained 7 pairs of pin-pen words and 15 fillers (listed in Table 1); in addition, there were 7 pairs of bit-bet words—non-pre-nasal /i/ and /ɛ/—which should be unaffected by the merger. For merged speakers, these bit-bet productions were used to determine which vowel the speaker merged towards. Due to incompatibilities between the recording script and certain browsers, as well as some participants lacking microphones, production data were available for only 277 of the participants (74%).
Table 1. Words read by participants in production task.

It should be noted that participants’ use of their own microphones is a limitation of this study. As an anonymous reviewer points out, different recording devices can yield different acoustic measurements (De Decker, Reference De Decker2015; De Decker & Nycz, Reference De Decker and Nycz2011), which could lead to participants using certain microphones seeming more or less merged than they would have with another microphone. Unfortunately, participants were not asked what type of microphone they were using, meaning that microphone type cannot be included as a factor in the analysis. However, as we shall see in the results section, the findings about merger in production largely mirror those of previous studies. This suggests that, even with the noise introduced by different recording devices, the data collected in this study are still reliable.
4.2.2 Perception: word identification
To test for merger in perception, participants completed a forced-choice word identification task: they heard a word (e.g., “pen”) and were asked to click on the word they heard (e.g., “pen” or “pin”). Stimuli were produced by a standard-sounding talker in her mid-20s. Listeners heard two productions each of four pairs of pin-pen words (pin/pen, bin/Ben, tin/ten, and mint/meant), plus two productions each of three pairs of fillers (dog/dock, cat/bat, and bit/bet). Stimuli were presented in random order. To ensure that participants were paying attention and could distinguish between [i] and [ɛ] in non-pre-nasal contexts, data from participants who misperceived two or more of the bit/bet or cat/bat filler stimuli were discarded (n=9).Footnote 2
4.2.3 Rhyming
An additional manner in which speakers may be merged is in rhyming: merged participants should say that pairs such as “Jen” and “kin” rhyme, whereas non-merged participants should not. Participants were shown pairs of words and asked whether they rhymed. Participants gave judgments on four pairs of pin-pen words, along with eleven fillers. To check that participants were not unduly influenced by orthography, the fillers included pairs that rhymed but differed orthographically (e.g., “weigh” and “pay”), or matched orthographically but did not rhyme (e.g., “cow” and “tow”).
4.3 Demographic questionnaire
At the end of the experiment, participants were asked where they grew up, languages they spoke by the age of five, gender, race/ethnicity, year of birth, occupation, highest level of education completed, current zip code, and what they thought the experiment was about.
Based on responses to this questionnaire, participants’ race/ethnicities were coded as “white,” “Black” “Latino,” “Asian,” or “mixed race.” Participants checking the “white” box in combination with the “Hispanic/Latino/a” box were counted as Latina/o; any other combination of boxes was counted as “mixed race”. Three participants declined to provide their race; they were coded as “white” because this was the most frequent category in the data.
For participants who stated that they had grown up in multiple places (n=27), hometown was coded based on the location they reported having lived at the longest between the ages of 5 and 15. Education level was coded along a 9 point scale (1=some high school, 2=GED, 3=high school graduate, 4=some college, 5=associate’s degree, 6=bachelor’s degree, 7=some graduate school, 8=master’s degree, 9=PhD or professional degree).
4.4 Acoustic analysis
The vowel in each pin-pen and bit-bet word was measured at the midpoint in Praat (Boersma & Weenink, Reference Boersma and Weenink2002), with the onset of each vowel defined at the beginning of the second formant and the offset either by the point at which the spectrogram abruptly lightened, indicating the onset of the following nasal consonant (for pin-pen words), or at the end of the second formant (for bit-bet words). Vowels were measured automatically using Praat’s formant tracker, but checked by hand to ensure the formant tracker’s accuracy.
5. Results
5.1 Merger in production
Here I first examine what demographic factors are associated with the pin-pen merger in production. The degree to which each participant was merged was calculated as a Pillai score, the output of a MANOVA which measures the distinctiveness of two distributions (here, the distributions of pre-nasal /i/ and /ɛ/) (Hall-Lew, Reference Hall-Lew2010; Hay, Warren & Drager, Reference Hay, Warren and Drager2006). The higher the Pillai score, the more distinct the two vowels. Participants’ Pillai scores ranged from 0.005 to 0.994, of a maximum possible range of 0 to 1.
A reviewer notes that Pillai scores have been criticized (Johnson, Reference Johnson2015) and may be unreliable for small token counts. Because of this concern, merger was additionally measured using Bhattacharyya’s affinity (Bhattacharyya, Reference Bhattacharyya1943). Calculating Bhattacharyya’s affinity requires at least five tokens per vowel class; 42 (15%) of the participants did not meet this criterion due to background noises or recording errors that made fewer than five tokens of at least one vowel class measurable. Therefore, the dataset with Bhattacharyya’s affinity is slightly smaller than that with Pillai score. Analyses with Bhattacharyya’s affinity produced qualitatively similar results to Pillai score, so in the sections of this paper that follow I report primarily on Pillai score (since Pillai score allows for analysis of the full production dataset), but describe any differences observed in the analysis with Bhattacharyya’s affinity.
To determine which demographic categories of speakers were most likely to be merged, social factors affecting Pillai score (or Bhattacharyya’s affinity) were modeled using a Generalized Additive Model (GAM). Since previous research has shown that region correlates with the pin-pen merger, a GAM offers a better model than linear regression: while traditional regression can only model predictors as straight lines, GAMs can model arbitrarily curvy lines (i.e., functions with any number of exponents). As regional differences do not usually occur along a straight line, this makes the GAM a superior tool for modeling regional variation. Here regional variation was modeled as a smooth curve of latitude and longitude of the participant’s hometown. Predictors tested for the model were race (treated as a sum contrast), age, gender, education level, and logarithm of hometown population according to the 2010 US Census. Where the participant had left a question blank, it was replaced with the overall participant mean. The model was built using a step-up approach, using log-likelihood comparisons with an alpha of 0.05; when p-values were identical, AIC was used as the selection criterion.
The final model consisted of the latitude/longitude smooth curve, education level, race/ethnicity, hometown population, and year of birth; only gender was not significant (Table 2). (With Bhattacharyya’s affinity, educational level and hometown population were not significant, but still trended in the same direction.) Model predictions by latitude and longitude are shown in Map 1: speakers in the South are predicted to be more merged (have lower Pillai scores) than elsewhere, replicating previous research. Less educated speakers (t(260)=2.098, p=0.037), Black speakers (t(260)= −3.59, p<0.001), and speakers from smaller towns (t(260)=2.468, p=0.016) are more likely to be merged, also matching previous research. Additionally, older speakers are more likely to be merged than younger speakers (t(260)=2.468, p=0.014), suggesting that the merger may be reversing itself, at least in some communities.
Table 2. Production Model.
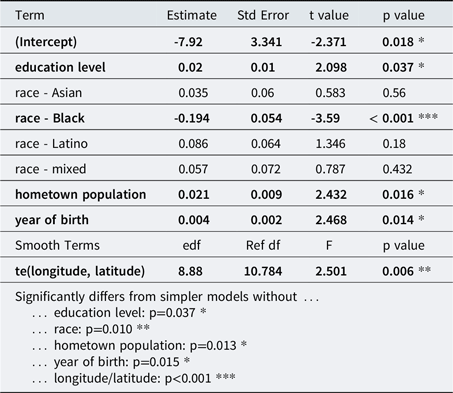
Generalized additive model predicting Pillai scores (smaller = more merged). Race is treated as a sum contrast, so the coefficient for white speakers is -1 times the sum of the coefficients for other races (-0.016).
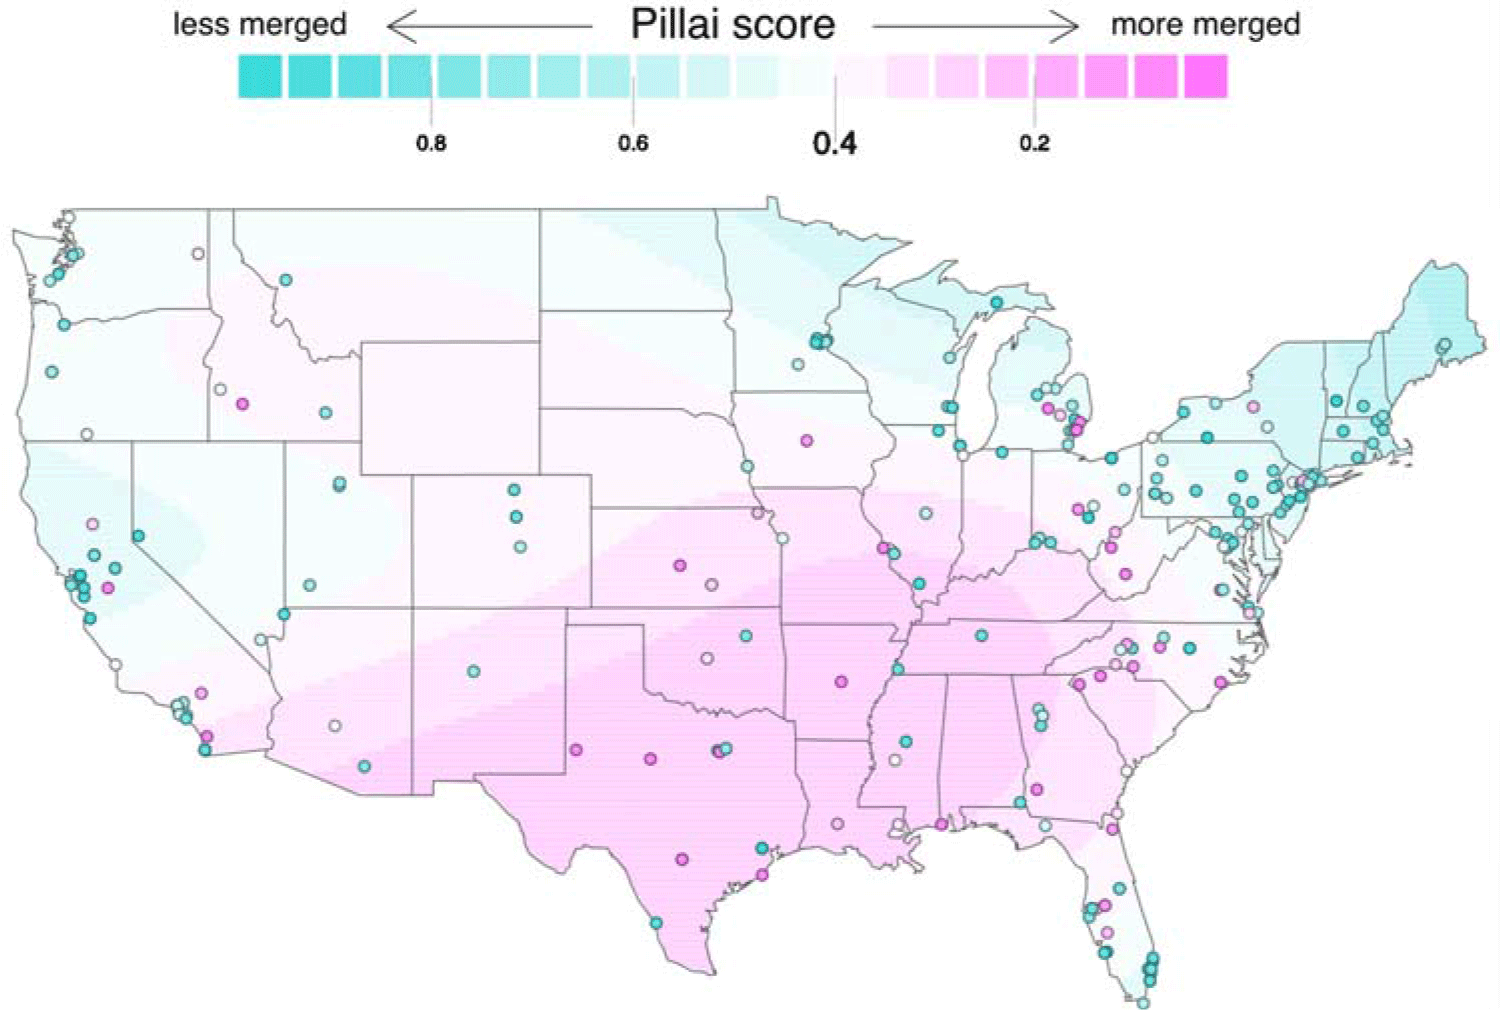
Map 1. Map of Predicted vs Actual Pillai Scores. Predicted (background colors) and actual (foreground dots) Pillai scores. Model predictions are for a 35-year-old white speaker who has attended some high school, from a hometown of population 400.
5.2 Phonetic realization of the merger
How did merged participants vary in the quality of their merged vowel, and were there demographic differences in who merged towards [ɛ] versus [i]? Merged participants were defined as those with a Pillai score of 0.4 or lower (n=64). This cutoff was chosen because above 0.4 most MANOVAs used to calculate the Pillai score indicated that the distributions of pin and pen were significantly distinct (Figure 2)Footnote 3.
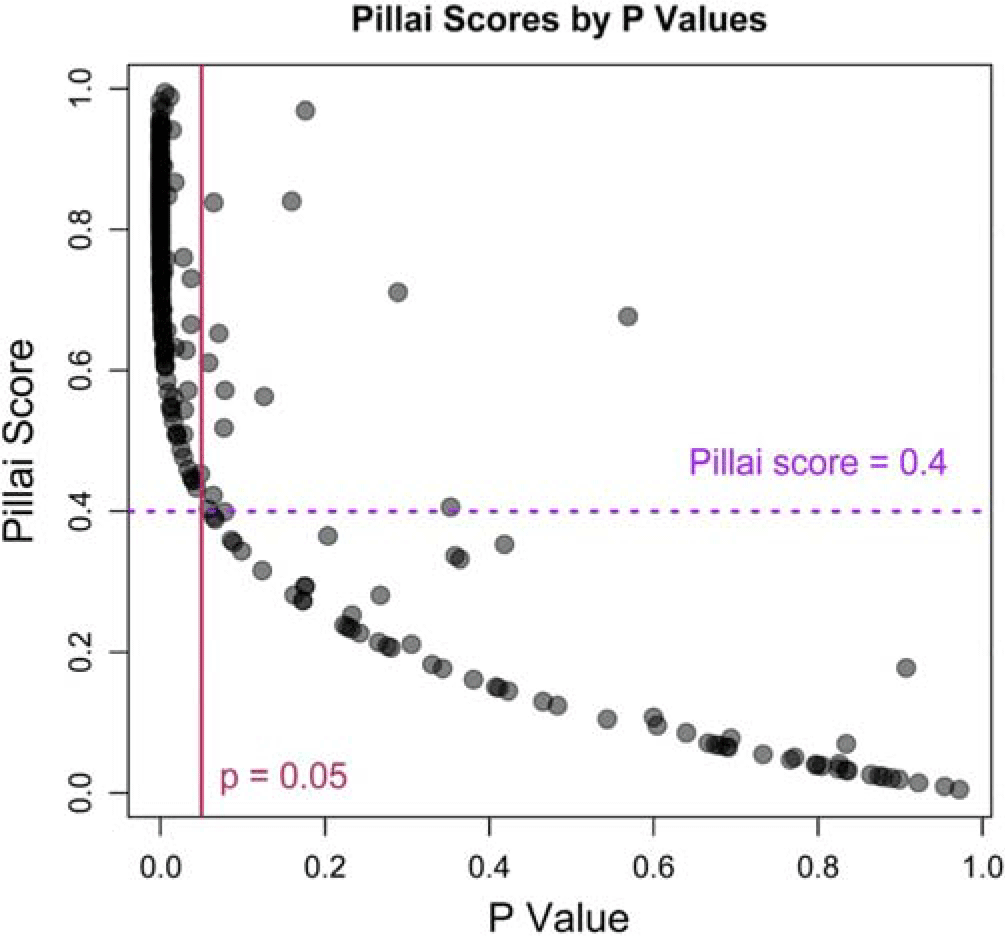
Figure 2. Pillai Scores by P-Values. Pillai scores versus MANOVA p-values. Most participants with Pillai scores greater than 0.4 have p-values of 0.05 or smaller, indicating that their [in] and [ɛn] are distinct; thus, a Pillai of 0.4 is used as the cutoff between merged and distinct participants.
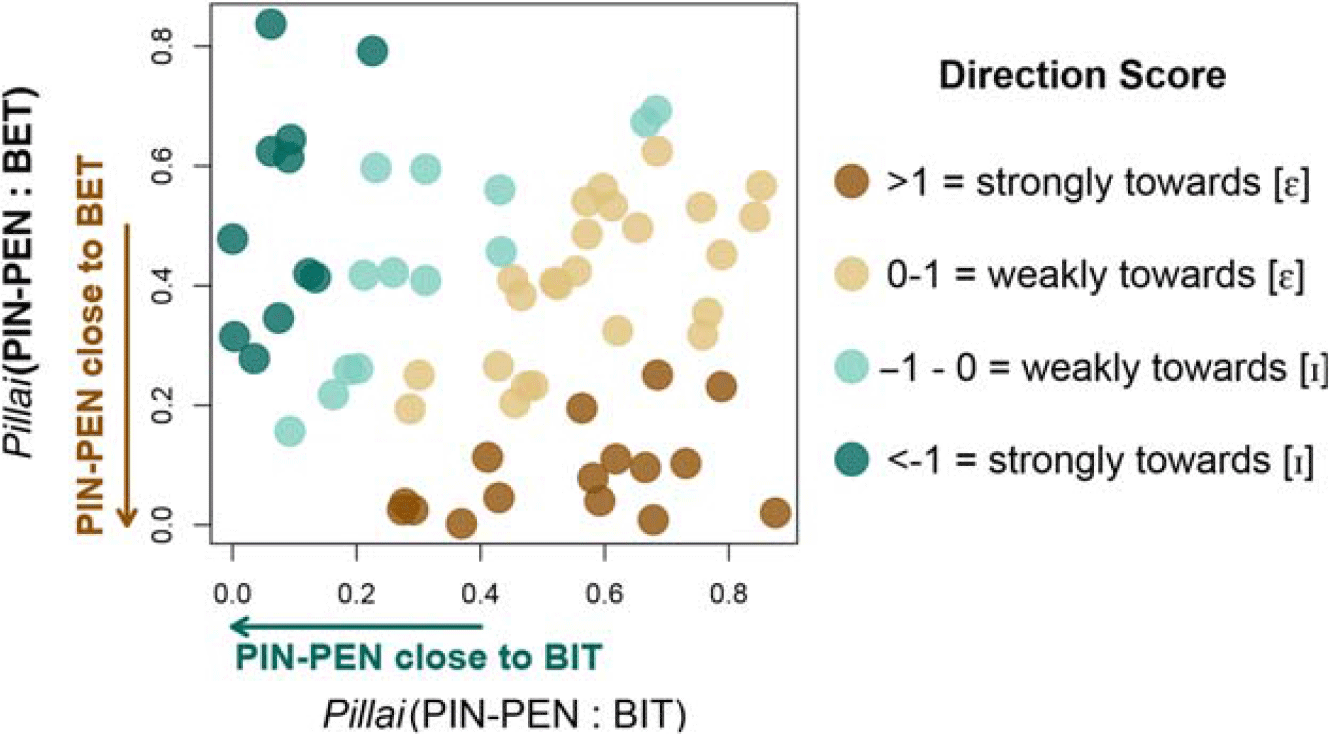
For each merged participant, the vowel in each bit and bet word (i.e., non-pre-nasal /i/ and /ɛ/) was measured at the midpoint. Then, two Pillai scores were calculated: one testing for distinction between pin-pen words and bit words, and one between pin-pen words and bet words. A low pin-pen:bit Pillai score indicates that the merged vowel is similar to [i], whereas a low pin-pen:bet score indicates that the merged vowel is similar to [ɛ]. (A low score for both would indicate that all three vowel classes are similar, i.e., that pin-pen, bit, and bet have highly overlapping distributions.) From these two Pillai scores, a directionality score was calculated as the natural logarithmFootnote 4 of the ratio of the pin-pen:bit score to the pin-pen:bet score:
Direction Score = ln(Pillai(pin-pen:bit)/Pillai (pin-pen:bet))
A positive score indicates that the participant’s merged vowel is closer to [ɛ]; a negative score that the vowel is closer to [i]; and a score of 0 that the vowel is equidistant between [i] and [ɛ]. Sample vowel plots of participants with positive, negative, and near-zero directionality scores are shown in Figure 3. Scores ranged from -7.32 to 5.08, with a median score of 0.22 (i.e., a vowel somewhat in the middle, but slightly closer to [ɛ].) Figure 4 plots the scores for each participant. These results indicate that a merger towards [ɛ] is more common than the literature suggests: 40 of the participants (63%) have a positive directionality score, i.e., a merged vowel closer to [ɛ]. With Bhattacharyya’s affinity, defining “merged” participants as those with affinity scores greater than 0.75 (n=48), the median directionality score is -0.02 (i.e., an intermediate vowel, slightly closer to [i]), and 48% of participants have a positive directionality score.
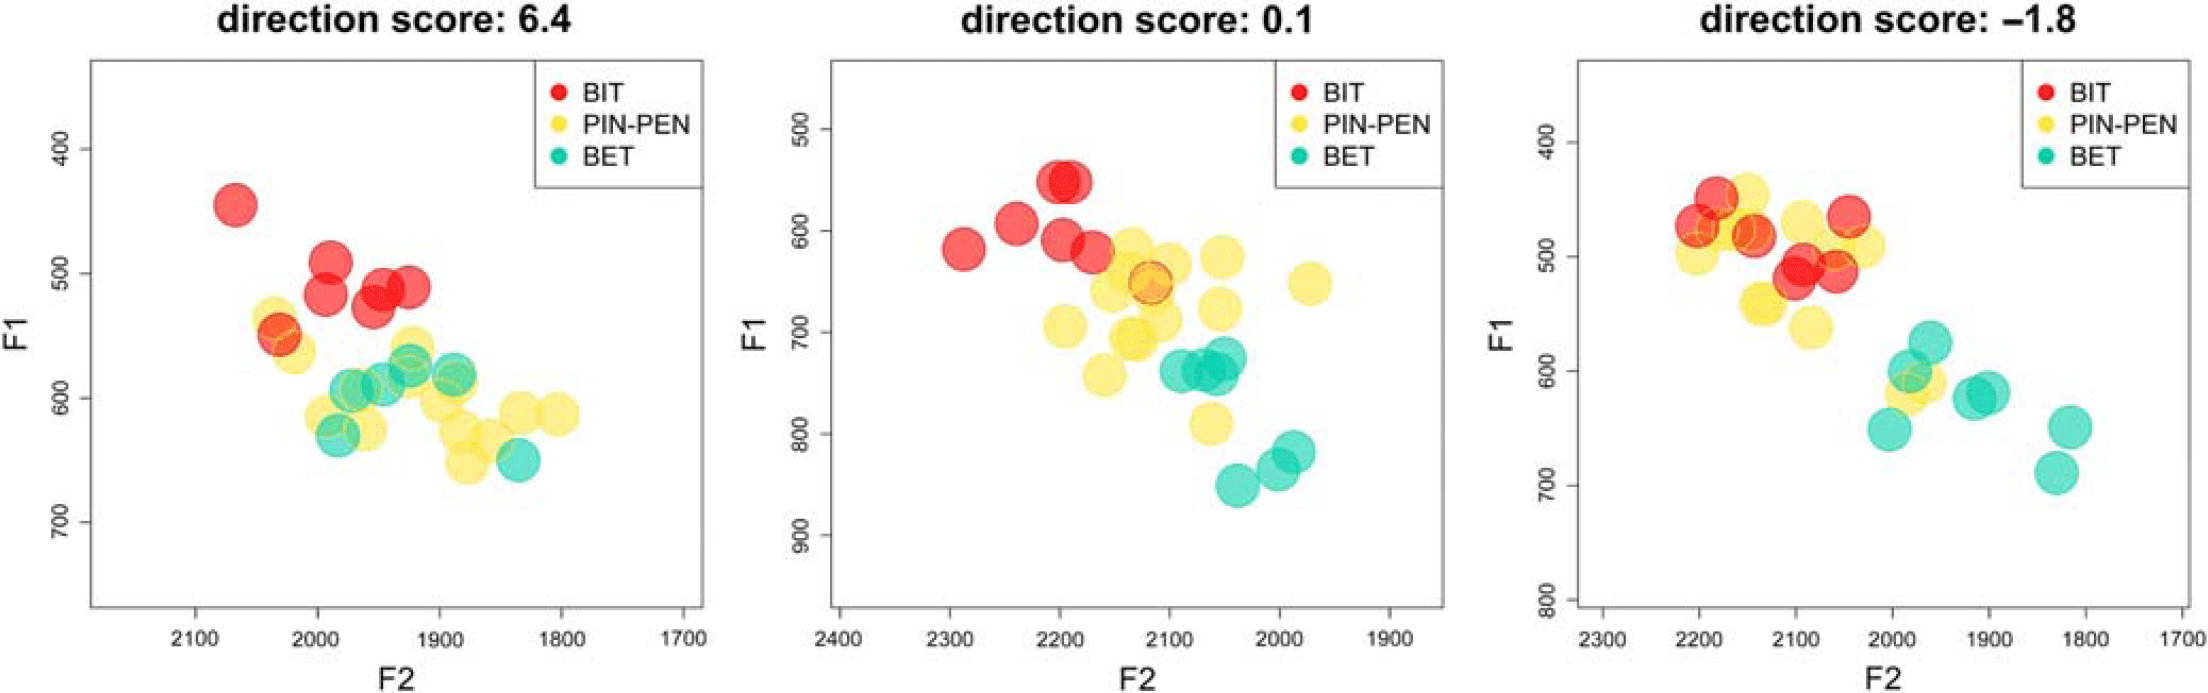
Figure 3. Sample Direction Scores. Vowel plots from a participant with a positive directionality score (6.4, on the left), indicating a merger towards [ɛ]; a directionality score close to 0 (0.1, in the middle), indicating an intermediate vowel; and a negative directionality score (-1.8, on the right), indicating a merger towards [i].

Figure 4. Direction Scores. pin-pen:bit and pin-pen:bet Pillai scores for each merged participant, color-coded by directionality score. Speakers in the top left quadrant can be interpreted as merging towards [i], in the top right as having an intermediate vowel midway between [i] and [ɛ], in the bottom right as merging towards [ɛ], and in the bottom left as having minimal distinction between [i] and [ɛ] even in non-pre-nasal contexts.
To test for the influence of social factors (age, education level, gender, hometown population, race, and latitude/longitude) on the realization of the merger, a model with direction score as the dependent variable was constructed in the same manner as above. No factor, including latitude/longitude, was significant in the analysis with Pillai score.
Whether the lack of effect for any other social factor means that these factors do not condition the variation between [i] and [ɛ] remains unknown: the number of merged participants might be too small to yield a significant effect, or the variation might be socially stratified differently in different communities across the United States (e.g., [ɛ] being produced by more educated speakers in one community, but by less educated speakers in another). The first of these possibilities, that the lack of significant results stems from an insufficient number of participants, seems unlikely, as none of the social factors show any trends (see Figure 5), with the exception of a clustering of speakers who merge to [i] in California (Figure 5f). (With Bhattacharyya’s affinity, longitude—but not latitude—is a significant (p=0.03) predictor of directionality score. This model predicts that speakers in the West are more likely to merge towards [i] than in the Midwest or the South.) Thus, these results seem to suggest that the variation between [i] and [ɛ] is largely random, and not conditioned by any of the social factors examined in this study.
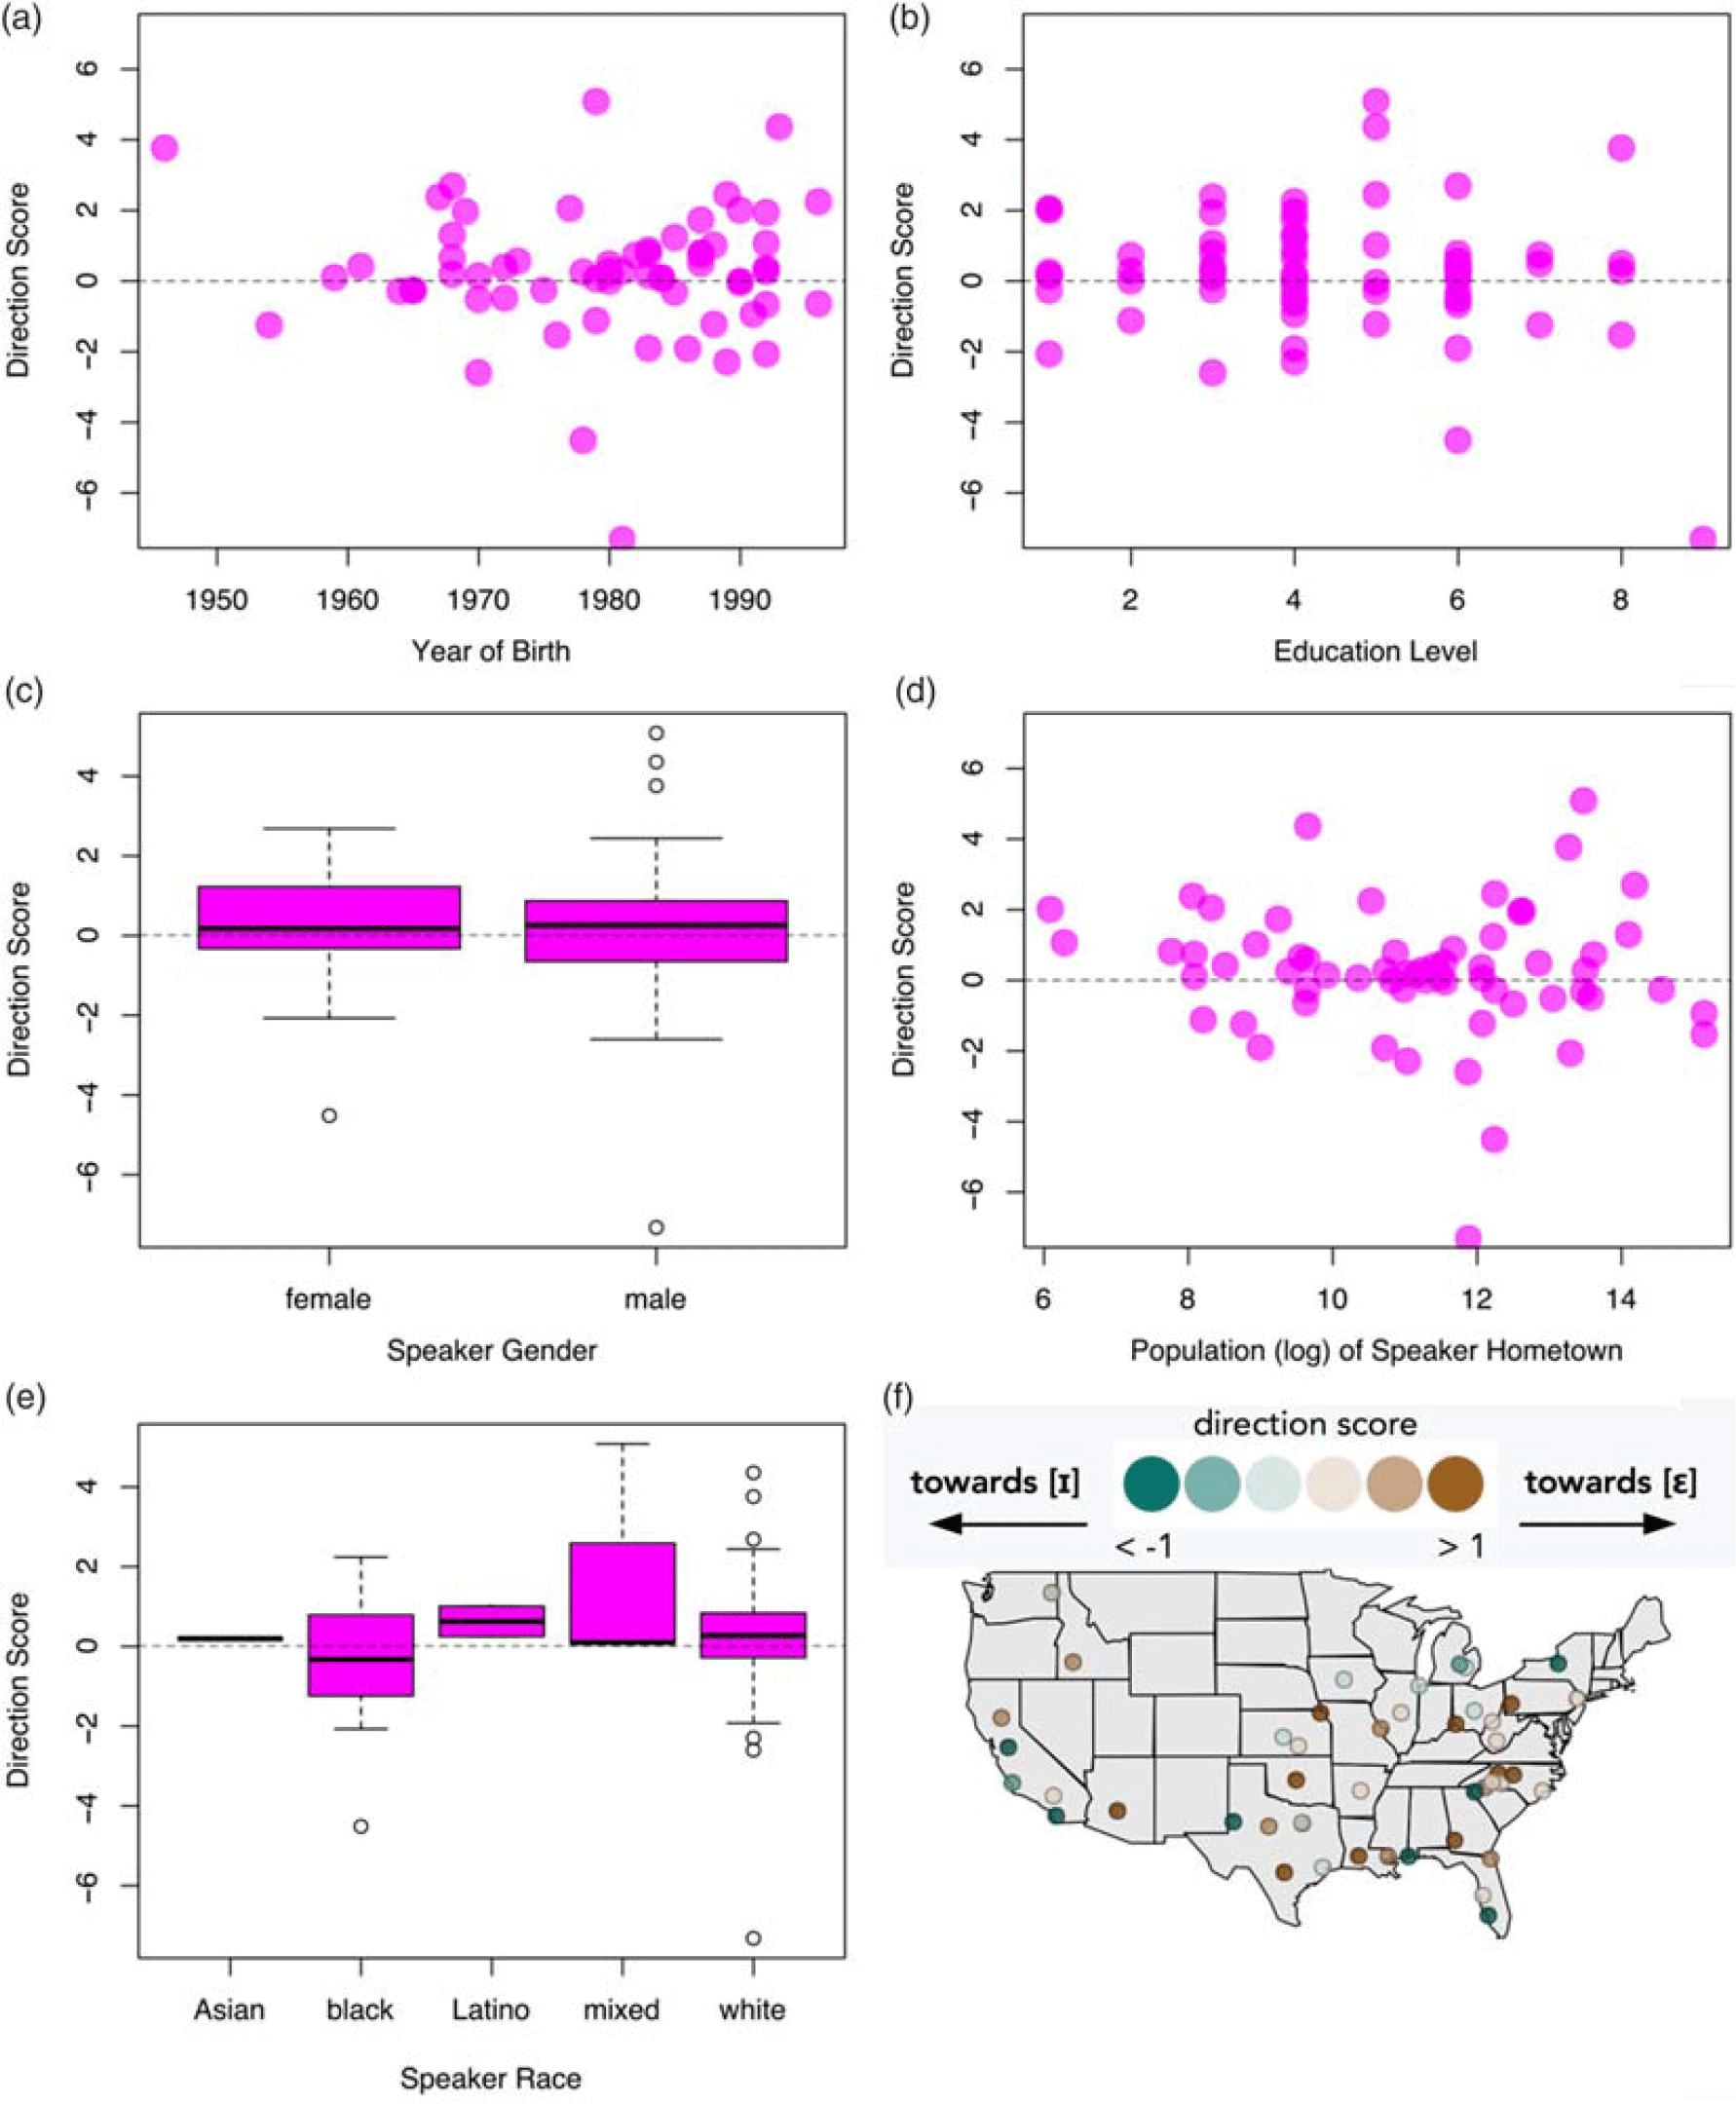
Figure 5. Direction Score by Social Factors. Direction score by various social factors, showing a lack not just of significant effects but also of any noticeable trends.
5.3 Merger in perception
Merged listeners were expected to perform at chance on the word identification task. However, nearly all participants scored better than chance: of the 372 participants, only 11 (3%) were at or below 50% accuracy (see Figure 6). (Similar results, where merged participants can identify words with higher than chance accuracy, have also been found with other mergers, e.g., Thomas and Hay (Reference Thomas and Hay2005) and Arnold (Reference Arnold2015).)
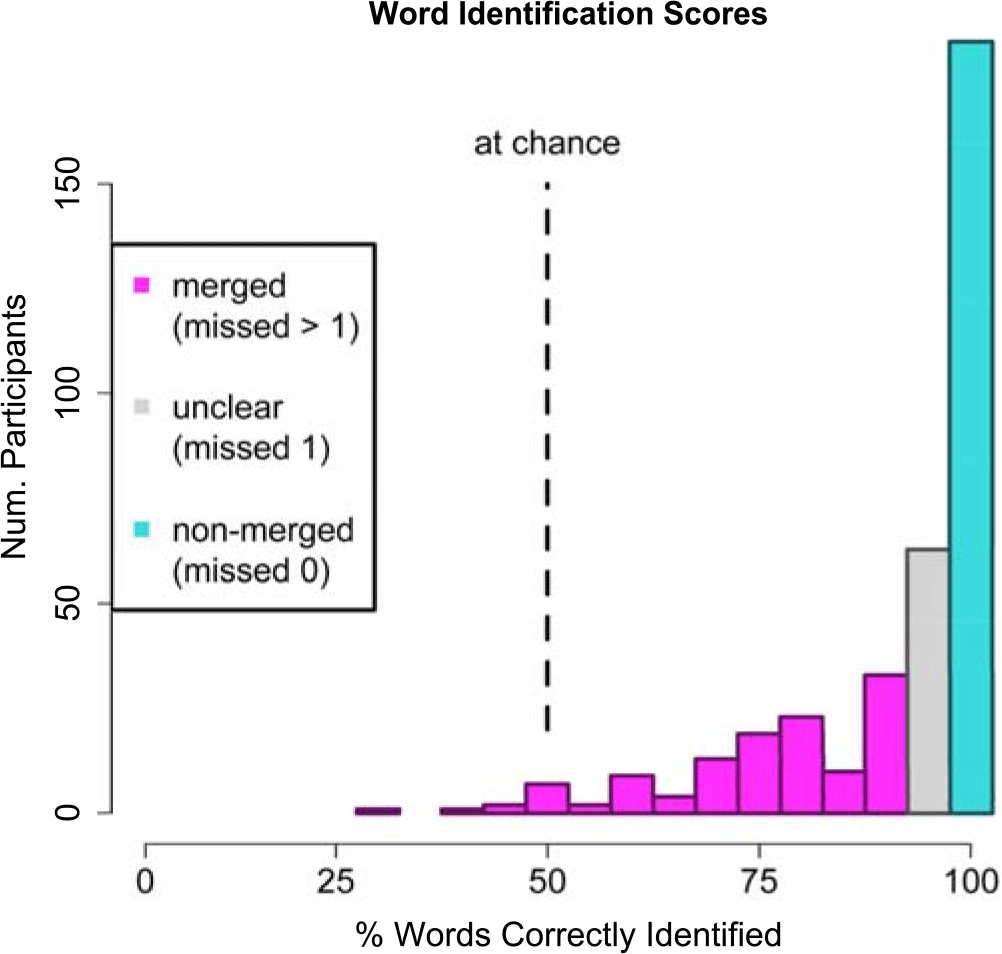
Figure 6. Word Identification Scores. Histogram of scores on the word identification task, color coded to show how scores were classified as “merged”, “unclear”, or “non-merged”.
Because most participants performed better than chance, merger in perception was defined as whether a listener could consistently—i.e., with 100% accuracy—distinguish between pin and pen. Participants who identified all sixteen of the pin-pen tokens correctly were classified as non-merged (n=185, 50%), and participants who misidentified two or more were classified as merged (n=123, 33%). Those who misidentified only one token (n=64, 17%) were excluded from analysis, as this group of participants was likely to include both truly merged participants who performed exceptionally well by chance and non-merged participants who accidentally clicked on the wrong word despite accurately perceiving it.
To examine social factors affecting merger in perception, a model was constructed in the same manner as for production, with the participant’s classification as “merged” or “non-merged” as the dependent variable. The final model included a smooth for latitude and longitude, education level, and race (Table 3). As with production, speakers in the South were most likely to be merged (Map 2). The lower the level of education, the more likely that a participant would be merged (t(290)=-2.56, p=0.01). Black speakers were significantly more likely to be merged than speakers of other races/ethnicities (i.e., had a higher probability of being merged than the mean probability across speakers of all races/ethnicities, t(290)=2.809, p=0.005), replicating previous research.
Table 3. Perception Model.
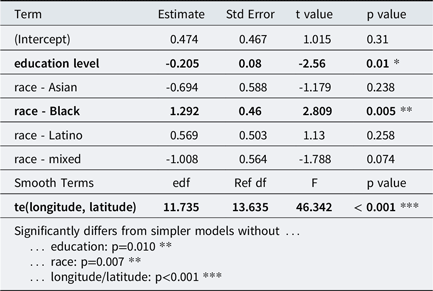
Binomial GAM predicting whether a speaker will be merged in perception (higher coefficient = more likely to be merged). Race is treated as a sum contrast, so the coefficient for white speakers is -1 times the sum of the coefficients for other races (0.159).
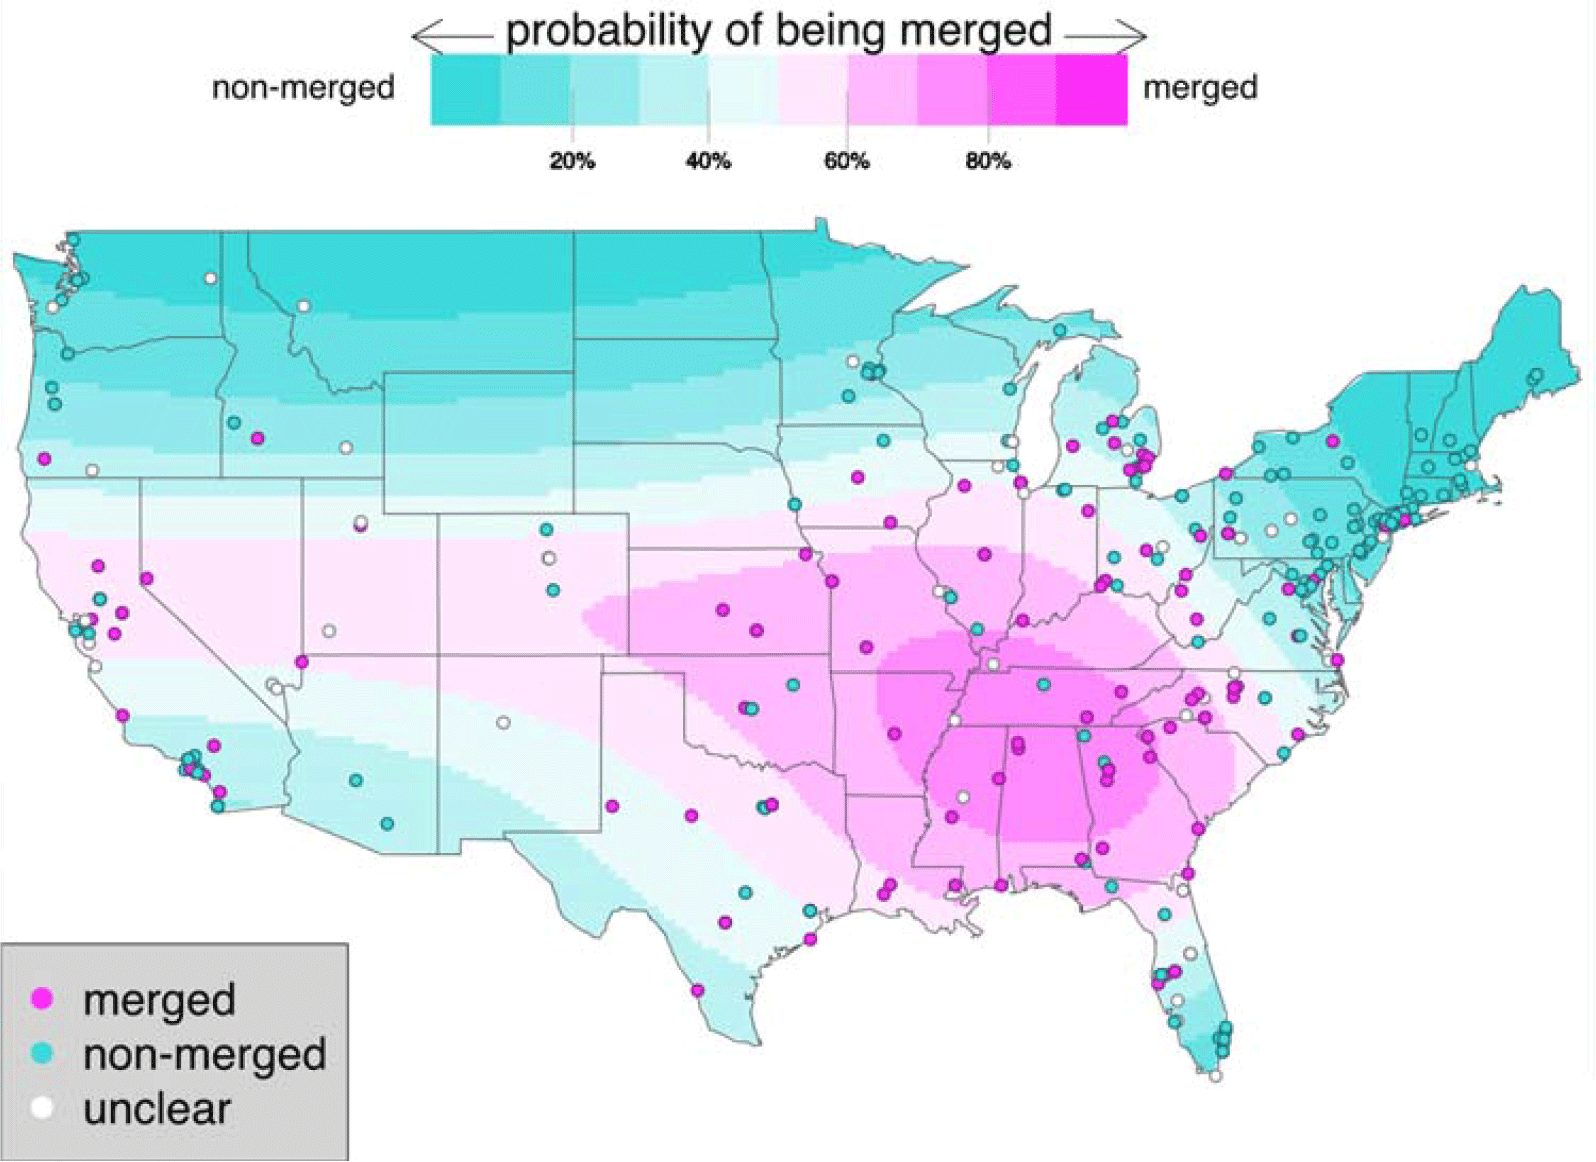
Map 2. Perception Data and Model Predictions. Background colors: model predictions of the likelihood of being merged in perception for a white speaker who has attended some college. Foreground dots: merger status in perception of actual participants.
5.4 Rhyming
In the rhyming task, it was expected that individual participants would either say that all of the pin-pen words rhymed, or that none of them did. However, this was not the case: 86 participants (23%) said that only some of these words rhymed (Figure 7); most of these participants (84%) were merged in either production or perception. As the instructions for the task simply asked “Do these words rhyme?”, participants may have been confused about for whom the words were supposed to rhyme, perhaps being aware that some speakers pronounce pin and pen differently. One participant commented that she didn’t hear any sound playing during this task, suggesting that she was expecting to listen to someone else’s productions of the words and then judge whether they rhymed. Participants may have also been unduly influenced by orthography, saying that some pin-pen words did not rhyme because they were spelled differently. Of the control rhyming pairs, 21% of participants incorrectly said that cow and tow rhyme, suggesting that orthography did play a large role in responses.
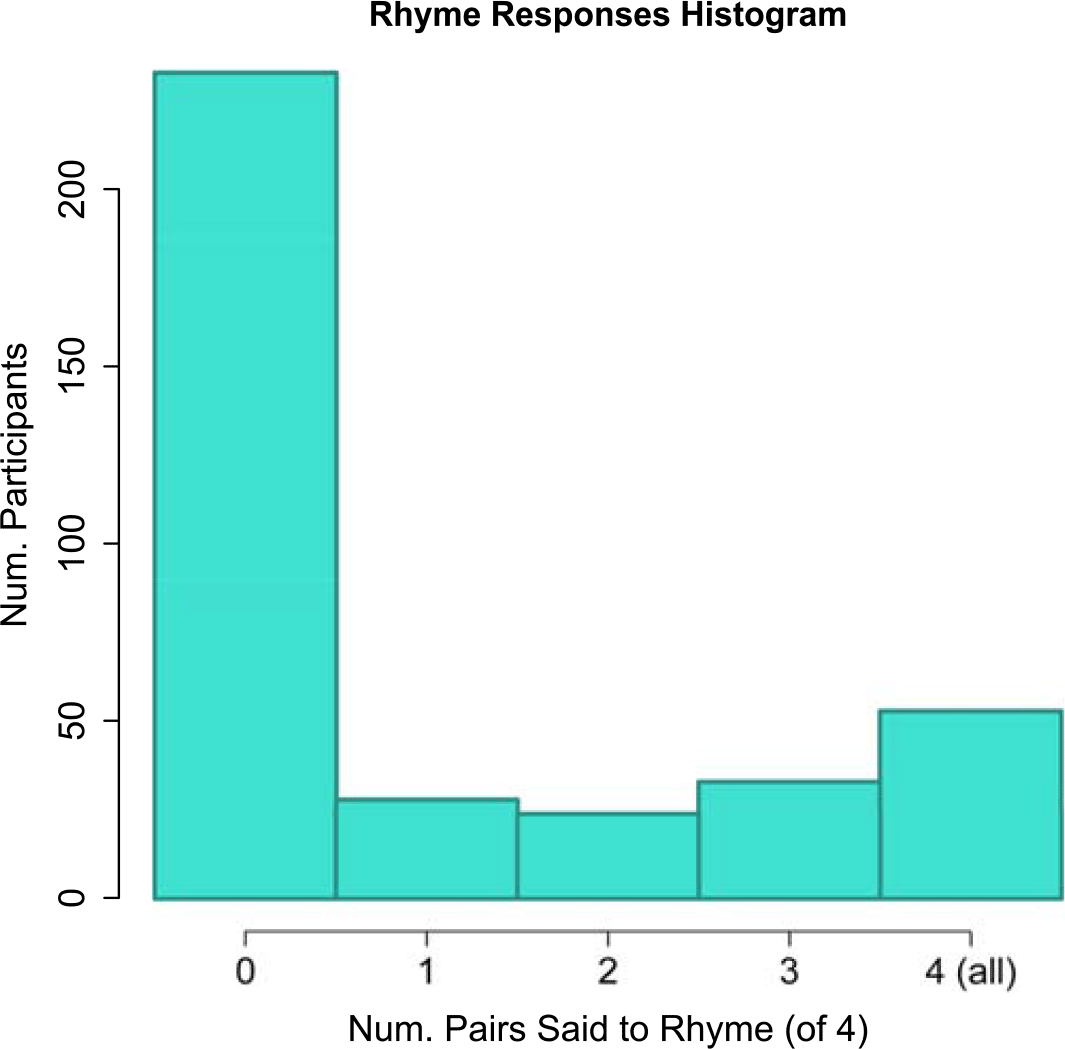
Figure 7. Responses to Rhyming Task. Histogram of the number of pin-pen pairs that a participant said rhymed.
Since participants did not respond to the task as expected, no further analysis of rhyming scores was undertaken.
5.5 Production versus perception
As noted earlier, production does not always equal perception. Previous research shows that speakers may be merged in perception but not in production (“near merger”). The converse phenomenon, merger in production but not in perception, is reportedly rare or nonexistent, and in sound change merger in perception is said to come before merger in production (Labov, Reference Labov2011:334). The present study’s results support this general finding: while 33 participants were merged in perception but not in production (i.e., near merged), only 6 were merged in production but not in perception.Footnote 5 (51 were merged in both production and perception. With Bhattacharyya’s affinity, 42 participants were merged in both production and perception, 30 were near merged, and 5 were merged in production but not perception.)
To examine which social factors predict near merger, two separate models were constructed: one comparing near merged participants to fully merged participants (excluding fully non-merged participants), and one comparing near merged participants to fully non-merged participants (excluding fully merged participants). As before, models were built using a step-up approach with latitude/longitude, age, gender, education level, and race/ethnicity as potential predictors. A smooth for latitude/longitude failed to improve upon either null model, so the models were built as generalized linear models rather than generalized additive models.
The model comparing near merged speakers to fully merged ones is given in Table 4, containing a significant predictor of gender. Men were more likely to be near merged than women (Wald z=-2.248, p=0.025) (Figure 8). (With Bhattacharyya’s affinity, gender was not significant, though still trending (p=0.090) in the same direction.)
Table 4. Near Merger Model.
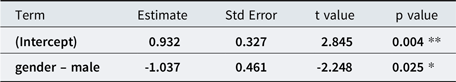
Logistic model predicting the likelihood of being fully merged (a positive value) versus near-merged (a negative value).
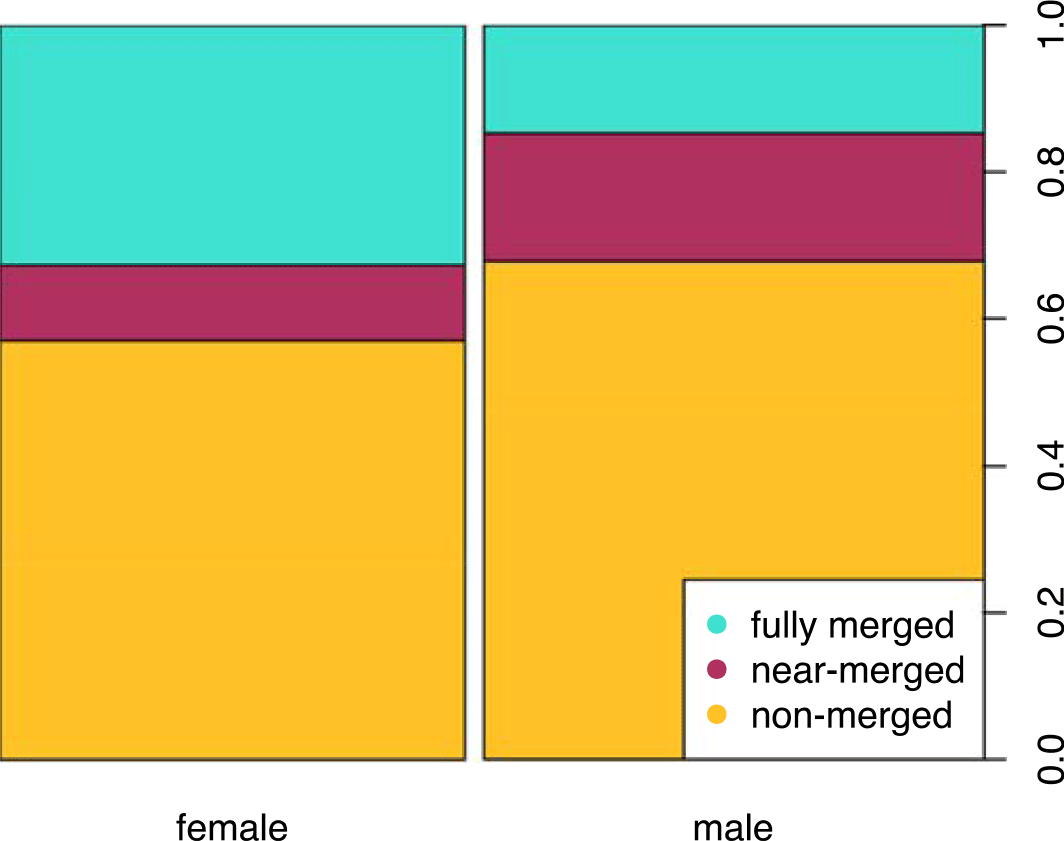
Figure 8. Merger Status by Gender. Proportion merger status by gender.
In comparing near merged speakers to fully non-merged ones, no factor significantly improved upon the null model based on Pillai score. With Bhattacharyya’s affinity, less educated speakers were more likely to be near merged.
6. Discussion and conclusion
This study’s findings with regards to production and perception of the pin-pen merger largely replicate previous results: in production, less educated speakers, Black speakers, older speakers, and speakers from smaller towns were most likely to be merged; in perception, less educated speakers and Black speakers were most likely to be merged. Across both production and perception, merged speakers were most highly concentrated in the South, but were also found in sizeable numbers in parts of the Midwest (Illinois, Indiana, Ohio, and especially southeastern Michigan) and in California. The presence of the merger in these regions is likely due to the influx of Southerners in the early to mid-20th century. Both Black and white Southerners (especially Appalachians) migrated in large numbers to California and Midwestern cities such as Chicago, Detroit, Indianapolis, and Columbus, Ohio (Alexander, Reference Alexander2006; Franklin, Reference Franklin2002; Johnson, Reference Johnson2006:33-35; Kirby, Reference Kirby1983; Tolnay, Reference Tolnay2003). (This period of migration also encompasses the well-known movement of the “Okies”—who were not just from Oklahoma, but also commonly from Texas, Arkansas, or Missouri—to California during the Dust Bowl in the 1930s (Kirby, Reference Kirby1983).) These migrants likely brought the pin-pen merger with them to their new homes; the merger may have persisted over time due to the continued isolation of migrants from the local white speakers. (Like African Americans and “Okies,” working-class white Southerners faced substantial discrimination, often living in so-called “hillbilly ghettoes” (Alexander, Reference Alexander2006; Anderson, Reference Anderson2008; Harkins, Reference Harkins2001; Johnson, Reference Johnson2006:16).) The merger may have become a marker of Southern identity, as Anderson (Reference Anderson2008) shows for /ay/ monophthongization among Black and white migrants to Detroit. In other places, the merger may have over time become associated with other locally relevant identity categories; for example, Geenberg (Reference Geenberg2014), finds that in Trinity County, California, use of the merger is best correlated not with Southern ancestry, but rather with speakers who partake in a survivalist, living-off-the-land lifestyle.
When examining the relationship between production and perception, this study found that near merger—merger in perception but not production—was roughly half as common as full merger (33 near merged versus 51 fully merged participants, 39% of all participants merged in perception). This is nearly double the proportion of near-merged speakers reported in Labov et al. Reference Labov2006, where only 21% of speakers who were merged in perception were near-merged. One possible reason for this discrepancy is the difference in tasks used to classify merger in perception. In Labov et al. (Reference Labov2006), participants were asked to judge whether the lexical items pin and pen sounded the same, with judgments about a further pair him and hem elicited only for participants who the researcher judged to produce pin and pen “close or the same”. In contrast, in this study participants were asked to classify a given token of pin/pen, bin/Ben, tin/ten, or mint/meant as a pin or pen word. Participants in the same-different judgment task used in Labov et al. (Reference Labov2006) may have been more influenced by explicit knowledge about which words are “supposed” to be pronounced differently, leading them to judge words as different even if they would not be able to perform 100% accurately in this study’s word identification task. The particular words pin and pen might be especially affected by conscious language ideologies, as the merged pronunciation of these words is often commented upon. It may be that speakers who are more likely to be near merged are also more likely to be aware of standard language ideologies around the pin-pen merger, and thus more likely to judge pin-pen as sounding differently, leading to a smaller percentage of apparent “near-merged” speakers. Alternatively, differences in the samples of the two studies may have led to these differences: Labov et al. (Reference Labov2006) attempted to survey as random a sample as possible, whereas the Mechanical-Turk-recruited participants in this study were on average more educated than the US population as a whole.
This study also found that men were more likely to be near-merged (as compared to being fully merged) than women, a finding that to the best of my knowledge has not been found for any other near merger, although most studies of near merger have not looked for such an effect. Given that women tend to lead changes in progress (Labov, Reference Labov2011), and that this study suggests that the merger is reversing itself (as younger speakers are less likely to be merged in production), this is surprising: if near-merger is a transitional stage between having full merger and full distinction, then we would expect more women to be near-merged than fully merged. However, it is not clear that near merger is in fact a transitional stage in the reversal of a merger: while perception tends to precede production in mergers in progress, leading to near merger, more research is needed to determine whether near-merger is also an intermediate stage in the reversal of a merger. If the merger is spreading in some places and reversing itself in others—as suggested by the contradictory findings in previous research about whether the merger is a change in progress—then this effect of men being more likely to be near-merged may be a reflection of men being slower to fully adopt a merger in those places where the merger is spreading. More data would be needed to test the prediction, but future studies focusing on individual communities may be able to explore this potential interaction between gender, changes in progress, and production versus perception.
An additional finding was that, contrary to expectations, almost all speakers who were merged in production were able to identify pin and pen words with higher-than-chance, but less than 100%, accuracy in the perception task. Similar results have been reported for other conditioned mergers (Thomas & Hay, Reference Thomas and Hay2005; Arnold, Reference Arnold2015), and, as Wade (Reference Wade2017) points out, in most perception tasks the cut-off for being counted as “merged in perception” is anything less than 100% accuracy, meaning that this phenomenon may be more widespread than commonly believed. These results suggest that merged speakers have some probabilistic knowledge about the way pin versus pen words are produced by non-merged speakers. A subject for future investigation is whether this knowledge comes from merged listeners storing non-merged speakers’ productions on a word-specific level, or from the merged speakers’ knowledge of their own productions of bit-bet words. That is, do listeners perform better than chance because they probabilistically know how non-merged speakers pronounce these words, or because they know how they (the merged speakers) produce /ɛ/ and /i/ in non-pre-nasal contexts and are able to judge whether a given token is closer to their non-pre-nasal /ɛ/ or /I/? An additional question for future research is to what extent orthography and conscious awareness of the merger affect performance on this perception task.
Finally, this study found that merger towards [ɛ] (tw[ɛ]n for twin) was equally as common as merger towards [i] (h[i]n for hen), contradicting the literature’s tendency to describe the merger as being towards [i]. There are several potential reasons for this contradiction: first, this study used acoustic measurements to determine merger directionality, whereas many previous studies relied on the ears of the researcher. It may be that merged tokens that are acoustically closer to a speaker’s bet vowel than to their bit vowel are still perceptually closer to /i/: that is, just because a token is acoustically similar to [ɛ] does not necessarily mean it is heard as [ɛ]. Secondly, as Bigham (Reference Bigham2005) posits, researchers may perceive merged tokens as [i]-like because of their beliefs about the pin-pen merger: since early research tended to describe the merger as being towards [i], this may be taken as a given by subsequent researchers and have affected their perception. This may be especially true for more intermediate tokens: if these tokens can be perceived equally well as [i] or [ɛ], believing that they should sound like [i] may lead researchers to perceive them as such. Lastly, the high proportion of merger towards [ɛ] could be a reflection of style-shifting. While merged speakers are likely to remain merged across styles, the quality of their merged vowel might shift according to context. In Austen (Reference Austen2017), I found that merged listeners perceived the merger towards [ɛ] as prestigious, such that they heard tw[ɛ]n as more prestigious than tw[i]n. Thus, it could be that merged speakers shift to [ɛ] in more formal contexts, such as the wordlist-reading task used in this experiment. In less formal contexts, like conversational speech upon which many previous researchers based their observations, these speakers could shift to more [i]-like pronunciations.
Overall, this study suggests that dialectology would do well to consider the relationship between production and perception. Examining phenomena such as near mergers may help us to understand how sound changes like mergers spread across social and geographic space. The pin-pen merger appears to be a particularly useful merger to study: if, as this study taken in combination with previous research suggests, it is expanding in some areas and receding in others, then we can simultaneously observe the spread and reversal of a merger. Further study of this merger can offer new insights into the interaction between dialect regions, sound change, and the production-perception interface.