Introduction
Functional endoscopic sinus surgery was first introduced in the 1970s. This surgical modality has significantly improved the management of osteomeatal complex obstruction and drainage problems involving the paranasal sinuses, and has increased the first-operation cure rate for chronic rhinosinusitis to approximately 90 per cent.Reference Osguthorpe1
During such surgery, the uncinate process may be excised in order to open the osteomeatal complex, but this can be associated with damage to the structures of the lateral nasal cavity wall. The uncinate process is located at the most anterior point of the middle meatus, with the ethmoid sinus, maxillary sinus and frontal sinus openings all concealed behind it. The uncinate process and the three turbinates on the lateral wall of the nasal cavity are important structures in the structural defence system of the nasal cavity and paranasal sinuses. The end-portion of a well developed uncinate process just covers the maxillary sinus opening and prevents airflow from directly entering the maxillary sinus during steady breathing.
In order to determine the importance of the uncinate process for nasal airflow, we conducted computational fluid dynamic studies by opening the paranasal sinuses in different ways on two sides of the same cadaver head model. Our aim was to study the influence of the uncinate process on nasal airflow after opening the paranasal sinuses in a single cadaver head. Removal of the uncinate process was found to significantly affect the structural and functional integrity of the nasal cavity, as demonstrated by structural comparisons and analysis of computational fluid dynamic simulations conducted before and after surgical intervention.Reference Xiong, Zhan, Zuo, Li, Rong and Xu2 The observed post-intervention changes in airflow dynamics within the nasal cavity and paranasal sinusesReference Xiong, Zhan, Zuo, Li, Rong and Xu2, Reference Xiong, Zhan, Li, Rong and Xu3 may help explain the recurrence of sinus symptoms in some patients.Reference Palmer and Kennedy4–Reference Xu9
Materials and methods
Nasal cavity processing
Prior to the study, signed consent forms were obtained from family members of the deceased.
Nasal cavity computed tomography (CT) scanning was performed on cadavers which had been stored at a low temperature. An Radiology expert examined the images and selected a cadaver head with normal, bilaterally symmetrical nasal cavity structures (Figure 1a).

Fig. 1 Computed tomography (CT) scans and numerical reconstruction models of nasal cavity and paranasal sinus before and after intervention. (a) Coronal CT scan showing pre-intervention uncinate process morphology. (b) Coronal CT scan showing post-intervention morphology, including right uncinate process excision. (c) Frontal view of numerical reconstruction of nasal cavity and paranasal sinus airflow, pre-intervention. (d) & (e) Lateral views of numerical reconstructions of nasal cavity and paranasal sinus airflow, pre- and post-intervention, respectively.
Both interventions were performed on the same cadaver head according to standard surgical procedures. The right nasal cavity procedure consisted of excision of the uncinate process and ethmoid sinus, followed by opening of the other paranasal sinuses on the right side of the cadaver head. The left nasal cavity procedure spared the uncinate process, removed the ethmoid sinus and opened the other paranasal sinuses on the left side of the cadaver head (Figure 1b).
Three-dimensional reconstruction of nasal cavity
The frozen cadaver head was allowed to thaw at room temperature (approximately 28°C) for 12 hours. Pre- and post-intervention imaging data for the nasal cavity and paranasal sinuses were obtained using a 64-slice high speed spiral CT scanner (Toshiba, Tokyo, Japan). The slice thickness was 0.4 mm and bone windows were used. Level cross-sectional CT images were entered into the Mimics 10 boundary extraction software program (Materialise, Leuven, Belgium) and a smooth nasal cavity airflow field boundary surface was obtained. Points were selected from this boundary surface, and the point coordinates were used as basic data in the construction of a Fluent 6.1.22 numerical model (Fluent, Lebanon, New Hampshire, USA). The Gambit software program (incorporated into the Fluent software) was used to construct pre- and post-intervention nasal cavity models (Figure 1).
Mesh
The models were constructed using tetrahedral mesh as previously outlined. Mesh partitioning was dependent on the flow change in different areas. The meshes were not identical. A total of 1,400,000 meshes were used for our study model construction.
Boundary arrangement and conditions
The inferior border of the nasopharynx was used as the entry point, with the flow rate set at 353 ml/s.Reference Osguthorpe1 However, Fluent calculations revealed that the actual model flow rate was 335.97 ml/s. The rate of flow was affected by the angle between the flow direction and the plane of entry. The lower flow rate was used in the calculations to provide more objective results. The anterior naris was used as the exit point, and the pressure was set at one atmosphere (101 325 Pa). The other nasal cavity boundaries were fixed boundaries, and all were assumed to be slip-free.
Numerical simulation
Navier–Stokes equations for incompressible viscous fluids were used as the control equations. Lamellar flow modelling was used to calculate airflow field characteristics in the nasal cavities and paranasal sinuses during inspiration and expiration. The continuity and momentum equations were solved simultaneously. The solution was derived using the Semi-Implicit Pressure Linked Equation scheme, which involves a pressure–velocity coupling, second order upwind of convective term discretisation, and use of a segregated solver. Steady-state solutions were obtained by imposing boundary conditions on the inlet velocity of the flow and pressure outlet boundary conditions adapted at the outlet boundary. The convergence criterion was that residuals for all variables must decrease from 10 to 4. For validation, a local mesh refinement at the open end of the maxillary sinus was created. The relative error was approximately 4.2 per cent for the mass flow rate at this location.
Section plane
Four section planes (designated one to four) were designated in order to analyse airflow velocity changes within the middle meatus. The four section planes represented the following locations: the origin, the midpoint, the mid-posterior and the endpoint of the middle meatus.
Four 7.7 mm cross-sections were constructed sequentially and arranged parallel to the direction of airflow, allowing the four section planes to be approximately perpendicular to the direction of airflow while also being perpendicular to the X = 7.7 mm plane. Changes in airflow field parameters, such as mean airflow velocity and maximum airflow velocity, were calculated for the four section planes before and after intervention.
Results
Effect of uncinate process on nasal cavity airflow velocity
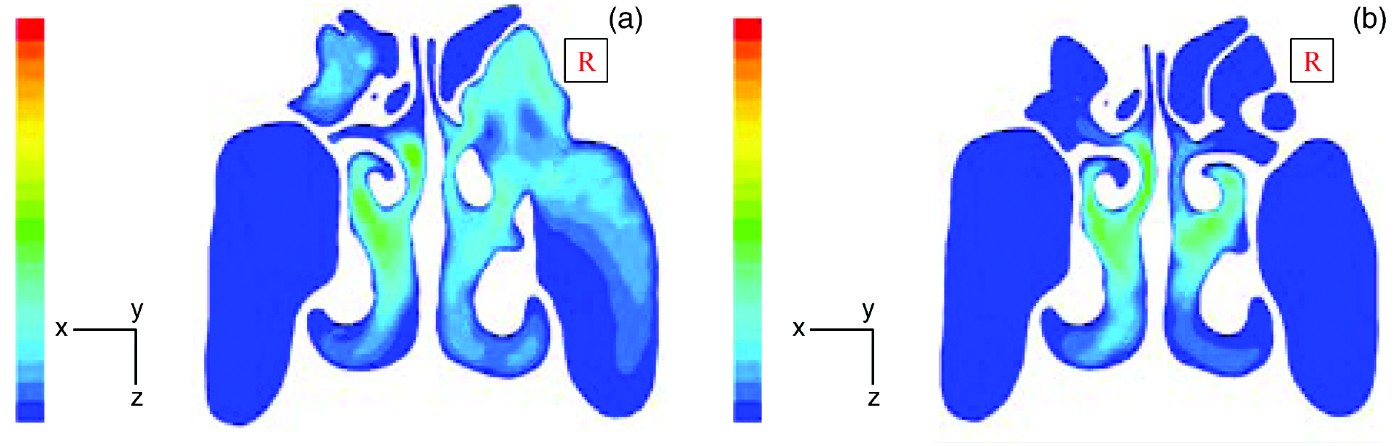
Differences between the nasal cavity airflow velocities of the left nasal cavity (uncinate process preserved) and right nasal cavity (uncinate process excised), both before and after intervention, can be seen from the velocity vector profile at section plane three, shown in Figure 2a (before intervention) and Figure 2b (after intervention).

Fig. 2 Airflow velocity vector profiles for section plane three (the mid-posterior portion of the middle meatus) of the nasal cavity, (b) before and (a) after intervention. The colour scale from blue to red indicates airflow velocity from 0–10−4 m/s.
Before the intervention procedure, the airflow velocity was essentially identical on the left and right sides (Figure 2a). Airflow velocity was greatest in the common meatus, followed by the middle meatus and the inferior meatus. Airflow velocity was least in the superior meatus. There was little or no airflow exchange in the paranasal sinus regions.
Figure 2b shows airflow velocities after the intervention procedure. There were no significant changes in pre-intervention versus post-intervention airflow velocity in the nasal vestibule, limen nasi, common meatus, inferior meatus or nasopharynx. In contrast, marked airflow velocity changes were apparent in the middle meatus, superior meatus, ethmoid sinus and maxillary sinus. Pre-intervention versus post-intervention airflow velocity changes were significantly greater in the right nasal cavity compared with the left nasal cavity. Airflow velocity distributions for the paranasal sinus openings, at the midpoint section plane, are detailed in Table I and shown in Figures 3 and 4.
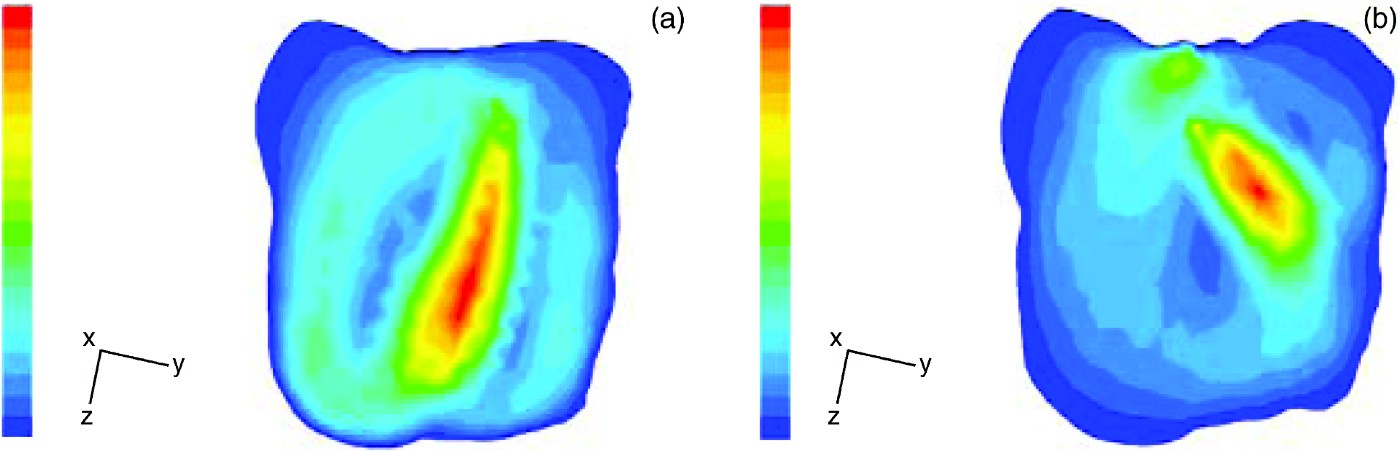
Fig. 3 Airflow velocity vector profiles for the left maxillary sinus midpoint cross-section (Z = 22.1 mm) (b) before and (a) after intervention. The colour scale from blue to red indicates airflow velocity from 0–10−4 m/s.

Fig. 4 Airflow velocity profiles for the right maxillary sinus midpoint cross-section (Z = −24.0 mm) (b) before and (a) after intervention. The colour scale from blue to red indicates airflow velocity from 0–10−4 m/s.
Table I Paranasal sinus opening cross-sectional airflow data before and after interventions*

* Assuming constant inspiration of 334.97 ml/s. ![]() = mean airflow velocity; Vmax=maximum airflow velocity;
= mean airflow velocity; Vmax=maximum airflow velocity; ![]() = mean pressure; vol = volume; L = left; R = right; max = maxillary; unc proc = uncinate process; pre = pre-intervention; post = post-intervention
= mean pressure; vol = volume; L = left; R = right; max = maxillary; unc proc = uncinate process; pre = pre-intervention; post = post-intervention
Table II shows the airflow velocity comparisons for the middle meatus section planes, following the two different intervention procedures. The middle meatus origin mean airflow velocity and maximum airflow velocity increased after both procedures. Increases on the left side (uncinate process preserved) were more pronounced than on the right side (uncinate process excised). After the intervention, the mean airflow velocity and maximum airflow velocity decreased in most regions (i.e. the middle meatus midpoint (both sides), mid-posterior (both sides) and endpoint (left side)) but increased at the middle meatus origin (both sides) and the middle meatus endpoint (right side).
Table II Pre- and post-intervention airflow data for the four middle meatus section planes

*Origin; †midpoint; ‡mid-posterior; **endpoint. §Uncinate process excised. ![]() = mean airflow velocity; Vmax = maximum airflow velocity; pre = pre-intervention; post = post-intervention
= mean airflow velocity; Vmax = maximum airflow velocity; pre = pre-intervention; post = post-intervention
Uncinate process regional airflow velocity pre- and post-intervention
Left paranasal sinus
On the left side (where the uncinate process was preserved), the pre-intervention airflow velocity around the lateral aspect of the uncinate process was 0–0.196 m/s, while that around the medial aspect was 1.956–2.152 m/s. After intervention, the airflow velocity around the lateral aspect of the uncinate process was unchanged, while the airflow velocity around the medial aspect decreased to 1.340–1.531 m/s. The uncinate process seemed to function as a barrier, slowing airflow into the maxillary sinus (Figure 5a).
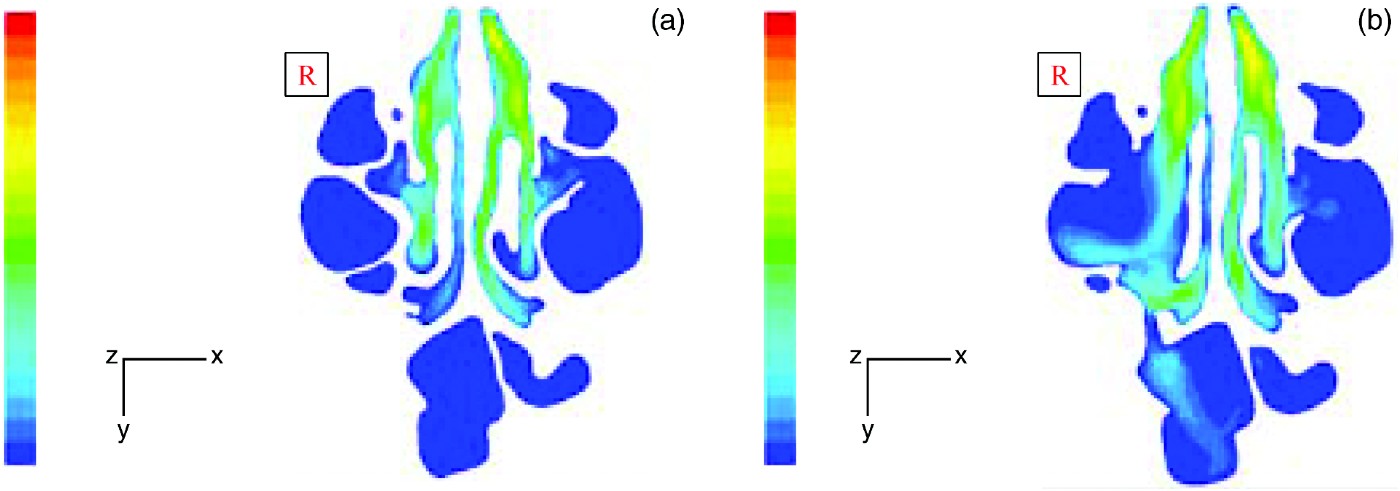
Fig. 5 Airflow velocity profiles for the whole nasal cavity uncinate process region, (a) before (Z = 0.56 mm) and (b) after (Z = −524 mm) intervention. The colour scale from blue to red indicates airflow velocity from 0–10−4 m/s.
Right paranasal sinus
On the right side (where the uncinate process was excised), the pre-intervention airflow velocity around the lateral aspect of the uncinate process was 0–0.131 m/s, while the airflow velocity around the medial aspect was 1.574–1.705 m/s. Following the intervention procedure, the airflow velocity in the region corresponding to the uncinate process was 0.576–0.720 m/s. Excision of the uncinate process exposed the maxillary sinus, allowing some air to flow through the middle meatus to directly impact on the posterior maxillary sinus.
Effect of uncinate process on airflow
Nasal cavity airflow parameters
After the intervention in the right nasal cavity (including uncinate process excision), the superior meatus and middle meatus communicated with the ethmoid sinus and maxillary sinus such that they could no longer be physically distinguished. Therefore, for the right nasal cavity, only the common meatus and inferior meatus airflow volumes were recorded (as percentages of the total cross-sectional airflow volume).
Table III summarises the post-intervention airflow volumes within the major conduits of the left and right nasal cavities. Before the intervention procedure, airflow in the left and right nasal cavities was mainly through the common and middle meatus, with a preference for the common meatus. After the intervention, airflow volumes in the major conduits of the left nasal cavity model were similar to pre-intervention values. However, post-intervention airflow volumes for the right nasal cavity differed: the common meatus airflow volume decreased by 12 per cent; the inferior meatus flow volume increased by 5.4 per cent; and the surgically opened ethmoid sinus conducted approximately 6.6 per cent of the airflow volume.
Table III Pre- and post-intervention airflow volume for major conduits of left and right nasal cavities*

* At section plane 3. †Uncinate process excised. ‡After intervention, the middle meatus included the exposed ethmoid sinus region. L = left; R = right; vol = volume; pre = pre-intervention; post = post-intervention
Paranasal sinus airflow parameters
We assessed pre- and post-intervention airflow parameters (including cross-sectional area, mean airflow velocity, maximum airflow velocity and mean pressure) for the paranasal sinus openings, assuming constant inspiratory conditions (Table I). As the maxillary sinus airflow was the parameter most affected by both the left nasal cavity and right nasal cavity intervention procedures, further calculations were performed for the maxillary sinus midpoint cross-sections (Figures 6 and 7). The effects of the two different surgical interventions on paranasal sinus airflow fields and exchanged airflow volumes were then analysed.

Fig. 6 Airflow velocity profiles for the left maxillary sinus opening cross-section (a) before and (b) after intervention. The colour scale from blue to red indicates airflow velocity from 0–10−4 m/s.
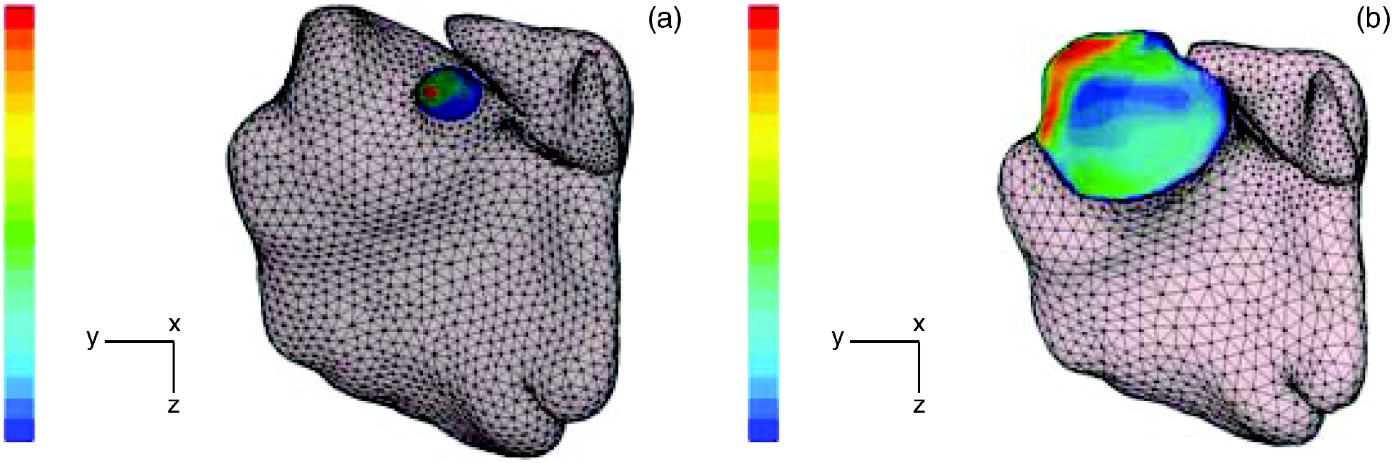
Fig. 7 Airflow velocity profiles for the right maxillary sinus opening cross-section (a) before and (b) after intervention. The colour scale from blue to red indicates airflow velocity from 0–10−4 m/s.
Before the intervention, the airflow velocities in all non-maxillary paranasal sinuses were extremely low on both the right and left sides; the opening airflow velocity in the maxillary sinus was larger (Table I). After the intervention, airflow velocities at all the paranasal sinus openings of right nasal cavity were significantly increased compared with pre-intervention values. After the intervention, the right nasal cavity paranasal sinus airflow velocities and pressures were higher than those in the left nasal cavity; the airflow velocity was highest in the right maxillary sinus, while the pressure differences were greatest at the maxillary sinus opening cross-section and the midpoint cross-section (Figure 4).
Prior to the intervention procedure, the airflow volume of the maxillary sinus was two to five orders of magnitude greater than that of the sphenoid and frontal sinuses (where airflow volumes were nearly zero). Before intervention, paranasal sinus airflow volumes differed between the right and left nasal cavities; however, airflow volume was directly proportional to sinus opening cross-sectional area. After intervention, paranasal sinus airflow volumes were increased, compared with pre-intervention volumes, in both the right and left paranasal sinuses, but more so on the right. Post-intervention, the greatest paranasal sinus airflow entry was found at the right maxillary sinus opening (38.042 ml/s).
Discussion
The lateral nasal cavity wall features three longitudinal, scroll-shaped elevations called conchae or turbinates. These turbinates help divide the nasal cavity space into four major conduits: the superior, middle, inferior and common meatuses. Findings from the current study, supported by those of Croce et al. Reference Croce, Fodil, Durand, Sbirlea-Apiou, Caillibotte and Papon10 and Kim et al.,Reference Kim, Yoon, Kim, Nam, Shim and Shin11 demonstrate that during steady inspiration the proportion of total nasal cavity airflow passing through each of these four major conduits is relatively constant. The anatomical arrangement of the uncinate process and the turbinates facilitates distribution of nasal cavity airflow, enabling better thermoregulation, humidification and filtering.Reference Yildirim, Oh, Erdem and Kunt6 This system also stabilises intra- and extra-sinus pressure. The combined effect is a theoretical reduction in the risk of paranasal sinus damage by such pathogenic factors as bacteria, viruses, contaminant particles and allergens.
This study is the first to use computational fluid dynamics to analyse airflow velocities at the medial and lateral aspects of the uncinate process. Initially, both nasal cavities demonstrated significant differences between the medial and lateral uncinate process airflow velocities. It was assumed that preserving the uncinate process would result in more normal post-intervention nasal cavity airflow dynamics and physiological characteristics, compared with a nasal cavity in which the uncinate process had been excised.
Computational fluid dynamics were determined using measurements of nasal cavity maximum airflow velocity and airflow distribution within each major nasal cavity conduit, as well as airflow volumes and velocities in the paranasal sinuses. Analysis of nasal cavity medial and lateral uncinate process airflow velocities after the uncinate process preserving intervention revealed that, although the medial uncinate process airflow velocity decreased, it was maintained close to the initial rate of 1.340–1.531 m/s, while the lateral airflow velocity did not change significantly. The mediolateral uncinate process velocity gradient remained large, and the preserved uncinate process still retained its important barrier function after intervention.
This study has several limitations. The cadaver specimen was chosen after careful examination to ensure there were no inherent abnormalities affecting the nasal cavities. The absence of pathology in the studied specimen permits only careful extrapolation of data to the general public. Furthermore, the utilisation of a cadaver head may not adequately simulate the true physiological state present in a living individual, or allow for biological functions which would affect airflow (e.g. swallowing). In a living patient, a comparable surgical intervention would also cause damage to the nasal mucosa (e.g. bleeding and inflammation) which could adversely influence airflow.
• Chronic rhinosinusitis is commonly treated by functional endoscopic sinus surgery (FESS) involving excision of the uncinate process and opening of the osteomeatal complex
• This study used computational fluid dynamics to assess the effect of uncinate process preservation and excision on nasal airflow, following FESS
• Significantly larger nasal cavity airflow velocity changes were apparent following the uncinate process excising procedure, compared with the uncinate process preserving procedure; however, nasal cavity airflow distribution remained relatively unchanged
• The uncinate process plays a part in normal nasal airflow dynamics, and its preservation may be beneficial
Despite these limitations, the use of computational fluid dynamic simulation offers exciting possibilities for the ongoing assessment of nasal airflow dynamics. The uncinate process is an anatomical structure which exhibits great morphological variation in the general population, and this variance may correlate with the risk of chronic rhinosinusitis.Reference Isobe, Murakami and Kataura12 We recently found that excision of the uncinate process alone (sparing other osteomeatal complex structures) had insignificant effects on maxillary sinus airflow. However, the general surgical procedure used to remove the uncinate process, which also involves excision of the osteomeatal complex to create a large cavity, has a more pronounced effect13. This suggests that the effects of the uncinate process on nasal cavity and paranasal sinus airflow dynamics may be intimately related to other osteomeatal complex components; this proposal warrants further investigation.
In the current study, computational fluid dynamics were used to assess the effect of the uncinate process on nasal cavity and paranasal sinus airflow, utilising uncinate process excising and uncinate process preserving interventions. Nasal cavity airflow distribution remained relatively unchanged following the uncinate process preserving intervention, compared with the uncinate process excising intervention. A significantly greater airflow volume increase was found in the paranasal sinuses following the uncinate process excising intervention, compared with the uncinate process preserving intervention. These findings suggest that, in some conditions, the preservation of the uncinate process may play an important role in the maintenance of normal nasal cavity airflow dynamics. Our findings also imply that preservation of the uncinate process may represent an improvement in the traditional paranasal sinus opening surgical procedure, as it would enable improved nasal cavity airflow while still maintaining normal nasal cavity airflow dynamics.
Acknowledgement
This study was supported by the Natural Science Foundation of Guangdong Province (8151008901000205).