


Introduction
Nasal obstruction when lying down and during sleep is a common complaint in patients seeking medical attention for chronic nasal obstruction.Reference Shedden1 Nasal obstruction during sleep is associated with impaired quality of sleep and impaired health-related quality of life.Reference Young, Finn and Kim2 Studies show that nasal obstruction is not a significant cause of obstructive sleep apnoea syndrome (OSAS), but it can augment airway collapse when lying down and thus contribute to poor sleep.Reference Virkkula, Maasilta, Hytonen, Salmi and Malmberg3 Postural changes in nasal airway resistance and intranasal geometry have been studied using both rhinomanometry and acoustic rhinometry. In normal subjects without nasal disease, there is an increase in nasal airway resistance and a reduction in the intranasal cross-sectional area when lying down.Reference Fouke and Jackson4–Reference Hellgren, Yee, Dungan and Grunstein6 This is probably the effect of the active regulation of nasal mucosal swellingReference Hellgren, Yee, Dungan and Grunstein6–Reference Ko, Kuo and Lee10 mediated by activation of pressure-sensitive receptors in the skin, causing the modulation of the sympathetic tone of the nasal mucosa.Reference Riechelmann and Krause11,Reference Davies and Eccles12 Increased sympathetic tone increases the intranasal cross-sectional area and reduces nasal airway resistance and vice versa. Inflammation of the nasal mucosa, as with rhinitis, has been shown to alter this regulation, but the results are contradictory.Reference Rundcrantz13,Reference Altissimi, Gallucci, Rossetti and Simoncelli14
Active anterior rhinomanometry is used in research and in the clinic to assess nasal airflow resistance and is regarded as the ‘gold standard’.Reference Clement, Gordts and Standardisation15 There are no generally accepted normal values for rhinomanometry, but the American Thoracic Society has suggested a total nasal airway resistance (left and right side) of less than or equal to 0.3 Pa/cm3/second as normal, based on several studies.Reference Chaaban and Corey16 Rhinomanometry measures one nostril at a time and is typically performed in a sitting, upright position. For this reason, changes in nasal airway resistance that may occur when lying down are not usually measured. Measuring rhinomanometry when lying down could be technically challenging and could prove irrelevant in relation to symptoms and nasal disease, but, at the same time, it has the potential to add valuable information about nasal airflow when supine.
In patients with OSAS, rhinomanometry has been studied in the supine position and has been suggested to be useful when predicting the impact of structural nasal modifications on the positive pressure of nasal continuous positive airway pressure treatment.Reference Hueto, Santaolalla, Sanchez-Del-Rey and Martinez-Ibarguen17,Reference Toh, Lin and Guilleminault18 In patients with chronic nasal obstruction, which is far more common than OSAS in the population, only a few studies have examined the use of rhinomanometry when supine. In one study of 47 subjects assessed with rhinomanometry while sitting and supine, there was a positive correlation between higher total nasal airway resistance when supine and subjective symptoms of nocturnal nasal obstruction.Reference Stroud, Wright and Calhoun19 Another study of patients with rhinitis found an 80 per cent increase in total nasal airway resistance when going from sitting to supine, indicating that this measurement mode could be useful in chronic rhinitis patients.Reference Altissimi, Gallucci, Rossetti and Simoncelli14 However, both these studies were performed with rhinomanometry alone, without controlling for geometric changes in nasal mucosal swelling and in patients with a mean total nasal airway resistance of less than 0.3 Pa/cm3/second. The aim of the present study was to assess the usefulness of measuring rhinomanometry when supine in patients with chronic nasal obstruction, controlling for changes in intranasal geometry assessed with acoustic rhinometry.
Materials and methods
This is a cross-sectional study of a consecutive group of adult patients with chronic nasal obstruction who were referred to the Department of Otolaryngology at Sahlgrenska University Hospital, which is a tertiary referral otolaryngology clinic. All the patients came from the waiting list for rhinomanometry, a mandatory procedure performed prior to the doctor's visit at the clinic.
Study subjects
Eligible patients were aged from 18 to 60 years old and had been referred for a second opinion regarding therapy-resistant (already treated with nasal steroids and still symptomatic) chronic nasal obstruction. They were also able to understand written and spoken Swedish. Patients with severe septal deviation, nasal deformity, nasal polyps, nasal malignancies or previous nasal surgery were excluded. The patients were contacted by phone and informed about the study. Patients who agreed to participate were invited to a clinical visit where they received further spoken and written information about the study and signed an informed consent form. A total of 50 subjects were invited to participate in the study. Eight subjects declined to participate and 42 agreed. One subject was then excluded at the clinical visit because of previous nasal surgery. As a result, 41 subjects were included in the study.
At the clinical visit, all the subjects were asked to fill in a questionnaire on nasal symptoms, sleep-related symptoms, asthma and smoking habits. Chronic rhinosinusitis was defined according to the criteria set by the European Position Paper on Rhinosinusitis and Nasal Polyposis (2012).Reference Fokkens, Lund, Mullol, Bachert, Alobid and Baroody20
All the patients were examined using anterior rhinoscopy, before and after the decongestion of the nasal mucosa with two sprays of oxymetazoline (Nezeril®) in each nostril (Figure 1). Nasal status including mucosal swelling, mucosal reddening, septal deviation and nasal polyps was recorded. If nasal polyps or a severe septal deviation was present, the patient was excluded.

Fig. 1. Study protocol. After anterior rhinoscopy, each subject underwent rhinomanometry and acoustic rhinometry, sitting and supine, before and after decongestion in the outlined order.
Rhinomanometry
Nasal airflow resistance was measured (Pa/cm3/second) with active anterior rhinomanometry (Rhino-Comp®) in the sitting position and after 10 minutes supine. A pressure-sensitive probe was attached to one nostril with an adhesive sealing tape, while nasal airflow was measured through the other with an airtight mask over the nose and mouth. The total nasal airway resistance was the primary parameter used in this study.
Acoustic rhinometry
Intranasal geometry was measured with acoustic rhinometry (Rhinoscan®). The minimal cross-sectional area and volume were measured sitting and after 10 minutes supine at 0–2.22 cm from the nostril. A probe connected to a piezoelectric crystal is held against the nostril, sending acoustic sound waves into the nasal cavity. The echo is recorded and converted into a two-dimensional image of the intranasal geometry.Reference Clement, Gordts and Standardisation15 The mean of five concordant curves was used in the analyses of the total minimal cross-sectional area of the left and right side and the volume of the left and right side.
In the second step, the nose was decongested with two sprays of 0.5 mg/ml of oxymetazoline (Nezeril) in each nostril. After 10 minutes, the entire cycle of rhinomanometry and acoustic rhinometry sitting and supine was repeated, according to the protocol above.
All the data were collected by two different trained examiners who followed the examination protocol but were blinded to the cut-off of 0.3 Pa/cm3/second used in the following analyses.
A Phadiatop® test, including mugwort, timothy grass, birch, Dermatophagoides pteronyssinus, mould, cat, dog and horse dander, was analysed. Subjects who had undergone a Phadiatop test in the past two years were not tested again, but existing data were used.
Polygraphy
All the subjects underwent an overnight sleep study in their homes using an ambulatory NOX T3 sleep monitor (NoxMedical®). Instructions, both verbal and written, on how to use the device were given. The NOX T3 sleep monitor was fixed to the chest with a thoracic belt and connected to an abdominal belt and a nasal cannula. A device fitted to the wrist was connected to a pulse oximeter. The sleep monitor collects data on thoracic and abdominal respiratory movements, nasal airflow and body position, and pulse and oxygen saturation. Snoring sounds were recorded by a microphone in the sleep monitor. Upon returning the NOX T3, the data were downloaded onto a computer and analysed manually by a single trained researcher. The analysed items included the number of apnoea, hypopnea and oxygen desaturation events, as well as snoring frequency.
The following definitions were used. Apnoea was defined as more than 90 per cent reduction in airflow for 10 or more seconds. Hypopnea was defined as 30–90 per cent reduction in airflow during sleep for 10 or more seconds combined with a 3 or more per cent oxygen desaturation. Oxygen desaturation was defined as a desaturation of 3 or more per cent. Indices were derived by dividing the number of events, such as apnoea-hypopnea index, apnoea index, hypopnea index and oxygen desaturation index, by the number of hours of sleep. The severity of obstructive sleep apnoea (OSA) was defined by an apnoea-hypopnea index of: less than 5 = none; 5–14 = mild; 15–29 = moderate; and 30 or greater = severe OSA. Subjects who had previously undergone a sleep study during the past two years were not measured again, but existing data were used.
This study was approved by the Local Ethics Committee in Gothenburg (approval number: 603–17).
Statistical analyses
Statistical analyses were performed using SPSS® (version 25) statistical software. Based on the total nasal airway resistance when sitting before decongestion, the study population was divided into two different groups: (1) a normal nasal airway resistance group, with total nasal airway resistance equal to or less than 0.3 Pa/cm3/second; and (2) an increased nasal airway resistance group, with total nasal airway resistance more than 0.3 Pa/cm3/second. The non-parametric analysis Wilcoxon signed rank test was performed to compare groups. A p-value (two-tailed) of less than 0.05 was considered significant.
Results
Out of the patients, 29 had a total nasal airway resistance of less than or equal to 0.3 Pa/cm3/second and were defined as having normal nasal airway resistance. Twelve patients had a total nasal airway resistance of more than 0.3 Pa/cm3/second and were defined as having increased nasal airway resistance. Patient characteristics are presented in Table 1. No subjects in the increased nasal airway resistance group were able to undergo rhinomanometry when supine before decongestion because of non-measurable nasal airflow. After decongestion, 58 per cent were able to undergo rhinomanometry when supine. Of the subjects in the normal nasal airway resistance group, 48 per cent were able to undergo rhinomanometry when supine before decongestion, and 83 per cent were able to undergo rhinomanometry after decongestion. Sleep-related symptoms and data from the NOX T3 sleep study are shown in Table 2. More than 80 per cent of patients in the increased nasal airway resistance group had a normal apnoea-hypopnea index of less than 5. There were no statistically significant differences between the normal nasal airway resistance and the increased nasal airway resistance patients with regard to age, gender, body mass index, allergy, asthma or sleep parameters.
Table 1. Baseline data for the study population based on the answers to the respiratory questionnaire
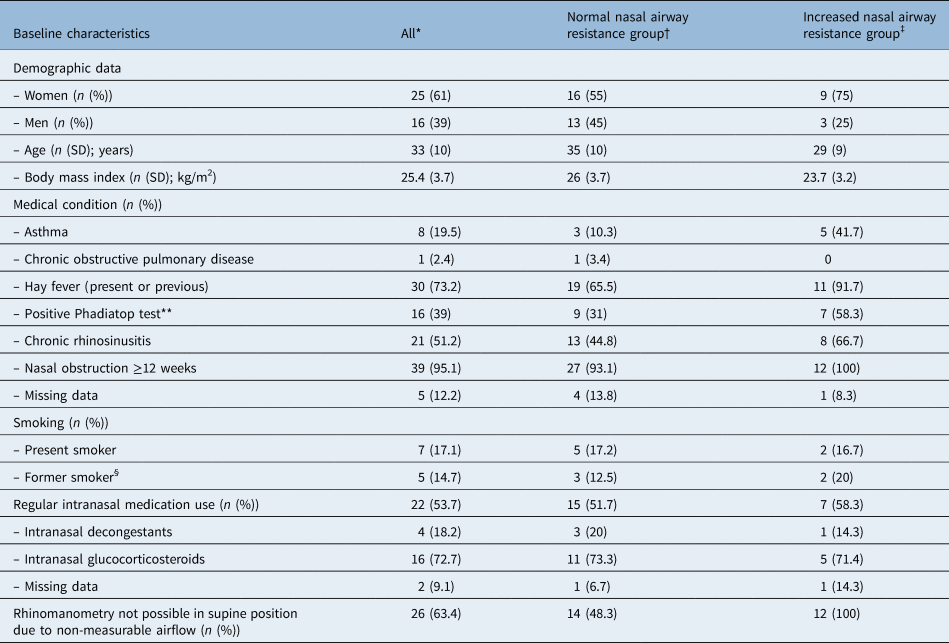
Normal nasal airway resistance is defined as equal to or less than 0.3 Pa/cm3/second in sitting position before decongestion. Increased nasal airway resistance is defined as more than 0.3 Pa/cm3/second in sitting position before decongestion. Numbers are based on answers marked ‘yes’ in questionnaire. *n = 41; †n = 29; ‡n = 12; **data obtained from blood sample; §numbers are based on those who are not present smokers. SD = standard deviation
Table 2. Sleep symptoms obtained from the respiratory questionnaire, as well as sleep data from the overnight polygraphy

Numbers on self-reported symptoms are based on answers marked ‘yes’ in questionnaire. Normal nasal airway resistance is defined as equal to or less than 0.3 Pa/cm3/second in sitting position before decongestion. Increased nasal airway resistance is defined as more than 0.3 Pa/cm3/second in sitting position before decongestion. *n = 41; †n = 29; ‡n = 12; **data from an overnight sleep study with NOX T3 sleep monitor. SD = standard deviation
Rhinomanometry data show the gender stratification in Table 3. Table 4 shows the data for the increased nasal airway resistance and normal nasal airway resistance groups. The mean total nasal airway resistance was more than 0.3 Pa/cm3/second when sitting and before decongestion, among both men and women. The increased nasal airway resistance group had a higher mean total nasal airway resistance in a sitting position before decongestion than the normal nasal airway resistance group (0.89 Pa/cm3/second vs 0.16 Pa/cm3/second). No patient in the increased nasal airway resistance group was able to be measured with rhinomanometry in a supine position because of immeasurable airflow, thereby explaining the missing value.
Table 3. Rhinomanometry in patients with chronic nasal obstruction

Table shows total nasal airway resistance in the sitting and supine body positions for men and women, before and after two sprays of 0.5 mg/ml oxymetazoline (Nezeril) in each nostril. Data are presented as mean (standard deviation). △1 = difference between sitting and supine position before decongestion. △2 = difference between sitting and supine position after decongestion. *n = 25 (61 per cent); †n = 16 (39 per cent); ‡total n = 41
Table 4. Rhinomanometry in patients with chronic nasal obstruction

Table shows total nasal airway resistance in the sitting and supine body positions for increased total nasal airway resistance and normal total airway resistance, before and after two sprays of 0.5 mg/ml oxymetazoline (Nezeril) in each nostril. Data are presented as mean (standard deviation). Normal nasal airway resistance is defined as equal to or less than 0.3 Pa/cm3/second in sitting position before decongestion. Increased nasal airway resistance is defined as more than 0.3 Pa/cm3/second in sitting position before decongestion. △1 = difference between sitting and supine position before decongestion. △2 = difference between sitting and supine position after decongestion. *n = 29; †n = 12
Acoustic rhinometry data are shown stratified by gender in Table 5 and stratified by increased nasal airway resistance and normal nasal airway resistance in Table 6. It was possible to perform acoustic rhinometry on all subjects, in both a sitting and a supine position, before and after decongestion. There was no statistically significant change in intranasal geometry between a sitting and a supine position before decongestion in either the increased nasal airway resistance group (p = 0.327) or the normal nasal airway resistance group (p = 0.101).
Table 5. Acoustic rhinometry in patients with chronic nasal obstruction

Table shows the minimal cross-sectional area for the left plus right side and the volume 0–2.2 cm from the nostril, sitting and supine, before and after decongestion and by gender. Data are presented as mean (standard deviation). △1 = difference between sitting and supine position before decongestion. △2 = difference between sitting and supine position after decongestion. *n = 25 (61 per cent); †n = 16 (39 per cent); ‡total n = 41
Table 6. Acoustic rhinometry in patients with chronic nasal obstruction

Table shows the minimal cross-sectional area for the left plus right side and the volume 0–2.2 cm from the nostril, sitting and supine, before and after two sprays of 0.5 mg/ml oxymetazoline (Nezeril) in each nostril for increased total nasal air way resistance and normal total airway resistance. Data are presented as mean (standard deviation). Normal nasal airway resistance is defined as equal to or less than 0.3 Pa/cm3/second in sitting position before decongestion. Increased nasal airway resistance is defined as more than 0.3 Pa/cm3/second in sitting position before decongestion. △1 = Difference between sitting and supine position before decongestion. △2 = Difference between sitting and supine position after decongestion. *n = 29; †n = 12
Discussion
The aim of this study was to investigate the usefulness of measuring rhinomanometry in a supine body position in the assessment of patients with chronic nasal obstruction. The results from this study indicate that an increase in the total nasal airway resistance of more than 0.3 Pa/cm3/second in a sitting position, without decongestion, predicts significant nasal breathing problems when supine. The change in intranasal geometry assessed with acoustic rhinometry between sitting and supine was small, which confirms that a narrow nasal passage with high intranasal airway resistance in a sitting position is able to promote airway collapse beyond the nasal cavity itself when lying down. Patients with a total nasal airway resistance of more than 0.3 Pa/cm3/second when sitting are highly likely to have nasal breathing problems when lying down and should be evaluated for nocturnal nasal obstruction.
Rhinomanometry in a supine body position is useful when assessing patients with chronic nasal obstruction. The small change in intranasal geometry between sitting and supine, as measured with acoustic rhinometry in this study, is unable to explain the inability of the patients in the increased nasal airway resistance group to generate a nasal airflow to undergo rhinomanometry when supine and before decongestion. The results indicate that the airway collapse occurs beyond the nasal cavity. The dislocation of the tonsils, the tongue and soft palate, along with the lower jaw, could contribute. Changes in breathing pattern when lying down may also be important when a subject already has a critically high total nasal airway resistance when sitting up. This is further supported by the finding that 58 per cent of the patients in the increased nasal airway resistance group were able to perform rhinomanometry when supine after decongestion when the mean total nasal airway resistance when sitting before decongestion was reduced by half (from 0.89 to 0.4 Pa/cm3/second).
Nasal obstruction has been rated as the most troublesome symptom of allergic rhinitis when waking up in the morning.Reference Shedden1 Nasal obstruction is also associated with micro-arousals, upper airway resistance syndrome and, as a result, with daytime sleepiness and impaired health-related quality of life.Reference Young, Finn and Kim2 A recent study from Finland also showed that the impact of nasal obstruction on health-related quality of life was similar in patients with chronic rhinosinusitis and a nasal septal deviation.Reference Virkkula, Maasilta, Hytonen, Salmi and Malmberg3 This indicates that, regardless of whether the nasal obstruction is inflammatory or structural, the effect is the same.
In this study, we included patients referred to a tertiary otolaryngology clinic due to a longstanding, nasal steroid-refractory nasal obstruction, which was confirmed by more than 70 per cent reporting the use of nasal steroids, with remaining symptoms. All the patients were examined with both rhinomanometry and acoustic rhinometry by two trained examiners who were instructed to sample the data but had no prior knowledge of the analyses of the data. The cut-off level for total nasal airway resistance (more than 0.3 Pa/cm3/s) to define increased nasal airway resistance, according to the guidelines of the American Thoracic Society, was applied after the data were collected in the analyses. The results are therefore unbiased by the examiners and thus reliable. Since the study aimed to compare rhinomanometry data when sitting and supine, the total inability to perform rhinomanometry when supine in the increased nasal airway resistance group was unexpected. In two previous studies of rhinitis patients who were measured while sitting and supine, there were no reports of patients who were unable to undergo rhinomanometry when supine before decongestion due to the absence of nasal airflow.Reference Altissimi, Gallucci, Rossetti and Simoncelli14,Reference Stroud, Wright and Calhoun19 However, in these studies, the mean total nasal airway resistance was well below 0.3 Pa/cm3/second. An alternative cut-off of 0.25 Pa/cm3/second as the upper limit of normal total nasal airway resistance has been suggested.Reference Merkle, Kohlhas, Zadoyan, Mosges and Hellmich21 Adapting that cut-off level to this study would only have enabled 2 of 17 patients to undergo rhinomanometry when supine before decongestion and, as a result, 88 per cent would still not have had a measurable airflow when supine.
It is well recognised that one of the weaknesses of rhinomanometry, performed when sitting, is that patients with severe nasal obstruction are unable to complete the procedure due to non-measurable nasal airflow. Active anterior rhinomanometry requires one nostril to be blocked with a pressure-sensitive probe while the nasal airflow is assessed in the other nostril. This is a non-physiological setting, forcing the subject to increase inspiratory effort in order to inhale through the only nostril available. This increase in effort may in turn promote the collapse of the upper airway, resulting in the total loss of nasal airflow. In this study, patients exhibiting a severe nasal septal deviation or nasal polyps were excluded for that reason. The fact that all 41 patients included were able to perform rhinomanometry in the sitting position before decongestion according to standard procedure shows that, even though these patients had symptoms of nasal obstruction and many were unable to perform rhinomanometry when supine, the most severe cases of nasal obstruction were not present in the study.
Although rhinomanometry in the supine position is not a procedure recommended by the manufacturer or by the standardisation committee, the equipment can be used in this way. Different companies provide different devices for rhinomanometry that could be more or less feasible in this regard. We used the Rhinocomp® device because it is also easy to handle in the supine position. A pressure-sensitive probe is fitted to one nostril using adhesive tape, and a transparent face mask is then held over the nose and mouth. When the patient breathes through the unplugged nostril into the face mask, the airflow is assessed. Apart from poor fitting of the adhesive tape or of the face mask, there are a few other factors that need to be controlled for. The examiner is able to see if the patient is breathing through the mouth, which the patient must not do, thanks to the transparent face mask.
Similar conditions apply to acoustic rhinometry. We used the acoustic rhinometer from Rhinometrics® that samples a constant flow of sound impulses, thus enabling the examiner to correct for reading errors in real time due to leakage at the nostril. These conditions are the same when both sitting and supine.
Of 41 consecutive patients referred to the otolaryngology department for chronic nasal obstruction, only 12 (29 per cent) had an increased total nasal airway resistance before decongestion, which is surprising. There are no widely accepted normal values for total nasal airway resistance and several cut-off levels have been suggested, including the American Thoracic Society guidelines cut-off level of less than 0.3 Pa/cm3/second used in this study.Reference Chaaban and Corey16 Using this cut-off, 29 (71 per cent) of the patients suffering from chronic nasal obstruction had a total nasal airway resistance in the normal range. This effectively illustrates the complicated relationship between subjective symptoms of nasal obstruction and objective measurements of nasal patency. Several studies have shown that this correlation is inconclusive.Reference Andre, Vuyk, Ahmed, Graamans and Nolst Trenite22
The patients in this study had twice as much asthma and 2.5 times more hay fever than the general Swedish population.Reference Bjerg, Ekerljung, Middelveld, Dahlen, Forsberg and Franklin23 Chronic rhinosinusitis was present in 51 per cent compared with 11 per cent in the population, and 95 per cent reported nasal obstruction for more than 12 weeks. Women were over-represented (61 per cent) and present smoking was more prevalent compared with Swedish population data (17 vs 7–11 per cent). Self-reported symptoms of sleep disturbance were common and 17 per cent were diagnosed with mild sleep apnoea syndrome. There were, however, no significant differences between the increased nasal airway resistance group and the normal nasal airway resistance group with regard to these factors. There was a tendency towards more women in the increased nasal airway resistance group (75 per cent vs 55 per cent). Women generally have smaller noses than men and a smaller intranasal cross-sectional area is associated with higher total nasal airway resistance.Reference Samolinski, Grzanka and Gotlib24 Smaller noses have less leverage if nasal inflammation or structural changes appear, leading to nasal obstruction at an earlier point than when the nose is larger.
In the increased nasal airway resistance group, there was also a tendency towards more asthma (41.7 per cent vs 10.3 per cent) and hay fever (92 per cent vs 66 per cent). Asthma and hay fever are closely associated with inflammation of the nasal mucosa, which can reduce the minimal cross-sectional area and increase total nasal airway resistance.Reference Hellgren, Toren, Balder, Palmqvist, Lowhagen and Karlsson25,Reference Gaga, Lambrou, Papageorgiou, Koulouris, Kosmas and Fragakis26 Patients with mild asthma and rhinitis have also exhibited impaired regulation of the nasal mucosal swelling when going from sitting to supine.Reference Rimmer, Greenwood, Bartlett and Hellgren27 In a Danish study of 230 individuals from a random adult population, 14 per cent reported nasal obstruction. The authors found that a nose with small intranasal dimensions, symptoms of allergy and a large degree of swelling of the mucosa were some of the important factors when it came to predicting nasal obstruction in that group and this is in accordance with the findings from our study.Reference Grymer, Hilberg and Pedersen28
Snoring was reported by 56 per cent of all the patients (mean age: 33 years). In the increased nasal airway resistance group, it was higher at 75 per cent, but the difference compared with the normal nasal airway resistance group was not statistically significant. According to the Wisconsin Sleep Cohort, nasal obstruction when supine is considered to be a risk factor for snoring.Reference Young, Finn and Kim2
In this study, there was no difference in apnoea-hypopnea index or oxygen desaturation index between the two groups. More than 80 per cent of the patients in the increased nasal airway resistance group had an apnoea-hypopnea index of less than 5, which is in line with current research and indicates that there is no linear correlation between nasal obstruction and the severity of sleep-disordered breathing.
This study has several strengths and weaknesses that have to be considered. The cut-off level for total nasal airway resistance of more than 0.3 Pa/cm3/second used in this study may not fully reflect the difference between an obstructed and a patent nose. The patients in the normal nasal airway resistance group were all suffering from nasal obstruction, despite having a total nasal airway resistance of less than or equal to 0.3 Pa/cm3/second. Sensory nasal obstruction without any increase in the total nasal airway resistance has been described and may be present in some of our study subjects.Reference Eccles and Jones29 Inflammatory nasal obstruction typically varies over time and some of the measurements may therefore have been made during a period of improvement. Rhinomanometry depends on patient effort, and breathing through only one nostril at a time can increase the tendency towards airway collapse compared with normal tidal breathing. These and other methodological factors, such as leakage at the pressure catheter or facial mask, may also produce false readings.
• Nasal obstruction when lying down is a common complaint in patients with chronic nasal obstruction, but rhinomanometry is typically performed in the sitting position
• This study aimed to study whether adding rhinomanometry when supine is a useful examination in patients with chronic nasal obstruction
• This study shows that increased total nasal airway resistance when sitting predicts nasal breathing problems when lying down
• Rhinomanometry when supine should be performed to diagnose upper airway collapse when supine
The NOX T3 sleep monitor is easy to use in the home environment. However, the T3 device was not equipped with electroencephalogram that measures whether the patient is asleep or awake. Polysomnography would have been preferred, but it was not available to us.
Conclusion
This study shows that a high percentage of patients suffering from chronic nasal obstruction had normal total nasal airway resistance on rhinomanometry. Increased nasal resistance when sitting predicts nasal breathing problems when lying down. Rhinomanometry when supine should be performed to diagnose upper airway collapse when supine.
Acknowledgements
We would like to acknowledge statistician Helena Johansson for her valuable contribution to this study. The study was financed by grants from the Swedish state under the agreement between the Swedish government and the county councils (‘ALF’ agreement). The authors wish to thank the Gothenburg Medical Society.
Competing interests
None declared


