


Introduction
The human cochlea was first described by Bartholomeus Eustachius in 1564 and has since been studied extensively.Reference Erixon, Hogstorp, Wadin and Rask-Andersen1 The need to establish normative data for the dimensions of the cochlea arose with the advent of cochlear implant treatment for sensorineural hearing loss. The cochlear duct is defined as the length of the scala media, measured from the round window to the helicotrema.Reference Alexiades, Dhanasingh and Jolly2 The cochlear duct can be measured using computed tomography (CT), plastic casts and cadaveric temporal bones.
The cochlea attains its adult dimensions at 16–20 weeks of gestation.Reference Gulya3 Studies conducted since 1884 show that the length of the normal cochlear duct is 25–44 mm.Reference Würfel, Lanfermann, Lenarz and Majdani4 The dimensions of the cochlear duct play an important role in cochlear implant selection and implant efficacy.
Cochlear implants are the most effective treatment for patients with severe and profound sensorineural hearing loss. Cochlear implants imitate the tonotopic organisation of the cochlea, transforming the electrical stimulus they create into sound.Reference Angeli and Goncalves5 The duration of deafness, the level of speech recognition before implantation, electrode insertion depth at the time of surgery, intracochlear trauma and lateral peri-modiolar placement all have an effect on post-implantation performance.Reference Jiam, Jiradejvong, Pearl and Limb6
Cochlear implants are inserted into the scala tympani using the standard transmastoid-facial recess approach, via cochleostomy or round window insertion. During cochlear implant insertion, cochlear structures may be subjected to trauma, leading to activation of enzymatic cascades and the release of neurotoxic factors. There is also a risk of fibrosis formation in the cochlear duct.Reference Adunka, Gstoettner, Hambek, Unkelbach, Radeloff and Kiefer7 Cochlear implant insertion depth can alter post-operative results, even in normal cochleae, because of variations in cochlear anatomy. Deep insertion can inhibit the preservation of residual hearing, whereas shallow insertion can lead to poor speech performance during post-implantation rehabilitation.Reference Adunka, Gstoettner, Hambek, Unkelbach, Radeloff and Kiefer7
Cochlear implant surgery has evolved since 1979. Originally, a separate cochleostomy was used, but with the development of thin and atraumatic electrodes, implantation is currently most commonly performed through the round window membrane. At first, the electrode was placed along the lateral wall of the cochlea. After the modiolar hugging electrodes were improved, mid-scalar electrodes have become more popular and useful.
The present study aimed to determine cochlear duct mid-scalar length in normal cochleae, based on pre-operative high-resolution CT of the temporal bones, and examine its role in the selection of correct peri-modiolar and mid-scalar implant lengths.
Materials and methods
Participants
This retrospective study included patients evaluated at the Department of Otorhinolaryngology, Faculty of Medicine, Hacettepe University, Ankara, Turkey, who underwent temporal bone high-resolution CT and an audiogram, between 2014 and 2016, because of a membrane perforation resulting from chronic otitis media. Patients with an air–bone gap of less than 20 dB and conductive hearing loss were included. Patients with sensorineural hearing loss and inner-ear malformation based on high-resolution CT were excluded. Patient age and gender, and the side of the ear measured, were assessed based on audiogram findings.
Procedure
High-resolution CT of the temporal bone was performed using 1 mm sections. The images were obtained via a picture archiving communication system. High-resolution CT scans were evaluated by a radiologist and an otorhinolaryngologist.
Axial and coronal images were reformatted so that they passed through the round window. Basal turn length and height were measured in the axial plane, whereas cochlear height was measured at the mid-modiolar section (Figure 1a–c). Three-dimensional (3D) multi-planar reconstruction was performed in the coronal plane, using the round window as the reference. The cochlear duct was marked at the midline, from the middle of the round window to the helicotrema, and was then measured after it was turned into a linear line (Figure 2a, b). The lateral wall length of the cochlear duct was measured from the round window to helicotrema along the lateral wall.

Fig. 1. Axial computed tomography image demonstrating measurements of: (a) basal turn length, (b) basal turn height and (c) mid-modiolar cochlea height. The sections were passed through the round window. A = anterior; P = posterior

Fig. 2. Cochlear duct length based on three-dimensional multi-planar reconstruction: (a) marked cochlear duct and (b) straightened cochlear duct.
The ‘X’ line was defined as the largest distance from the mid-point of the round window to the mid-scalar point of the cochlear canal on reformatted coronal images (Figure 3). Measurements were made by a radiologist and/or an ENT specialist, and took approximately 15 minutes to complete.
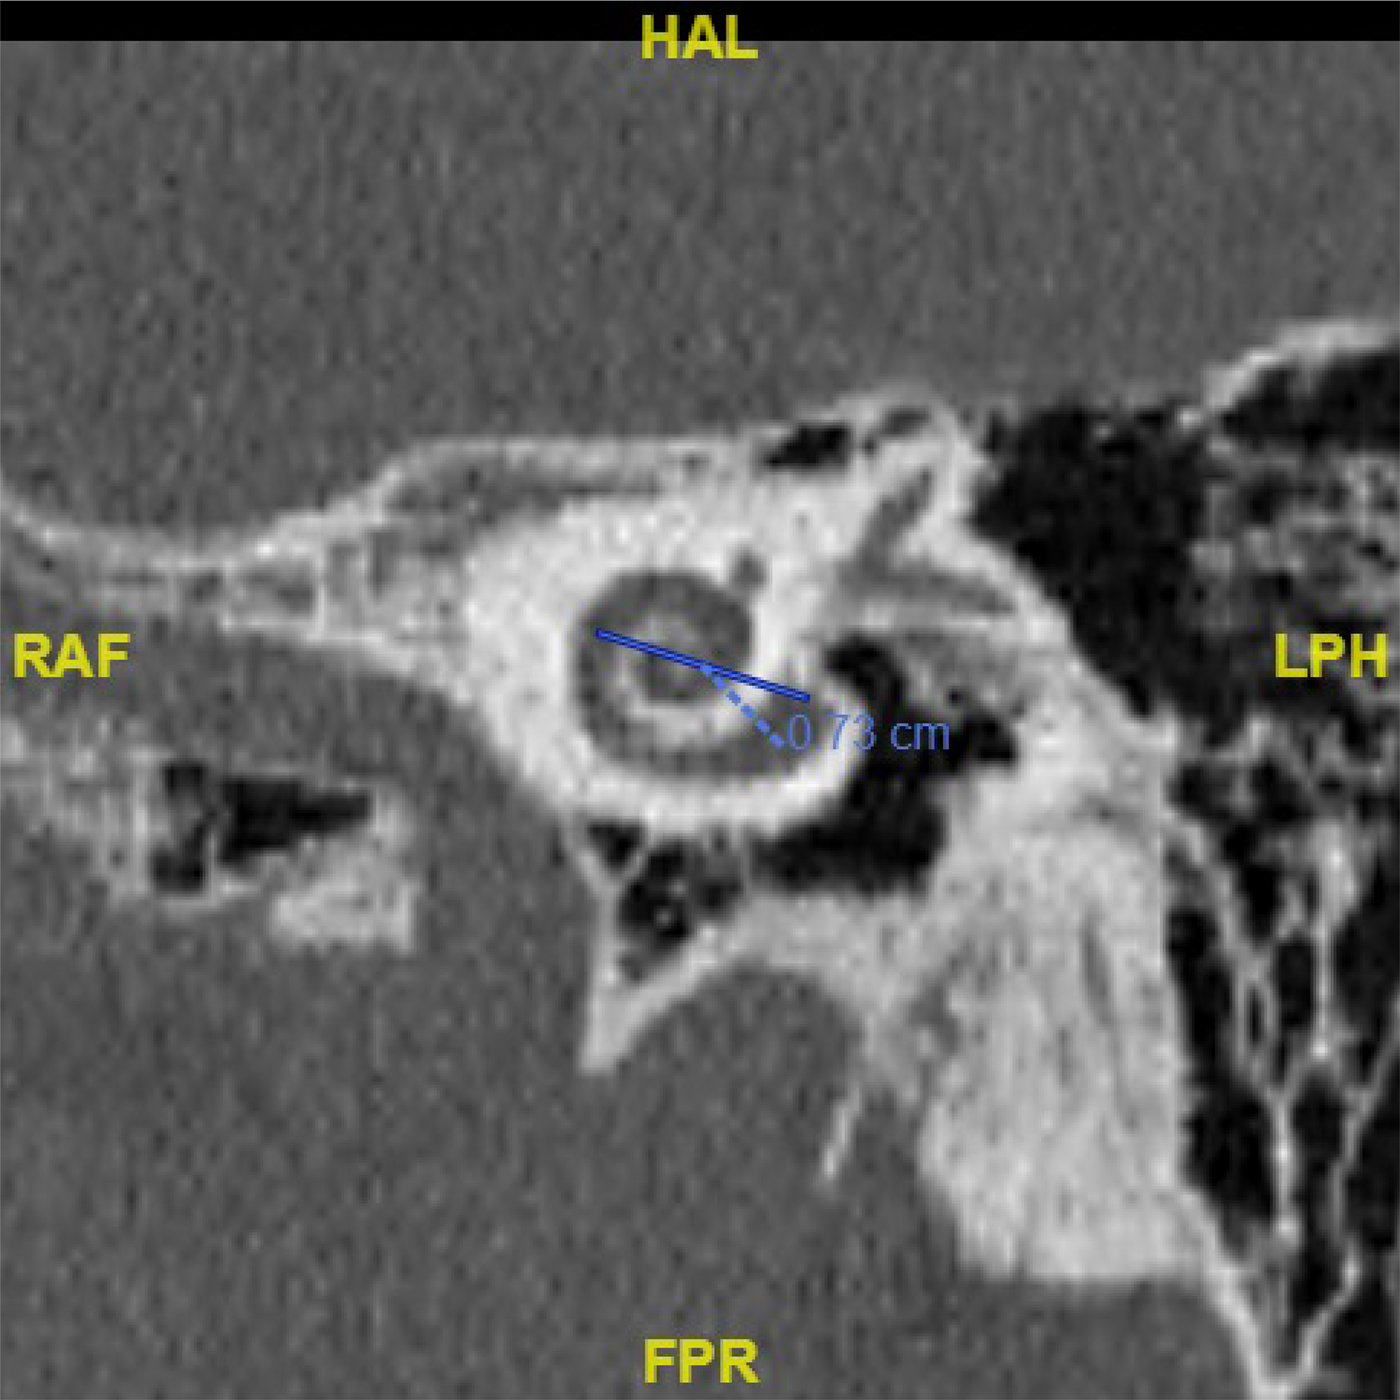
Fig. 3. A coronal reformatted computed tomography section showing the ‘X’ line, defined as the largest distance between the mid-point of round window and the mid-scalar point of the cochlear canal. HAL = head-anterior-left; RAF = right-anterior-feet; LPH = left-posterior-head; FPR = feet-posterior-right
Statistical analysis
Descriptive statistics are shown as: mean ± standard deviation, median, 25th and 75th percentiles, and range. The normality of variables was examined with the Shapiro–Wilk test, boxplots and Q–Q plots. Comparisons for two groups were made via the Mann–Whitney U test, as a normality assumption was not satisfied. The relationship between the X line and cochlear duct length was examined via Pearson's correlation co-efficient. A simple linear regression was conducted, to determine whether the X line could predict cochlear duct length. The level of statistical significance was set at p < 0.05. All reported p-values are two-sided. Data were analysed using IBM® SPSS Statistics for Windows software, version 23.0. Boxplots were drawn using the ‘ggplot2’ package in RStudio® software, version 1.0.136.
Ethics
The Hacettepe University Faculty of Medicine Ethics Committee approved the study protocol (approval number: GO15/784-30).
Results
The study included 40 patients (21 male (52.5 per cent) and 19 female (47.5 per cent)), with a mean age of 30.3 ± 12.7 years. In all, 24 right ears (60 per cent) and 16 left ears (40 per cent) were evaluated. The mean pure tone audiometry value was 10.2 ± 4.3 dB. The descriptive statistics of the dataset are shown in Table 1.
Table 1. Descriptive statistics of five measurements

All measurements are shown in millimetres. SD = standard deviation
There was a significant difference between the mean lateral wall length (28.88 mm) and mid-scalar length (20.08 mm) of the cochlear duct (p < 0.001). Boxplots of five measurements with respect to gender and ear side are shown in Figure 4.
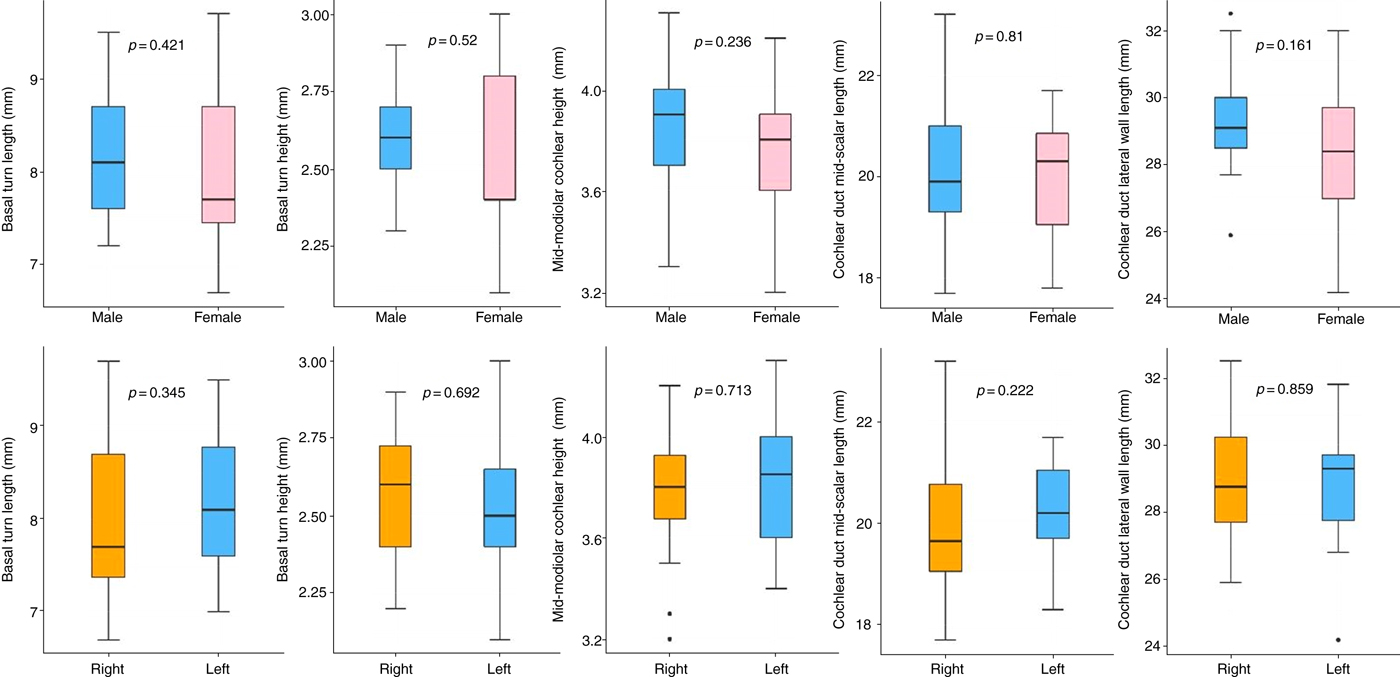
Fig. 4. Boxplots of five measurements with respect to gender and ear side.
Pearson's correlation co-efficient was used to examine the relationship between the ‘X’ line and cochlear duct mid-scalar length. Both the X line and cochlear duct mid-scalar length were normally distributed, based on Shapiro–Wilk normality test results (W = 0.981 (p = 0.743) and W = 0.982 (p = 0.749), respectively). There was a significant positive correlation between the X line and cochlear duct mid-scalar length (r = 0.793 (p < 0.001)).
A simple linear regression was conducted to determine how well the X line could predict cochlear duct mid-scalar length. When the simple linear regression was applied to the entire dataset, we found that three of the observations were influential. When these three observations were removed from the simple linear regression, R2 increased by approximately 13 per cent; therefore, these three observations were removed for simple linear regression. A significant simple linear regression model was then produced (F (1,35) = 113.69, p < 0.001), which explained 75.8 per cent of the variance in cochlear duct mid-scalar length (R2 = 0.758). The normal distribution and homogeneity of variance assumptions of the linear regression model were verified using the Shapiro–Wilk test (W = 0.971 (p = 0.440)) and Levene's test (F = 1.675 (p = 0.135)). The scatter plot of the X line and cochlear duct mid-scalar length is presented with a simple linear equation (cochlear duct length = 0.2 + 2.85 × X line) in Figure 5.
Fig. 5. Scatter plot of the ‘X’ line and cochlear duct mid-scalar length. CDL = cochlear duct length
Discussion
All cochlear dimensions and duct length measurements in the present study were obtained via high-resolution CT. Cochlear duct length was measured at the midline, from the round window to the apex. Mean cochlear duct length was 20.08 ± 1.24 mm.
The literature describes various methods of measuring cochlear dimensions, in which measurements are primarily performed using cadaveric temporal bones, plastic casts and high-resolution CT. Erixon et al.Reference Erixon, Hogstorp, Wadin and Rask-Andersen1 created plastic cochlear casts from cadavers and divided them into quadrants after photographing them. They observed that outer cochlear wall length was 38.6–45.6 mm (mean = 42 mm), mean cochlear height was 3.9 mm and mean basal turn width was 6.8 mm. They could not carry out any peri-modiolar measurements because the cochlea was filled with plastic material. The measurements of mid-modiolar cochlear height and basal turn width in our study were similar to results of Erixon et al.
Meng et al.Reference Meng, Li, Zhang, Li and Qin8 studied temporal bone high-resolution CT images of 310 cochleae that were subjected to 3D multi-planar reconstruction. They measured cochlear duct length, from the lateral wall, and measured cochlear base length using the mid-point of the round window as the reference point. In addition, they used the perpendicular distance to measure the cochlear base width. The authors reported a mean cochlear duct length of 35.8 ± 2.0 mm. They found no significant differences according to ear side or age, whereas the difference between genders was significant.
Würfel et al.Reference Würfel, Lanfermann, Lenarz and Majdani4 measured cochlear duct length in 436 ears using cone beam CT. As in the present study, they identified the basal turn of the cochlea on the axial plane, marked a line parallel to the basal turn, identified the coronal plane on that line, and then created coronal reformatted images. They reported a mean cochlear duct length of 37.9 ± 1.98 mm. In contrast to the present study, Würfel et al. used the lateral wall as the reference point for measurement. The authors noted a significant difference in cochlear duct length between males and females, but did not observe a correlation between cochlear length and age.
Escude et al.Reference Escude, James, Deguine, Cochard, Eter and Fraysse9 scanned the cochleae of 42 patients with otological disease using high-resolution CT. The authors marked the greatest distance from the round window to the lateral wall on the multi-planar reconstructed coronal plane, starting from the mid-point of the round window and extending through the mid-modiolar axis, which was referred to as ‘linear A’. The perpendicular distance on this plane was referred to as ‘linear B’. They reported a correlation between linear A and B. They also measured the lengths of the cochlear duct and the organ of Corti using the Archimedean spiral equation. They classified the linear A and reported its importance for determining cochlear implant length.
Alexiades et al.Reference Alexiades, Dhanasingh and Jolly2 estimated the two-turn length and complete cochlear duct length using linear A (based on a CT scan measurement of the basal turn diameter). They performed regression analysis (using data from studies by Hardy (2005) and Lee et al. (2010), as cited in Alexiades et al.), and observed the following equations: two-turn length = 3.65(A − 1) and cochlear duct length = 4.16A − 4 at the organ of Corti, and two-turn length = 3.65(A − 0.7) and cochlear duct length = 4.16A − 2.7 for the cochlear implant electrode, positing that the ‘A’ values 7.3 mm, 8.4 mm and 9.2 mm equate to lengths of 24 mm, 28 mm and 31 mm, respectively. They suggest that implant selection should be made in accordance with these formulae. The lateral wall was taken as the reference point for those measurements and the formulae were made accordingly. In the present study, measurements were obtained using the mid-scalar point as the reference point, which we think yields a more accurate measurement of cochlear canal length in patients who will use peri-modiolar and mid-scalar electrodes.
The implants routinely used today are designed to stimulate the organ of Corti on the lateral wall. In their study on cat cochleae, Shepherd et al.Reference Shepherd, Hatsushika and Clark10 stimulated the outer wall of the scala tympani, the middle of the scala tympani, spiral ganglion and peripheral dendrites, using electrically evoked auditory brainstem responses. The authors recorded lower threshold responses and amplitudes by placing the electrode on the side closer to the modiolus, thereby increasing the dynamic range. Based on their findings, they concluded that cochlear implants which stimulate peri-modiolar-positioned spiral ganglions yield better post-operative performance, as compared to those that do not.
Cochlear implant surgery always causes surgery-related cochlear damage. Eshraghi et al.Reference Eshraghi, Yang and Balkany11 rated such surgery-related cochlear damage on a scale of 0 to 4, with regard to the spiral ligament, basilar membrane and osseous spiral lamina. The authors concluded that the severity of such damage is acceptable. Adunka et al.Reference Adunka, Gstoettner, Hambek, Unkelbach, Radeloff and Kiefer7 used Eshraghi and colleagues’ cochlear damage grading system to evaluate the difference between cochleostomy and round window insertion, and reported that round window insertion is associated with a significantly lower risk of damage. The literature clearly shows that, compared to cochleostomy, round window insertion increases the likelihood of successful peri-modiolar placement of non-modiolar hugging electrode arrays, which is associated with less current spread and greater stimulation selectivity.Reference Jiam, Jiradejvong, Pearl and Limb6
The most frequently used peri-modiolar implants today are the Nucleus® CI532 cochlear implant with the Slim Modiolar Electrode, and the HiFocus™ Mid-Scala Electrode, made by Advanced Bionics. The Nucleus CI532 implant is 18.4 mm long, and provides active stimulation, with 22 platinum electrode contacts that are spaced out across 14 mm. A stylet is used during the insertion of these electrodes, which hold the electrode straight for minimal insertion trauma. The HiFocus Mid-Scala Electrode, on the other hand, is 23.7 mm long and provides stimulation over an 18.5 mm area; these electrodes are also inserted using a stylet. Both implants can be inserted via cochleostomy or round window insertion. The Nucleus CI24RE Contour Advance Electrode is a 19 mm long peri-modiolar electrode, with 22 platinum electrode contacts and 15 mm active length. These dimensions confirm the present study's findings that the mean cochlear duct length and peri-modiolar implant length are compatible.
Most relevant studies have used the lateral wall as a reference for the measurement of cochlear duct length.Reference Koch, Ladak, Elfarnawany and Agrawal12 We believe this is why earlier research reported higher values than those observed in the present study. The significant difference between the cochlear duct lateral wall length and the mid-scalar length indicates that use of the lateral wall length measurement can be misleading if mid-scalar or peri-modiolar electrodes are selected. The present findings are compatible with the dimensions of routinely used peri-modiolar electrodes and mid-scalar electrodes. Additionally, it should be noted that linear A,Reference Escude, James, Deguine, Cochard, Eter and Fraysse9 used for measuring cochlear length, was shown to be significant only in normal cochleae; whether or not the formula is significant in cases of inner-ear malformation remains unknown.
• The ‘X’ line, the largest distance from the mid-point of the round window to the mid-scalar point of cochlear canal, can be used to predict cochlear duct mid-scalar length
• Cochlear duct lateral wall length is longer than mid-scalar length
• Cochlear duct mid-scalar length is compatible with peri-modiolar and mid-scalar electrode lengths
This study has a few limitations. Our model is based on radiological measurements of CT scans; its usefulness in clinical practice should be supported by a pilot study performed on patients undergoing cochlear implantation. Although our regression analysis yielded a high correlation, there were some outlying values. Additional research with a larger sample size is required to increase the statistical power of the model.
Conclusion
Mean cochlear duct mid-scalar length was compatible with peri-modiolar implant length and mid-scalar implant length. We think that the measurement method used in the present study may be useful for pre-operative peri-modiolar or mid-scalar implant selection.
Competing interests
None declared


