


Introduction
Tinnitus is defined as a meaningless auditory perception in the absence of an external sound. The prevalence of chronic tinnitus increases with age until about 70 years, with a maximum of 14.3 per cent of adults in their seventh decade of life reporting having tinnitus.Reference Shargorodsky, Curhan and Farwell 1 Furthermore, 6.4 per cent of young Flemish adults already suffer from chronic tinnitus caused by leisure noise exposure.Reference Degeest, Keppler, Corthals and Clays 2 Chronic tinnitus can result in co-morbid depression, sleeping problems, anxiety and psychological stress, with a negative impact on the individual's quality of life and an additional societal impact.Reference Henry, Dennis and Schechter 3 The factors that most correlate with tinnitus handicap are daytime tinnitus awareness and the presence of hyperacusis.Reference Degeest, Corthals, Dhooge and Keppler 4
Subjective tinnitus often occurs in association with peripheral hearing loss, such as noise-induced hearing loss or presbycusis, amongst other otological, neurological, infectious or drug-related causes.Reference Lockwood, Salvi and Burkard 5 It is assumed that the reduced auditory input to the nervous system results in central auditory system changes, thereby inducing tinnitus.Reference Moller, Moller, Langguth, De Ridder and Kleinjung 6 Subjective tinnitus can also be present in normal hearing subjects;Reference Savastano 7 nevertheless, the assumption of deafferentation still holds, as the audiogram at conventional frequencies might not accurately reflect the frequency region of hearing lossReference Vielsmeier, Lehner, Strutz, Steffens, Kreuzer and Schecklmann 8 and cochlear damage in audiometrically normal hearing subjects is possible.Reference Weisz, Hartmann, Dohrmann, Schlee and Norena 9
Peripheral deafferentation can cause several neural changes. First, there is an increase in spontaneous firing rates along the auditory pathway, and, in addition, an increase in synchronous neuronal activity in the auditory cortex.Reference Eggermont 10 The perception of tinnitus can then be explained by the homeostatic plasticity model,Reference Schaette and Kempter 11 which states that neuronal excitation is increased to compensate for the decrease in neuronal inhibition and thus to maintain a stable mean firing rate.Reference Turrigiano 12 The neuronal excitability amplifies neural noiseReference Norena 13 or generates more central noise,Reference Zeng 14 which results in the perception of tinnitus. As a consequence of the increased spontaneous firing rate and neuronal synchronous activity along the auditory pathway, a reorganisation of the tonotopic map occurs where cortical neurons respond to neighbouring frequencies.Reference Rauschecker 15 According to this tonotopic reorganisation model, there is an over-representation of neuronal activity at the transition region from normal to impaired hearing in the auditory cortex,Reference Gerken 16 which leads to the perception of tinnitus. However, based on recent findings, tonotopic reorganisation is not a prerequisite for tinnitus perception in patients with normal hearing to mild hearing loss.Reference Langers, de Kleine and van Dijk 17 Furthermore, besides neural alterations along the auditory pathways, neuroimaging in humans reveals the involvement of non-auditory areas serving attention, memory and emotion in the perception of tinnitus and the associated distress.Reference Elgoyhen, Langguth, De Ridder and Vanneste 18
A psychoacoustic assessment of tinnitus frequency can be used to evaluate the neurophysiological mechanisms of tinnitus perception. According to the homeostatic plasticity model, the increase in synchronous neuronal activity would occur in the region of the auditory cortex responsible for the range of frequencies within the hearing loss.Reference Norena and Eggermont 19 Therefore, the perceived tinnitus frequency is expected to lie within the frequency range of hearing loss.Reference Schaette and Kempter 11 However, in the case of tonotopic reorganisation along the auditory cortex, the perceived tinnitus frequency would be related to the edge of hearing loss.Reference Eggermont 10
Several studies have investigated the relationship between dominant tinnitus pitch and audiogram parameters. Some studies found a correlation between tinnitus pitch and the frequency range of hearing loss.Reference Henry, Meikle, Gilbert and Hazell 20 – Reference Sereda, Edmondson-Jones and Hall 27 More specifically, tinnitus pitch corresponded to the frequency of the worst hearing thresholds of the right ears, but with non-significant correlations on the left side.Reference Schecklmann, Vielsmeier, Steffens, Landgrebe, Langguth and Kleinjung 28 Others, however, found a correlation between tinnitus pitch and an audiometric edge frequency,Reference König, Schaette, Kempter and Gross 29 – Reference Shekhawat, Searchfield and Stinear 31 such as the low-frequency edge of sloping hearing loss.Reference König, Schaette, Kempter and Gross 29 , Reference Moore, Vinay and Sandhya 30 Shekhawat et al. found a correlation between tinnitus pitch and the edge frequency close to a hearing loss of 50 dB HL.Reference Shekhawat, Searchfield and Stinear 31 They argued that it is not the audiometric edge of normal hearing to hearing loss that must be considered, but the frequency at which the hearing threshold is approximately 50 dB HL, corresponding to the transition from outer hair cell to inner hair cell or neural loss. However, Sereda et al. did not find a correlation between tinnitus pitch and this audiometric parameter.Reference Sereda, Hall, Bosnyak, Edmondson-Jones, Roberts and Adjamian 25 In contrast to these studies in which a correlation between dominant tinnitus pitch and audiometric parameters was detected, Pan et al. found no such systematic relationship.Reference Pan, Tyler, Ji, Coelho, Gehringer and Gogel 32
Evoked otoacoustic emissions (OAEs) can be used to evaluate outer hair cell function, and could therefore provide valuable information in patients with tinnitus.Reference Dhar, Hall, Hall and Ramachandran 33 A higher prevalence of absent or abnormal transient evoked and distortion product OAEs (DPOAEs) was found in patients with tinnitus with or without hearing loss,Reference Ozimek, Wicher, Szyfter and Szymiec 34 , Reference Granjeiro, Kehrle, Bezerra, Almeida, Sampaio and Oliveira 35 although others found no significant differences or an increase in DPOAE amplitudes as compared to subjects without tinnitus.Reference Ami, Abdullah, Awang, Liyab and Saim 36 , Reference Sztuka, Pospiech, Gawron and Dudek 37 However, information regarding the relationship between dominant tinnitus pitch and DPOAE parameters is limited. Ozimek et al. found a weak relationship between tinnitus pitch and the depth in DPOAEs only in notch-like hearing losses.Reference Ozimek, Wicher, Szyfter and Szymiec 34
Based on the literature, it is clear that the relationship between dominant tinnitus pitch and audiometry is still controversial. The studies differ considerably in methods, mainly with regard to: the sample, tinnitus pitch matching techniques, determination of the audiometric parameters and the statistical analysis used. Furthermore, information concerning DPOAEs in relation to the tinnitus pitch is scarce. Therefore, the current study aimed to examine the relationship between dominant tinnitus pitch and several parameters of audiometry and DPOAEs, as well as the occurrence of tinnitus pitch within the frequency range of hearing loss or reduced DPOAEs, in a representative population of patients with subjective chronic tinnitus.
Materials and methods
Participants
Participants with subjective non-pulsatile constant tinnitus of at least three months duration were recruited from the Department of Otorhinolaryngology at Ghent University Hospital, Belgium. Sixty-seven patients (45 males, 22 females) visiting the otorhinolaryngologist with tinnitus as a primary complaint participated in the study. Participants’ age ranged between 18 and 73 years (mean = 47.9 years, standard deviation (SD) = 14.01). Tinnitus was mostly bilaterally located (43.28 per cent) or localised in the head (8.96 per cent); in 31.34 per cent of patients the tinnitus was left-sided and in 16.42 per cent it was right-sided. In patients with tinnitus localised in both ears or in the head, which was not identical in pitch and/or loudness at both sides (13.43 per cent), the ear with most dominant tinnitus was selected; otherwise, the included ear was chosen at random. Hence, only 1 ear per patient was included, yielding data for 30 right ears (44.78 per cent) and 37 left ears (55.22 per cent).
The study was approved by the local ethical committee, and all participants gave their informed consent in accordance with the statements of the Declaration of Helsinki.
Procedure
All participants completed a medical history and underwent an otoscopic evaluation performed by an otorhinolaryngologist, followed by an assessment of hearing and tinnitus in a double-wall sound-attenuated booth. Hearing status was evaluated using tympanometry, pure tone audiometry and distortion product OAEs (DPOAEs). Psychoacoustic assessment of tinnitus included pitch and loudness matching, and testing of tinnitus maskability. Furthermore, all participants completed Dutch-language, validated versions of the sample case history questionnaire,Reference Langguth, Goodey, Azevedo, Bjorne, Cacace and Crocetti 38 the Tinnitus Handicap InventoryReference Newman, Jacobson and Spitzer 39 and a hyperacusis questionnaire.Reference Khalfa, Dubal, Veuillet, Perez-Diaz, Jouvent and Collet 40 The inclusion criteria were normal otoscopic findings and normal middle-ear function.
Hearing assessment
Tympanometry was measured using a 226 Hz probe tone at 85 dB SPL (TympStar; Grason-Stadler, Eden Prairie, Minnesota, USA). All participants had normal immittance values.
Hearing thresholds were determined using the modified Hughson–Westlake method (Equinox 2.0; Interacoustics, Middelfart, Denmark). Octave frequencies between 0.25 and 8 kHz, and half-octave frequencies 3 and 6 kHz for air conduction (TDH-39 earphone; Telephonics, Farmingdale, New York, USA) and between 0.25 and 4 kHz for bone conduction (B71 bone transducer; RadioEar, New Eagle, Pennsylvania, USA), were measured. All participants had air–bone gaps of less than 10 dB at all tested frequencies. Pure tone average was calculated as the average of the air conduction hearing thresholds at 0.5, 1 and 2 kHz.
The DPOAEs were measured using the Echoport ILO292 USB-II module with calibrated probe and ILOv6 software (Otodynamics, Hatfield, UK). Primary tone frequencies f1 and f2 were presented simultaneously, with f2 ranging from 0.841 to 8 kHz at 8 points per octave and frequency ratio f2/f1 equalling 1.22. Primary tone levels L1 and L2 were 65 and 55 dB SPL, respectively. A noise artefact rejection level of 6 mPa was used. Measurements were stopped until the noise amplitude per frequency was below −5 dB SPL. The DPOAEs were considered present when the signal-to-noise ratio at each measured frequency was at least 3 dB. Present emission and noise amplitudes were calculated in half-octave frequency bands with centre frequencies 1, 1.5, 2, 3, 4, 6 and 8 kHz.
Tinnitus assessment
The equipment used for pure tone audiometry was also used to assess tinnitus, in conjunction with an HDA 200 headphone for high frequencies (Sennheiser, Old Lyme, Connecticut, USA). For tinnitus pitch matching, a two-alternative forced-choice procedure and octave confusion test using stimuli presented at 10 dB SL was performed in the contralateral ear to avoid confusion between the tinnitus perception and external auditory stimulus.Reference Mitchell, Vernon and Creedon 41 – Reference Henry, Zaugg and Schechter 43 Stimuli were pure tones or narrow band noises respectively for subjectively perceived tonal- or noise-like tinnitus. Tinnitus pitch matching could be performed in half-octave frequencies between 0.125 and 16 kHz. Subsequently, tinnitus loudness (in dB SL) was matched using 1 dB steps relative to the ipsilateral hearing threshold at the pitch-matched frequency. The difference between the hearing threshold and this loudness match was recorded in dB SL.Reference Henry, Zaugg and Schechter 43 Tinnitus loudness could not be determined in one patient because of the severity of hearing loss. Tinnitus pitch and loudness match was repeated until the external auditory stimulus resembled the tinnitus with a score of at least 7 out of 10 using a visual analogue scale.
Minimal masking level of tinnitus was determined, in 1 dB steps, as the white noise intensity above its corresponding hearing threshold, until each patient indicated that the tinnitus had become inaudible. White noise was presented binaurally for patients with bilateral or central tinnitus, and monaurally for those with unilateral tinnitus.Reference Henry, Zaugg and Schechter 43 Tinnitus was not maskable in eight patients including the one case in which tinnitus loudness could not be determined.
Finally, residual inhibition of tinnitus was determined by bilaterally presenting white noise 10 dB above the minimal masking level during 1 minute.Reference Vernon and Meikle 42 These results were divided into three categories: (partially) positive if the tinnitus disappeared completely or reduced in loudness, negative if the tinnitus did not change, or rebound if the tinnitus increased in loudness. Residual inhibition could not be measured in the same eight cases where a minimal masking level could not be established.
Data analysis
Several audiometric parameters were used to analyse whether the psychoacoustic assessment of the tinnitus frequency lay within the frequency range or at the maximum of hearing loss according to the homeostatic plasticity model,Reference Schaette and Kempter 11 or whether it was related to the edge of hearing loss as in the case of cortical tonotopic reorganisation.Reference Eggermont 10
For the edge frequency, the lowest frequencies at which the hearing threshold was at least 20 dB HL or 50 dB HLReference Shekhawat, Searchfield and Stinear 31 were determined. These parameters represent audiometrically the transition from normal hearing to hearing loss (lowest frequency at which the hearing threshold was at 20 dB HL), or that from outer hair cell to inner hair cell or neural loss (lowest frequency at which the hearing threshold was at 50 dB HL). In addition, in line with Pan et al.,Reference Pan, Tyler, Ji, Coelho, Gehringer and Gogel 32 the lowest frequency at which the difference in hearing threshold between adjacent frequencies was more than 15 dB, or, if not present, the lowest frequency at which the difference in hearing threshold between three successive frequencies was at least 25 dB, was calculated. This audiometric parameter is thus based on threshold differences. Finally, using the definition of Moore et al.,Reference Moore, Vinay and Sandhya 30 the edge of hearing loss was calculated as the lowest frequency at which the difference in hearing thresholds between adjacent frequencies was higher than all other differences. This audiometric parameter is based on the highest threshold difference. The audiometric parameters according to Pan et al.Reference Pan, Tyler, Ji, Coelho, Gehringer and Gogel 32 and Moore et al.Reference Moore, Vinay and Sandhya 30 (respectively, lowest frequencies at which the threshold difference was more than 15 dB and the highest threshold difference), take the difference in hearing thresholds between adjacent frequencies (and thus the slope of hearing loss) more into account, as compared to the audiometric transition parameters of lowest frequencies at which the hearing threshold was at 20 dB HL and 50 dB HL.
In contrast to the edge frequency, the frequencies corresponding to maximum hearing loss and the frequency range of hearing loss were determined. The frequency with worst hearing threshold was the frequency with the worst clinically abnormal (20 dB HL or higher) hearing threshold. The frequency range was determined as between the audiometric parameters of: the lowest frequency at which the hearing threshold was at 20 dB HL, the lowest frequency at which the difference in hearing threshold between adjacent frequencies was more than 15 dB, the lowest frequency with highest threshold difference and the frequency with worst hearing threshold; and the frequency range below and above the adjacent frequency with worst hearing threshold.
Regarding DPOAEs, only the edge frequency based on the transition from present to absent DPOAEs, and the frequency with the worst DPOAE amplitudes, can be determined. The first parameter was the lowest half-octave frequency band with absent DPOAEs. The difference in DPOAE amplitudes between normative dataReference Keppler, Dhooge, Corthals, Maes, D'haenens and Bockstael 44 and present patient DPOAE amplitudes was calculated at each half-octave frequency band. The frequency at which this value was highest indicated worst DPOAE amplitude. Further, the frequency range between the DPOAE edge frequency (lowest half-octave frequency band with absent DPOAEs) and the frequency with worst DPOAE amplitudes, and the frequency range below and above the adjacent frequency with worst DPOAE amplitude, were determined.
SPSS software, version 22 (IBM, New York, USA), was used for all statistical analyses, with a significance level of 0.05.
Analyses of variance (ANOVA) were performed to test whether the dependent variables tinnitus pitch or DPOAE amplitudes were significantly different between independent demographic, audiometric and tinnitus-related variables. This analysis was carried out to determine the possible presence of subgroups in the studied population.
Descriptive values for the parameters of audiometry (lowest frequencies at which the hearing threshold was at 20 dB HL or 50 dB HL, lowest frequency at which the threshold difference was more than 15 dB, lowest frequency with highest threshold difference, and frequency with worst hearing threshold) and DPOAEs (lowest half-octave frequency bands with absent DPOAEs, and worst DPOAE amplitude) are listed.
Chi-square tests were performed to evaluate whether the tinnitus pitch below and above 2 kHz fell significantly more within a specific frequency range of hearing loss, which would support the homeostatic plasticity model.Reference Schaette and Kempter 11 The cut-off of above 2 kHz was based on the audiometric data of the studied population, in which the mean and median of hearing thresholds became clinically abnormal (20 dB HL or higher) above 2 kHz.
Pearson correlation coefficients were determined to explore the relationships between tinnitus pitch and parameters of audiometry and DPOAEs. Principal component analysis was performed to identify the audiometric parameters that were not intercorrelated. The remaining audiometric parameters were then used in multiple regression analyses to evaluate their relationship with tinnitus pitch.
Results
General characteristics
In the studied population, the causes of tinnitus based on the patients’ history were categorised into noise-induced hearing loss (61.19 per cent), presbycusis (16.42 per cent), unknown aetiology (8.96 per cent), and other causes (13.43 per cent) such as head trauma or Ménière's disease. Tinnitus had been present for 3.83 years on average (SD = 5.30; range, 0.08–30 years). It was perceived as a tone (52.24 per cent), noise-like (16.42 per cent), a combination of both (22.38 per cent) or as a buzz (8.96 per cent).
Tinnitus pitch was 4.10 kHz on average (SD = 2.59; range, 0.125–8 kHz), with a median value of 4 kHz (Figure 1). Pitch matching could be carried out using a pure tone or narrowband noise in 71.64 per cent and 28.46 per cent of our participants respectively. The mean tinnitus loudness (n = 66) was 5.80 dB (SD = 4.71; range, 1–21 dB SL), and the tinnitus was maskable (n = 59) by 18.29 dB on average (SD = 13.23; range, 1–65 dB SL).
Fig. 1 Distribution of tinnitus pitch across frequencies.
Residual inhibition of tinnitus (n = 59) was mostly categorised as (partially) positive (55.93 per cent), followed by negative (30.51 per cent) and rebound (13.56 per cent).
Tinnitus Handicap Inventory scores were 42.45 per cent on average (SD = 24.27; range, 4–100 per cent). Scores on the hyperacusis questionnaire ranged from 4.76 to 95.24 per cent, with an average score of 42.79 per cent (SD = 23.28).
Regarding audiometric configuration, the criteria of Pan et al.Reference Pan, Tyler, Ji, Coelho, Gehringer and Gogel 32 were adopted. In the current study, only sloping (79.10 per cent) and flat (20.90 per cent) hearing losses were present, although other types of audiometric configuration were not part of the exclusion criteria.
Figure 2 illustrates the average hearing thresholds at all tested frequencies. Pure tone averages at 0.5, 1 and 2 kHz ranged from −3.33 to 61.67 dB HL (average = 13.38 dB; SD = 12.33).
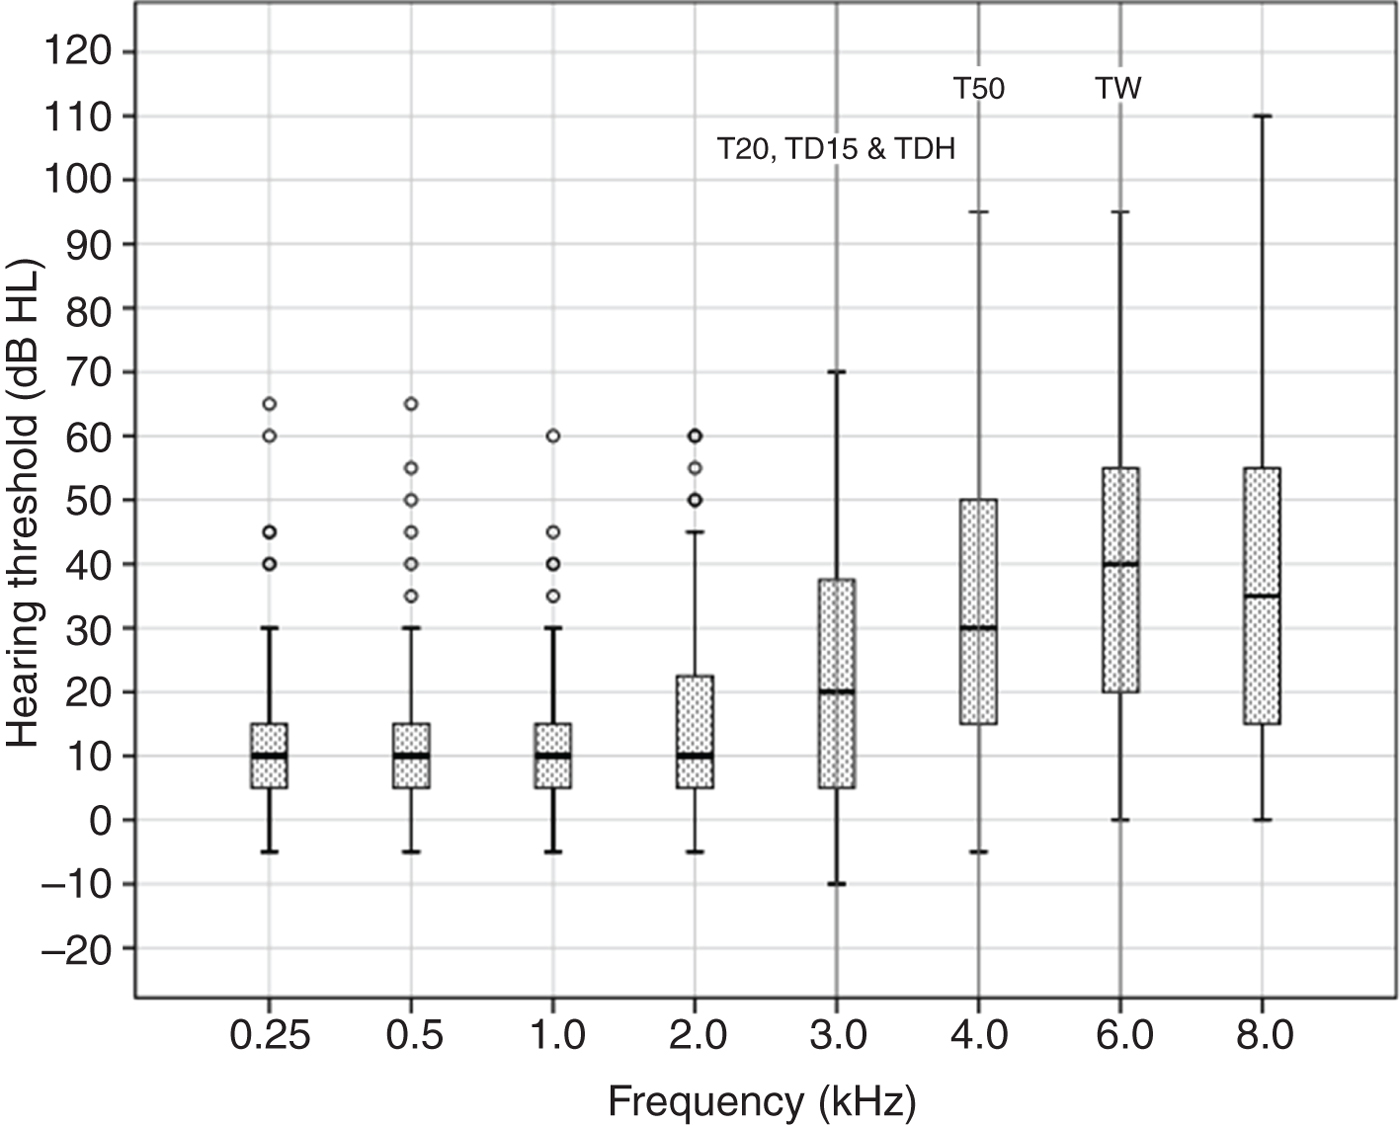
Fig. 2 Box and whisker plot of hearing thresholds at all tested frequencies, with median reference lines for audiometric parameters of: lowest frequencies at which the hearing threshold was at 20 dB HL (T20) and 50 dB HL (T50), lowest frequency at which the threshold difference was more than 15 dB (TD15), lowest frequency with highest threshold difference (TDH), and frequency with worst hearing threshold (TW).
Tinnitus pitch was not significantly different between age groups (F (2, 64) = 0.60; p > 0.05) younger than 31 years (n = 8), between 31 and 50 years (n = 29) and above 50 years (n = 30), nor between tinnitus duration groups (F (3, 63) = 1.31; p > 0.05) less than 1 year (n = 17), between 1 and 5 years (n = 37), between 5 and 10 years (n = 7) and above 10 years (n = 6). There was no statistical significant difference in tinnitus pitch between the four aetiology categories (F (3, 63) = 1.61; p > 0.05). Furthermore, tinnitus pitch did not differ significantly between unilateral versus bilateral or central tinnitus (F (1, 65) = 1.47; p > 0.05), nor between tonal- or noise-like groups (F (1, 65) = 3.08; p > 0.05), or maskable versus non-maskable tinnitus (F (1, 65) = 0.09; p > 0.05). Finally, there was no statistical significant difference in tinnitus pitch between audiometric flat or sloping configurations (F (1, 65) = 3.71; p > 0.05).
With regard to audiometry, descriptive values of edge frequencies, based on audiometric transitions of the lowest frequencies at which the hearing threshold was at 20 dB HL and 50 dB HL, or based on the difference in hearing thresholds between adjacent frequencies (lowest frequencies at which the threshold difference was more than 15 dB and highest threshold difference), or the frequency with the worst clinically abnormal hearing threshold, are given in Table I.
Table I Audiometric parameters and correlations with tinnitus pitch

SD = standard deviation
Not all audiometric parameters could be determined for all ears, with the lowest number of ears represented for the lowest frequency at which the hearing threshold was at 50 dB HL (34.33 per cent). The median was 3 kHz for: the lowest frequency at which the hearing threshold was at 20 dB HL, the lowest frequency at which the threshold difference was more than 15 dB and the lowest frequency with highest threshold difference. The median was 4 kHz for the lowest frequency at which the hearing threshold was at 50 dB HL. The median was 6 kHz for the frequency with worst hearing threshold (see also Figure 2). The minimal value of all audiometric parameters was 0.25 kHz. The maximal value was: 4 kHz for the lowest frequency at which the threshold difference was more than 15 dB, 6 kHz for the lowest frequency at which the hearing threshold was at 20 dB HL and for the frequency with highest threshold difference, and 8 kHz for the lowest frequency at which the hearing threshold was at 50 dB HL and the frequency with worst hearing threshold. The maximum worst hearing threshold was on average 44.70 dB (SD = 22.64; range, 5–110 dB HL).
In more than half of the cases, the tinnitus pitch fell within the frequency range between: the lowest frequency at which the hearing threshold was at 20 dB HL, the lowest frequency at which the threshold difference was more than 15 dB, the lowest frequency with highest threshold difference and the frequency with worst hearing threshold (Table II). Based on the mean hearing thresholds, and the median of hearing thresholds that became clinically abnormal above 2 kHz, a tinnitus pitch to and above 2 kHz was categorised, respectively represented by 26 and 41 ears. Using chi-square tests, it was found that a tinnitus pitch above 2 kHz occurred significantly more within the frequency range between the highest threshold difference (the edge frequency at which the difference in hearing thresholds between adjacent frequencies was higher than all other differences) and the worst hearing threshold (the frequency with the worst clinically abnormal hearing threshold) (χ2 (1) = 9.04, p < 0.01). A comparable effect was also found within the frequency range one frequency below and above the worst hearing threshold (χ2 (1) = 24.21, p < 0.001). These results are reflected in Table II.
Table II Percentages of ears with tinnitus pitch within a specific frequency range

*Indicates statistical significance (chi-square)
The presence of distortion product OAEs (DPOAEs) and the average DPOAE amplitudes at all tested frequencies are reflected in Figure 3a and 3b respectively. The presence of DPOAEs decreased with increasing half-octave frequency bands above 3 kHz. Using ANOVA, no significant differences in DPOAE amplitudes between tonal- or noise-like tinnitus groups at all tested frequencies were found (p > 0.05). Furthermore, DPOAE amplitudes at half-octave frequency bands did not differ significantly between audiometric flat or sloping configurations (p > 0.05).

Fig. 3 (a) Present (filled bars) and absent (dotted bars) distortion product otoacoustic emissions (DPOAEs), and (b) box and whisker plot of DPOAE amplitudes at half-octave frequency bands, with median references lines for the lowest half-octave frequency bands with absent DPOAEs (BA) and worst DPOAE amplitude (AW).
The lowest half-octave frequency band with absent DPOAEs could be determined in 80.60 per cent of the studied population. The median value of this DPOAE parameter was 1 kHz, and ranged between 1 and 4 kHz. The frequency at which the difference in DPOAE amplitude between normative data and present patient DPOAEs was highest could be determined in 85.07 per cent of the studied population. Worst DPOAE amplitudes ranged between 1 and 8 kHz, with a median value of 3 kHz. The median values of lowest half-octave frequency bands with absent DPOAEs and worst DPOAE amplitude are indicated in Figure 3b. Further, the frequency range between the DPOAE edge frequency lowest half-octave frequency band with absent DPOAEs and the frequency with the worst DPOAE amplitudes, and the frequency range below and above the adjacent frequency band with worst DPOAE amplitude, were determined. Tinnitus pitch fell within the frequency range between lowest half-octave frequency bands with absent DPOAEs and worst DPOAE amplitudes, and one half-octave frequency band below and above the frequency band with worst DPOAE amplitude, in 26.83 per cent and 28.07 per cent of the cases, respectively.
Tinnitus pitch and parameters
Simple correlation analysis revealed no significant correlations between tinnitus pitch and audiometric parameters (Table I), nor between tinnitus pitch and DPOAE parameters of lowest half-octave frequency bands with absent DPOAEs (r = −0.16, p > 0.05) or worst DPOAE amplitude (r = −0.15, p > 0.05).
The following audiometric parameters were included in a principal component analysis: lowest frequencies at which the hearing threshold was at 20 dB HL and 50 dB HL, lowest frequency at which the threshold difference was more than 15 dB, lowest frequency with highest threshold difference, and frequency with worst hearing threshold. Because of a high significant correlation between the edge frequencies (based on a threshold difference of more than 15 dB and the highest threshold difference) (r = 0.87, p < 0.05), the lowest frequency at which the threshold difference was more than 15 dB was omitted for further analysis, as this parameter could not be determined for all ears, in contrast to highest threshold difference.
The initial eigenvalues showed that a first factor explained 52.44 per cent of the variance and a second factor explained 30.20 per cent of the variance; hence, a total of 82.64 per cent of the variance was explained by both factors. The first factor had positive loadings for: the lowest frequency at which the hearing threshold was at 20 dB HL (0.87), the lowest frequency at which the hearing threshold was at 50 dB HL (0.86) and the lowest frequency with highest threshold difference (0.77). The second factor had a positive loading for the frequency with worst hearing threshold (0.99), and a negative loading for the lowest frequency at which the hearing threshold was at 20 dB HL (−0.41). Subsequently, a multiple regression analysis with the two derived factors as predictor variables on tinnitus pitch was performed; this resulted in no significant results (F (2, 22) = 1.80; p > 0.05).
Discussion
The relationship between dominant tinnitus pitch and audiometric parameters is the focus of several studies.Reference Henry, Meikle, Gilbert and Hazell 20 – Reference Moore, Vinay and Sandhya 30 , Reference Pan, Tyler, Ji, Coelho, Gehringer and Gogel 32 Distortion product OAEs (DPOAEs), reflecting the integrity of the cochlear outer hair cells, have also been used within this context.Reference Shekhawat, Searchfield and Stinear 31 , Reference Ozimek, Wicher, Szyfter and Szymiec 34 The results of these studies are inconclusive, mainly because they differ in regard to several aspects of the methods.
The tinnitus patient sample size in the literature ranged from as few as 10 to almost 300 subjects, with a median number of around 70 subjects. In the current study, only 1 ear per subject was included, leading to a sample of 67 independent ears. This independence of observations was only taken into account in a few studies.Reference Ochi, Ohashi and Kenmochi 22 , Reference Sereda, Hall, Bosnyak, Edmondson-Jones, Roberts and Adjamian 25 , Reference Pan, Tyler, Ji, Coelho, Gehringer and Gogel 32 Furthermore, some studies only included subjects with tonal-like tinnitusReference Norena, Micheyl, Chery-Croze and Collet 21 , Reference Ochi, Ohashi and Kenmochi 22 , Reference Moore, Vinay and Sandhya 30 or high-frequency sloping hearing losses,Reference Moore, Vinay and Sandhya 30 with a limited range of hearing loss gradesReference König, Schaette, Kempter and Gross 29 , Reference Moore, Vinay and Sandhya 30 leading to subgroups.
In the current study, patients with subjective chronic tinnitus presenting to the otorhinolaryngologist with tinnitus as primary complaint were recruited; the studied sample thus comprised a realistic clinical tinnitus sample. Tinnitus was mostly observed as a bilaterally or centrally located tonal-like, high-pitched, maskable tinnitus, with an average loudness of around 6 dB SL, and the patients mostly had (partially) positive residual inhibition. These characteristics are consistent with the literature.Reference Vernon and Meikle 42 Our patients’ scores on the Tinnitus Handicap Inventory and the hyperacusis questionnaire fell within a wide range, which represents the spectrum of distress with regard to tinnitus and hyperacusis. Furthermore, no subgroups were found in the studied population, as tinnitus pitch was not significantly different between age, tinnitus duration, tinnitus localisation or tonality subgroups. In addition, tinnitus pitch did not differ significantly between: cases with maskable versus non-maskable tinnitus, aetiology groups, nor cases with audiometric flat or sloping configurations.
Tinnitus pitch can be determined using a two-alternative forced-choice procedure in combination with an octave confusion test, or by using tinnitus likeness spectrum ratings. The latter technique is used to evaluate which individual frequencies contribute to the tinnitus percept, leading to a tinnitus spectrum, whereas pitch matching results in a single frequency. However, no significant differences in tinnitus pitch between both techniques have been found;Reference Basile, Fournier, Hutchins and Hebert 45 therefore, the conclusions regarding the relationship between tinnitus pitch and audiometry is assumed not to be dependent on the technique used.
In the current study, tinnitus pitch matching was chosen because it might be more feasible within a clinical setting. Nevertheless, this technique resulted in variable degrees of test–retest reliability,Reference Mitchell, Vernon and Creedon 41 , Reference Nageris, Attias and Raveh 46 as the tinnitus pitch might, amongst other factors, be susceptible to adaptation by applying an external tone, and to variations in time in the case of fluctuating tinnitus pitch. In the current study, pitch matching was performed using a contralateral stimulus, which avoids an interaction between tinnitus pitch and the stimulus,Reference Mitchell, Vernon and Creedon 41 and none of our subjects reported a fluctuating tinnitus pitch. Furthermore, matching was repeated until the tinnitus resembled the matched stimulus, with a score of at least 7 out of 10. In the literature, however, tinnitus pitch matching often did not exceed 8 kHz,Reference Schecklmann, Vielsmeier, Steffens, Landgrebe, Langguth and Kleinjung 28 , Reference Pan, Tyler, Ji, Coelho, Gehringer and Gogel 32 which might be too limited, or no octave confusion test was explicitly performed, introducing more variability in the tinnitus pitch matching.Reference Moore, Vinay and Sandhya 30
Another aspect leading to inconsistent results in the literature are the audiometric parameters used, which mostly included the audiometric edge frequency and the frequency of maximum hearing loss. However, the edge could be the audiometric frequency at which a transition from normal hearing to hearing impairment occurred,Reference Sereda, Hall, Bosnyak, Edmondson-Jones, Roberts and Adjamian 25 , Reference Sereda, Edmondson-Jones and Hall 27 , Reference Shekhawat, Searchfield and Stinear 31 or that from outer to inner hair cell loss,Reference Sereda, Edmondson-Jones and Hall 27 , Reference Shekhawat, Searchfield and Stinear 31 or could be based on the difference in hearing threshold between adjacent frequencies.Reference Moore, Vinay and Sandhya 30 , Reference Pan, Tyler, Ji, Coelho, Gehringer and Gogel 32
In the current study, several parameters were calculated to define the edge frequency, in order to provide a comprehensive overview. Furthermore, DPOAEs were evaluated not only in terms of presence or absence, as in Shekhawat et al.,Reference Shekhawat, Searchfield and Stinear 31 but also using DPOAE responses based on normative values,Reference Keppler, Dhooge, Corthals, Maes, D'haenens and Bockstael 44 which could provide more in-depth information on outer hair cell integrity. To our knowledge, the evidence available on the relationship between tinnitus pitch and DPOAE amplitudes is limited;Reference Ozimek, Wicher, Szyfter and Szymiec 34 therefore, the current study adds valuable information.
Finally, studies that use only correlation coefficients to explore the relationship between tinnitus pitch and audiometric parameters, which may be intercorrelated, in the whole group and in (un)planned subgroups,Reference Heijneman, de Kleine, Wiersinga-Post and Van Dijk 26 , Reference Schecklmann, Vielsmeier, Steffens, Landgrebe, Langguth and Kleinjung 28 – Reference Pan, Tyler, Ji, Coelho, Gehringer and Gogel 32 introduce type I statistical errors. In the current study, simple and multiple regression analyses were performed after principal components analysis was conducted on the whole group data, to avoid multiple comparisons within the group and collinearity between audiometric parameters.
The current study examined the relationship between dominant tinnitus pitch and several parameters of audiometry and DPOAEs in one ear per subject of a representative group of patients with subjective chronic tinnitus. No significant correlation between dominant tinnitus pitch and the frequency representing an audiometric edge or worst hearing level was found using simple and multiple regression analyses. This is in contrast with previous findings of König et al.,Reference König, Schaette, Kempter and Gross 29 Moore et al.,Reference Moore, Vinay and Sandhya 30 Schecklmann et al.Reference Schecklmann, Vielsmeier, Steffens, Landgrebe, Langguth and Kleinjung 28 and Shekhawat et al.Reference Shekhawat, Searchfield and Stinear 31 However, tinnitus pitch mostly fell within the frequency range of hearing loss, that is, between the edge frequencies representing the lowest frequency at the transition from normal to abnormal hearing (lowest frequency at which the hearing threshold was at 20 dB HL), and edge frequencies based on the differences in hearing thresholds between adjacent frequencies (lowest frequencies at which the threshold difference was more than 15 dB or highest threshold difference) on the one hand and the frequency with the worst clinically abnormal hearing threshold on the other.
In addition, no significant correlation was found between tinnitus pitch and the edge frequency (lowest half-octave frequency band with absent DPOAEs), based on the transition from present to absent DPOAEs or the frequency with worst DPOAE amplitude. Tinnitus pitch fell in about one-quarter of the cases in the frequency range of reduced DPOAEs. However, 2f1-f2 distortion product grams were measured with a clinical protocol, using eight points per octave, and fixed primary tone levels L1 and L2 of 65 and 55 dB SPL respectively. As such, DPOAE fine structure or growth functions, which may provide more information regarding the relationship between tinnitus pitch and DPOAE parameters, could not be analysed, which is a limitation of the current study. However, the number of ears with absent DPOAEs increased from half-octave frequency band 3 kHz; DPOAE testing thus remains useful in ears with tinnitus to indicate outer hair cell integrity.
Tinnitus pitch was expected to be useful to evaluate the neurophysiological mechanisms of tinnitus perception. Peripheral deafferentation, demonstrated with audiometry, or with absent or abnormal OAEs in normal hearing subjects,Reference Dhar, Hall, Hall and Ramachandran 33 initially results in an increase in spontaneous firing rate and neuronal synchronous activity along the auditory pathway.Reference Elgoyhen, Langguth, De Ridder and Vanneste 18 Based on the homeostatic plasticity model,Reference Schaette and Kempter 11 tinnitus perception is explained by the increase in noiseReference Norena 13 , Reference Zeng 14 to maintain a stable neuronal function.Reference Turrigiano 12 These mechanisms, resulting in neural gain changes, can also occur in the absence of hearing loss.Reference Eggermont 10 The increase in synchronous activity occurs in the region of the auditory cortex responsible for the range of frequencies within the hearing loss.Reference Norena and Eggermont 19 Therefore, the perceived tinnitus frequency would lie within the frequency range of hearing loss.Reference Schaette and Kempter 11 Subsequently, a reorganisation of the tonotopic map occurs,Reference Rauschecker 15 where an over-representation of neuronal activity at the transition region forms normal to impaired hearing in the auditory cortex,Reference Gerken 16 leading to the perception of tinnitus. As a consequence, the perceived tinnitus frequency would be related to the edge of hearing loss.Reference Eggermont 10
-
• The relationship between dominant tinnitus pitch and audiometry remains controversial
-
• Information regarding distortion product otoacoustic emissions (DPOAEs) and tinnitus pitch is scarce
-
• The relationship between tinnitus pitch and parameters of audiometry and DPOAEs was investigated
-
• Appropriate statistical tests were used in a representative sample of patients with subjective chronic tinnitus
-
• The findings confirmed a relationship between tinnitus pitch and frequency range of hearing loss
-
• The results seem to support the homeostatic plasticity model in tinnitus perception
The results of the current study confirm those of previous studies wherein a relationship between tinnitus pitch and the frequency range of hearing loss was found.Reference Henry, Meikle, Gilbert and Hazell 20 – Reference Sereda, Edmondson-Jones and Hall 27 The results of the current study seem to support the model of homeostatic plasticity in the perception of tinnitus. However, further research should focus on the development of tinnitus, by gaining insight in the differences between subjects with and without tinnitus with comparable audiometric results. This could be supported by experimental imaging studies exploring neural plasticity in auditory and non-auditory areas such as the attentional network. Furthermore, these studies should be linked with the results of intervention strategies restoring cochlear input, such as hearing aids and cochlear implants, and neuromodulation techniques as well.
Acknowledgement
The valuable comments of A Deklerck on the manuscript are greatly appreciated.


