


Introduction
The tegmen is a bony plate that separates the intracranial contents of the middle fossa from middle- and inner-ear structures.Reference Hoang, Ortiz Torres, Rivera and Litofsky1 When a tegmen defect exists in the lateral skull base, this establishes an abnormal connection that promotes the potential development of numerous pathological conditions, including cerebrospinal fluid (CSF) leak, encephalocele, hearing loss and otogenic meningitis.Reference Sönmez, Şahin, Polat, Çomoğlu and Orhan2 These conditions are difficult to manage, as the type of treatment required for resolution may vary significantly based on the location and size of the skull base defect.Reference Sönmez, Şahin, Polat, Çomoğlu and Orhan2 If we can better understand the multifactorial processes that lead to spontaneous tegmen erosion, we may be able to develop more targeted medical and surgical treatment plans for patients who suffer from the subsequently ensuing pathologies.
Skull base CSF leaks are classified based on aetiology. A CSF leak can be spontaneous, congenital or iatrogenic, or arise as a result of trauma or tumour erosion.Reference Phang, Whitehouse, Lee, Khalil, McArdle and Whitfield3 Currently, there are conflicting reports on the various factors that are suspected to increase risk for the development of spontaneous CSF otorrhoea; however, it is reportedly correlated with attenuation of the tegmen by previous studies.Reference Stevens, Lambert, Rizk, McIlwain, Nguyen and Meyer4 Here, we seek to better understand factors that may or may not be affecting the process of tegmen attenuation.
The rate of spontaneous tegmen dehiscence is increasing within our patient populations.Reference Schievink, Maya, Jean-Pierre, Nuño, Prasad and Moser5,Reference Nelson, Gantz and Hansen6 Some have attributed this to a rise in the obesity epidemic within the past decades, which carries increased risk for a list of disease states including, but not limited to, elevated blood pressure, idiopathic intracranial hypertension and cardiovascular disease, all of which may affect CSF resorption in a multifactorial fashion by affecting hydrostatic forces and venous pressure. Handzel et al. recently reported that tegmen attenuation in patients with idiopathic intracranial hypertension is progressive, suggesting that a multifactorial process over time contributes to attenuation.Reference Handzel, Brenner-Ullman, Niry, Neuman, Cavel and Ungar7
Spontaneous CSF otorrhoea presents with a bimodal age distribution, as most cases cluster to either young paediatric patients or adult patients in their fourth or fifth decade of life, and presentations can vary significantly.Reference Schievink, Maya, Jean-Pierre, Nuño, Prasad and Moser5 Children frequently present with recurrent episodes of meningitis, while adults frequently have conductive hearing loss and middle-ear effusion.Reference Taylor, van der Meer, Perry, Best and Webb8 For adults, there are two ‘progressive theories’ on the possible cause of spontaneous CSF otorrhoea. One theory suggests that tegmen attenuation is a chronic process caused by elevated intracranial pressure, which itself is linked to obesity and idiopathic intracranial hypertension.Reference Kuo, Bagwell, Mongelluzzo, Schutt, Malhotra and Kveton9 The other theory is that the lateral skull base sustains chronic erosive changes caused by aberrant arachnoid granulations.Reference Remenschneider, Kozin, Curtin and Santos10 We propose there may be other underlying processes affecting tegmen integrity, which are yet to be understood.
Previous studies have linked factors such as obesity, obstructive sleep apnoea and idiopathic intracranial hypertension to tegmen attenuation. However, other reports have refuted these same factors as having no involvement in chronic or progressive tegmen thinning.Reference Rabbani, Saltagi and Nelson11,Reference Rabbani, Saltagi, Ye, Patel, Manchanda and Nelson12 Some authors have reported obesity to be a main contributor, while others have reported no significant differences in tegmen status between obese and non-obese patients.Reference Hatch, Schopper, Boersma, Rizk, Nguyen and Lambert13 One apparent issue among many of these previous claims is that they were based only on a qualitative analysis of the tegmen in various patient groups.
Improvements in image resolution technology have allowed more direct radiological quantitative analysis of the tegmen in recent years, which may enable a better understanding of tegmen changes throughout life. Here, we seek to lay a better foundation for quantitative tegmen analysis, in order to promote a more comprehensive understanding of the relationship between tegmen bone mineral density and factors including age, body mass index (BMI) and hypertension. Our study analysed tegmen plate bone mineral density using Hounsfield units, which have been proven to be a reliable correlate of bone mineral density.Reference Schreiber, Anderson and Hsu14
Materials and methods
Group selection
We completed a retrospective case–control series from 2015 to 2019. Approval was obtained from our institutional review board prior to conducting the study. Patient consent was deemed not to be required through the institutional review board review process, as our study did not: directly affect patient care outcomes in any way, have any potential to harm patients, or release any identifiable patient-specific information or images.
Our study included patients aged over 18 years, with no history of prior ear surgery, and with available high-resolution, fine-cut computed tomography (CT) scans of the temporal bone. We identified two clinical groups from our departmental cochlear implant database: obese (case cohort) and non-obese (control cohort). Body mass index was used to define obesity categorisation. The Centers for Disease Control and Prevention has defined BMI classes: including overweight (BMI = 25–29.9 kg/m2), class one obesity (BMI = 30–34.9 kg/m2), class two obesity (BMI = 35–39.9 kg/m2), and class three or severe obesity (40 kg/m2 or higher).15 We assigned patients to the obese group if their BMI was 30 kg/m2 or greater. In order to account for age, gender, race, smoking status and medical co-morbidities, we then selected sequential matched controls whose BMI was under 30 kg/m2, for the control group. Children, prisoners, patients with a history of or with active middle-ear disease, temporal bone trauma, or prior otological surgery, and patients who had poor-quality CT scans of the temporal bones, were all excluded from this study.
Imaging and hardware
All patients underwent dedicated CT scanning of the temporal bone with standard collimation of 0.60 mm. Images were reconstructed in the axial, coronal and sagittal planes. The majority of scans were obtained on-site at our facility using a 64-slice GE Lightspeed VCT CT system or a Siemens 64 Somatom (64-slice) system (Siemens Medical Solutions), with spatial resolution accurate to 0.1 mm.
Software-reformatted images were observed by reviewers using GE Healthcare Centricity® picture archiving and communication system client. Images were analysed on radiology workstation computers with Eizo RadiForce RX360 monitors, at a native resolution of 1536 by 2048 pixels. Bone mineral density was assessed using the Centricity elliptical region of interest Hounsfield unit average measuring device.
Bone mineral density algorithm
This section concerns the development of a refined novel bone mineral density measurement algorithm for quantitative tegmen analysis.
Three physicians at various levels of training were randomly asked to participate as image reviewers. Reviewers were blinded to all clinical data, such that they were only able to review CT images but no clinical data prior to the completion of reviews of all cases. A third-year otolaryngology resident and two different radiology senior residents analysed all images independently. Reviewers completed a training module on how to accurately obtain Hounsfield unit measurements on CT scans using the Hounsfield units average measurement device; subsequently, all reviewers went through four example cases together prior to their respective blinded analysis.
Each reviewer was instructed to obtain and record 14 Hounsfield unit measurements per patient, including 6 from right tegmen, 6 from left tegmen and 1 from each otic capsule. In order to complete this, a refined measurement algorithm was developed, which focused specifically on areas of pathophysiological interest, while also accounting for variable pneumatisation patterns.
Tegmen tympani
Measurements of the tegmen tympani were obtained by locating the single best coronal image cut that revealed the malleolar–incudal complex plus at least two cochlear turns. Once this cut was identified, measurements were obtained from the most and least dense points of the tegmen tympani, as well as at a standard tegmen tympani point located directly superior to the ossicular complex (Figure 1a). There were several local areas of severe demineralisation identified by negative Hounsfield unit measurements; a minimum value of 30 Hounsfield units was entered into our database at these locations to correlate with the average density of the surrounding soft tissue.
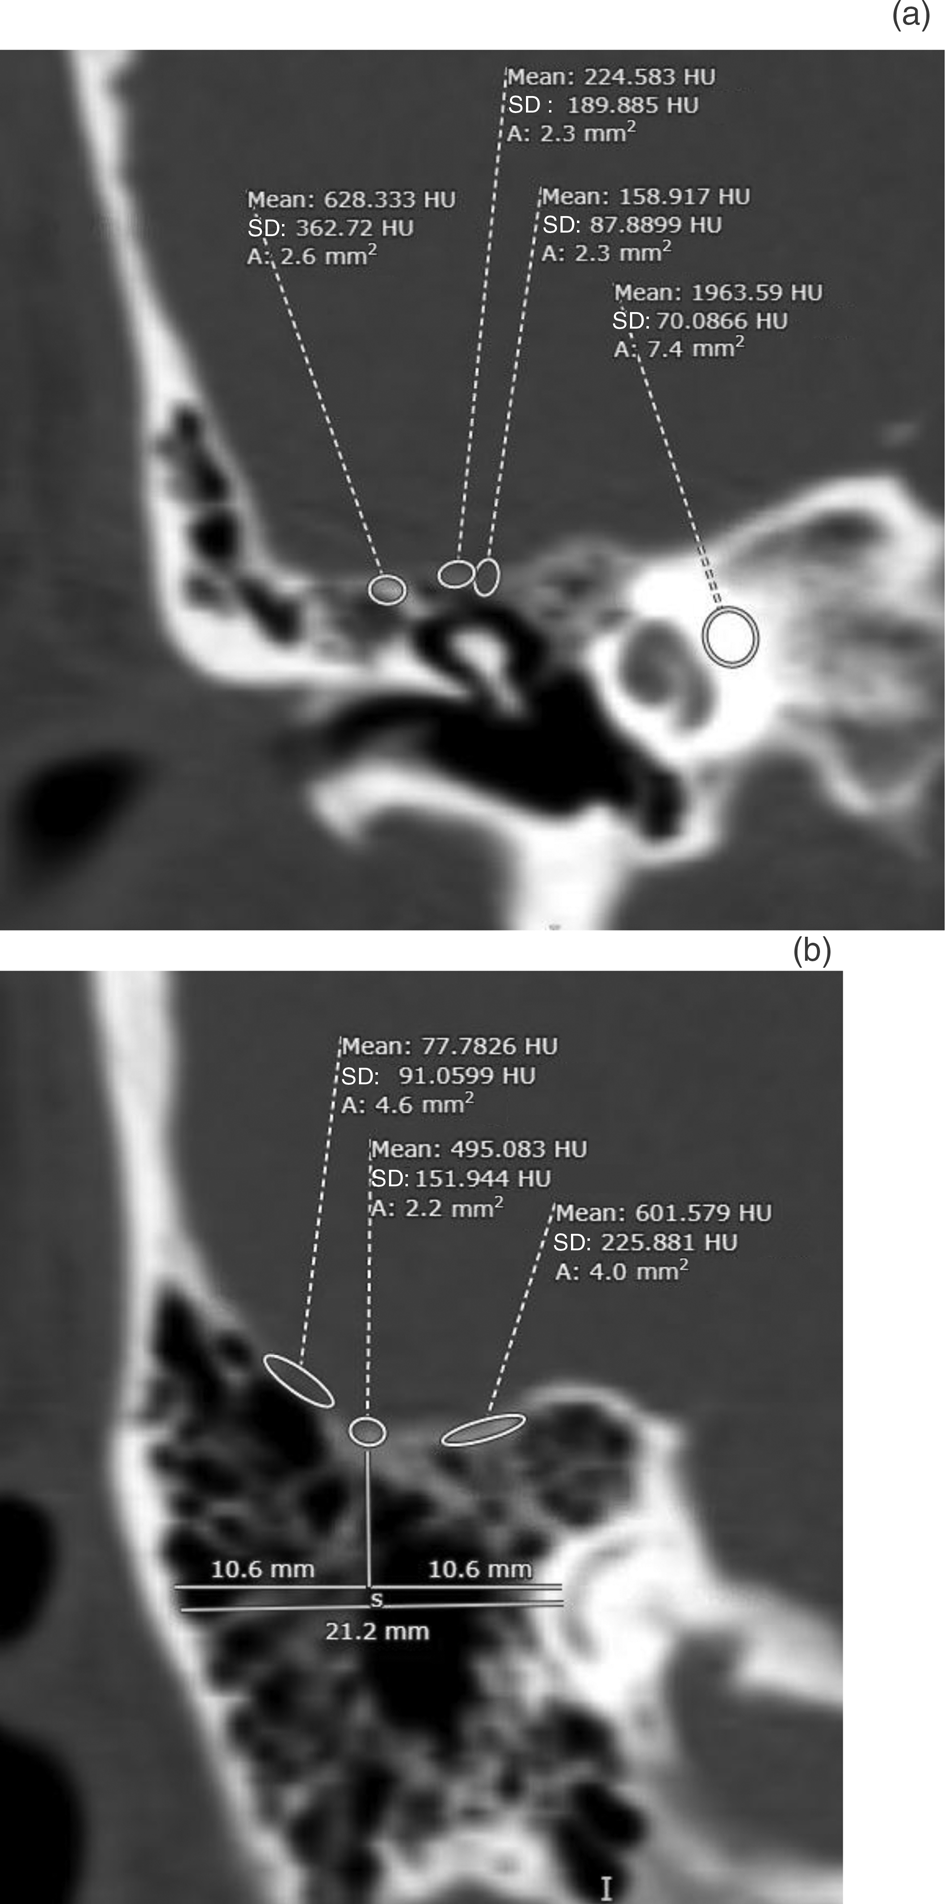
Fig. 1. (a) Three example measurement points are shown for the tegmen tympani. In this example, the leftmost tegmen point is the most dense tegmen measurement; the middle is the standard point situated to account for variations in attic height and/or pneumatisation between patients. The rightmost tegmen point is the least dense, as signified by the lowest Hounsfield units. The fourth point (far right of the image) is right otic capsule bone mineral density, which was used as a standard comparison between reviewers. (b) Three example measurement points are shown for the tegmen mastoideum. In this example, the leftmost tegmen point is the least dense tegmen measurement, the middle is the standard point and the rightmost tegmen area is the most dense, as indicated by the highest Hounsfield units. Measurements shown below the tegmen plate were used to find a standardised midpoint for comparison, while accounting for variable pneumatisation patterns. HU = Hounsfield units; SD = standard deviation
Tegmen mastoideum
Measurements of the tegmen mastoideum were conducted by locating the single best coronal image cut that revealed the lateral-most curvature of the posterior semicircular canal. Once this cut was identified, measurements were obtained from the most and least dense points of the tegmen mastoideum, as well as a standard tegmen mastoideum location, which was found at the midpoint of a horizontal line starting from mastoid cortex and ending at the posterior semicircular canal (Figure 1b). The established tegmen bone mineral density minimum of 30 Hounsfield units was applied, as described above.
Total tegmen bone mineral density
The data points were combined to obtain the total tegmen bone mineral density. Specifically, the three Hounsfield unit data points from the tegmen tympani right side were averaged together with the three data points from the tegmen tympani left side to obtain the tegmen tympani value. The same procedure was completed for the tegmen mastoideum right side and tegmen mastoideum left side to obtain the tegmen mastoideum value. The tegmen mastoideum and tegmen tympani values were then averaged to obtain the total average tegmen bone mineral density.
Statistical analysis and reporting
Inter-rater reliability was assessed between the three blinded image reviewers. The intraclass correlation co-efficient (κ) was used for validation of inter-rater agreement (Table 1). All datasets were tested for normality using the Kolmogorov–Smirnov test. Continuous variables with a normal distribution were reported as mean (standard deviation), while any abnormally distributed datasets were reported as median (range). A p-value of less than 0.05 was deemed to be statistically significant. Nominal variables in the demographics table were expressed as frequency (percentage) and were compared using the Fisher exact test. Continuous variables were compared using the independent t-test, or Mann–Whitney U test where indicated for any abnormal dataset distribution.
Table 1. Degree of agreement between raters

The intraclass correlation co-efficient (κ) was used to assess the inter-rater reliability between physicians; prior studies have reported that an adequate strength of agreement occurs when κ is at least greater than 0.7.
Effect size (η2) of obesity on tegmen bone mineral density was calculated with univariate analysis by one-way analysis of variance with partial eta squared (η2) (Table 2). A linear regression model was used to identify any correlations between tegmen bone mineral density and BMI, age or number of blood pressure medications being taken by the patients in our study.
Table 2. Effect size explained by partial eta squared

In this study, partial η2 was used to measure the size of the effect that obesity had on tegmen bone mineral density.
All statistical calculations were performed using IBM SPSS® software, version 24.0. The Strengthening the Reporting of Observational Studies in Epidemiology (‘STROBE’) guidelines were followed for the reporting of clinical and demographic data.
Results
Patient demographics
Fifty patients met the inclusion criteria, 23 in the obese group and 27 in the non-obese control group. There were no significant differences between cohorts after matching (Table 3).
Table 3. Demographics of obese group and matched non-obese controls

Those with a body mass index of 30 kg/m2 or greater were randomised to the obese group. Matching was completed between cohorts to account for age, gender, smoking status, and hypertension requiring medical therapy. There were no significant differences between each cohort after matching. SD = standard deviation
Inter-rater reliability assessment
The intraclass correlation co-efficient was used to assess the inter-rater reliability between image reviewers in order to validate the measurement algorithm. The strength of agreement between reviewers in our current study was ‘strong’ to ‘near complete’ for all comparisons (κ = 0.75–0.86) (Table 4).
Table 4. Comparison of bone mineral density between groups

Measurements of the tegmen tympani, tegmen mastoideum, tegmen total and otic capsule were completed by three different physicians, each at different levels of training. The intraclass correlation co-efficient (κ) was used to assess the inter-rater reliability between physicians, which is interpreted as follows: reliability between raters is ‘strong’ if κ is between 0.6 and 0.8, or ‘near complete’ if κ is greater than 0.8. There were no significant differences in tegmen bone mineral density between the groups. The size of the effect of obesity on tegmen bone mineral density was found to be small at all tegmen areas compared. BMD = bone mineral density; SD = standard deviation; HU = Hounsfield units
Tegmen bone mineral density and obesity
No significant differences were found in tegmen bone mineral density between obese patients (BMI of 30 kg/m2 or greater) and non-obese patients (BMI of less than 30 kg/m2) on multivariate analysis (p = 0.71) or on mean comparison testing (p = 0.95). The effect size of obesity on tegmen bone mineral density was small (η2 = 0.005, p = 0.64) (Table 4 and Figure 2).

Fig. 2. Results of mean comparison testing between obese and non-obese patients for: (a) tegmen tympani bone mineral density (p = 0.48); (b) tegmen mastoideum bone mineral density (p = 0.95); (c) total tegmen bone mineral density (p = 0.95); and (d) otic capsule bone mineral density, which was used as a standard for comparison between reviewers (p = 0.48). BMD = bone mineral density; HU = Hounsfield units
Patients with class two obesity or higher (BMI of 35 kg/m2 or greater) were then compared with the rest of the study population (BMI of less than 35 kg/m2). There were no significant differences in the tegmen bone mineral density between the groups (p = 0.50).
Linear regression modelling
Linear regression modelling of our entire study population revealed a positive correlation between the number of blood pressure medications that each patient was taking for hypertension and bone mineral density of the lateral skull base, although this did not reach statistical significance (B = 0.134, p = 0.60). Age was found to have a negative correlation with tegmen bone mineral density (B = −0.23, p = 0.60), and BMI was found to have no correlation (Figure 3).

Fig. 3. Linear regression analysis was used to identify any clinical or demographic patient factors that correlated with tegmen bone mineral density. Tegmen bone mineral density had: (a) a positive correlation with the number of blood pressure medications taken for hypertension, and (b) a negative correlation with age. (c) There was little to no correlation between tegmen bone mineral density and body mass index. BMD = bone mineral density; HU = Hounsfield units; BMI = body mass index
Discussion
Our data demonstrate that a radiological measurement algorithm can be utilised by physicians at various levels of training and in multiple disciplines for tegmen analysis. Prior studies have reported that an inter-rater agreement greater than 0.7 is adequate for statistical comparison, and our inter-rater reliability was well above that, in the ‘strong’ to ‘near complete’ range.Reference Stevens, Lambert, Rizk, McIlwain, Nguyen and Meyer4 This validates and confirms the functionality and reproducibility of our refined measurement algorithm for the analysis of tegmen bone mineral density. This algorithm has the potential to improve the foundation of quantitative and clinically relevant tegmen analysis by allowing clinicians to readily assess tegmen status in any patient who has undergone CT of the temporal bone.
Interestingly, the prevalence of hypertension, smoking and ‘White’ race was somewhat higher in our study population compared with other reports. The regional patient population that we serve may explain this; however, this disparity may need to be directly investigated in order to draw any conclusions. The relatively high number of smokers, relatively low number of African Americans and increased prevalence of hypertension may reflect the unique patient population that receives treatment for hearing loss at our tertiary care centre. Interestingly, epidemiological studies have reported a decreased prevalence of hearing loss in African Americans compared with White individuals; however, the exact cause has yet to be identified. We propose there may be racial disparity inherent in the diagnosis and/or treatment of hearing loss, which requires further investigation.
Of the few previous tegmen measurement algorithms that have been reported, only one has focused on tegmen bone mineral density.Reference Hatch, Schopper, Boersma, Rizk, Nguyen and Lambert13 Our measurement algorithm is different from that one in that we designed ours to focus specifically on areas of potential pathophysiology. In contrast, previous algorithms have taken a broader measurement of the tegmen as a whole. We did not find any significant differences in bone mineral density between obese and non-obese patients, in agreement with one previous quantitative study by Hatch et al. from 2018, which reported no difference in bone mineral density of the lateral skull base as it relates to obesity or spontaneous CSF otorrhoea compared with normal-weight controls.Reference Hatch, Schopper, Boersma, Rizk, Nguyen and Lambert13 To date, the Hatch et al. study remains the only published study on the quantitative analysis of tegmen bone mineral density.
Currently, a total of three other reported studies exist on quantitative tegmen analysis; however, conflicting claims from these studies have made clinical information difficult to reconcile. The first was a study from 2015 by Stevens et al., where tegmen thickness was measured in millimetres.Reference Stevens, Lambert, Rizk, McIlwain, Nguyen and Meyer4 They reported that skull base attenuation was significantly correlated with obesity and with spontaneous CSF otorrhoea. Subsequently, in 2016, Rizk et al. reported that patients with superior semicircular canal dehiscence have marked thinning of the lateral skull base, greater than in those with obesity or spontaneous CSF otorrhoea, suggesting that underlying processes other than obesity are affecting tegmen integrity as an independent factor.Reference Rizk, Hatch, Stevens, Lambert and Meyer16 Finally, in 2020, Handzel et al. reported a progression in tegmen attenuation seen in patients with idiopathic intracranial hypertension over time, further hinting at the possibility of other underlying processes at play.Reference Handzel, Brenner-Ullman, Niry, Neuman, Cavel and Ungar7 Recent studies have demonstrated that although obesity may promote increased bone mineral density in the axial skeleton, the health and status of the denser bone may be poor as a result of hormonal imbalances that affect osteoblast and osteoclast function and regulation.Reference Shapses, Pop and Wang17 This information as a whole does not implicate any single independent factor as a main effector of tegmen integrity, and we propose there may be underlying multifactorial processes yet to be uncovered.
• Prior studies have reported lateral skull base thinning in relation to obesity, but most of these were qualitative
• A novel, refined, quantitative measurement algorithm for assessment of lateral skull base bone mineral density was developed and validated
• There were no significant differences in bone mineral density between obese and non-obese patients
• The number of active blood pressure medications correlated positively with lateral skull base bone mineral density
• It is proposed that other underlying processes affect tegmen demineralisation independently of obesity, possibly congenital predispositions that become uncovered by a chronic tegmen insult
Here, we demonstrate that although obesity may be related to idiopathic intracranial hypertension, it is not a major independent contributor to tegmen demineralisation. We propose that there are possible congenital or genetic predispositions that may affect bone development, quality, and/or health throughout life, causing loss of the tegmen integrity, and thus predisposing to breakdown by one of the two ‘progressive theories’ mentioned earlier. The underlying predisposition may only become uncovered in certain patients who sustain a chronic progressive tegmen insult over time, in the form of hydrostatic pressure changes secondary to medical co-morbidities including, but not limited to, cardiovascular disease.
Linear regression modelling of the entire study population interestingly revealed that tegmen bone mineral density increased with the number of blood pressure medications that each patient was actively taking for treatment of their hypertension. This is supported by previous reports, which have demonstrated an increase in bone mineral density in patients on angiotensin-converting enzyme inhibitor therapy, and a report indicating that thiazide diuretic therapy leads to protection from loss of bone mineral density.Reference Barzilay, Davis, Pressel, Ghosh, Puttnam and Whelton18,Reference Zhang, Li, Sha, Shu, Zhai and Wang19 These processes may be related to alterations in calcium–vitamin D homeostasis and/or changes in regulatory factors that affect bone turnover.Reference Zhang, Li, Sha, Shu, Zhai and Wang19 This association requires further study in the setting of lateral skull base analysis.
Conclusion
We have developed a refined, quantitative measurement algorithm for tegmen bone mineral density analysis. Our findings suggest poor correlation between obesity and tegmen bone mineral density, which indicates there are other processes that must be uncovered through further investigation.
Competing interests
None declared


