


Introduction
The normal respiratory, phonatory and swallowing functions of the larynx require an intact cricoarytenoid joint. The cricoarytenoid joint is a synovial joint supported by a cricoarytenoid ligament.Reference Zan, Yousem and Aygun1 Arytenoids have rocking (anteroposterior), gliding (lateromedial) and rotatory movements over the cricoid.
Arytenoid adduction plays a crucial role in producing normal voice by its anteromedial inferior displacement termed ‘positive pitch’.Reference Husseini, Ashkar, Halawi, Sibai and Hamdan2 This movement of arytenoids pulls the vocal folds medially and brings them together. Adequate voice production requires the medial approximation of vocal folds and their proper vertical and horizontal alignment.Reference Hamdan, Nassar, Ashkar and Sibai3,Reference Bonilha, O'Shields, Gerlach and Deliyski4
If one arytenoid is anterior to the other during adduction, the vocal fold will become less tense with more pliable tissue and at a lower position than the other vocal fold, resulting in disequilibrium and abnormal vibration. Arytenoid adduction asymmetry is not a rare entity in patients presenting in a laryngology clinic. Asymmetry during adduction can be either physiological (innocent) or pathological. Some pathologies that can be correlated with this finding are vocal fold paresis or palsy, dislocation or fixation of the cricoarytenoid joint. As there are very few studies described in the literature about the clinical implications of arytenoid adduction asymmetry or overriding arytenoid in normophonic patients, we undertook this study to determine the incidence of arytenoid adduction asymmetry and identify its association with demographic characteristics.
Materials and methods
This study was a retrospective observational clinical study conducted in a group of patients who presented with problems while singing but had a normal speaking voice. Data from the medical records of 347 adults of both sexes who came for evaluation of singing voice over a period of four years (from March 2016 to April 2019) in the senior author's voice clinic were analysed.
As it was practically difficult to get an adequate number of normophonic patients to do flexible laryngoscopy, we collected the medical records of this group and excluded the following groups: (1) those who had a previous history of laryngeal trauma, chronic inflammatory diseases, neck irradiation or any recent history of upper respiratory infections; (2) those who had even the mildest speaking voice problem; (3) those who were below 18 and above 45 years of age; and (4) those who had recordings with signs of vocal fold paresis such as phonatory gap, asymmetric ventricles or unilateral ventricular band adduction.
Patients had undergone assessment and management earlier, according to the standard protocols of the department. This included history recording, clinical examination and flexible endoscopic evaluation of the larynx. Consent was taken from all patients who underwent a flexible laryngoscopic video examination using a Kay Pentax (Montvale, USA) 3.2 size chip on tip camera endoscope, and the video recordings were obtained. In all patients, 10 per cent lignocaine spray was used to suppress the gag reflex. Laryngoscopy was recorded during inspiration while doing sustained phonation of the vowel ‘ee’ at a comfortable pitch and loudness and not while singing.
The recorded videos were reviewed, and still images were chosen based on maximal adduction of arytenoid cartilages and with the least obstructed view of features of interest like cuneiform, corniculate, aryepiglottic folds and vocal folds up to the anterior commissure (Figure 1). All the demographic details were noted. The static laryngoscopy images were reviewed and arytenoid adduction asymmetry was rated with its side and severity in a datasheet (Figure 2) by two trained laryngologists independently. In order to obtain intra-rater reliability, 20 per cent of the images were randomly repeated. Adduction asymmetry was rated according to the cross-over of one arytenoid complex to the other side, in terms of the position of the corniculate cartilage in relation to the cuneiform cartilage of the opposite side.
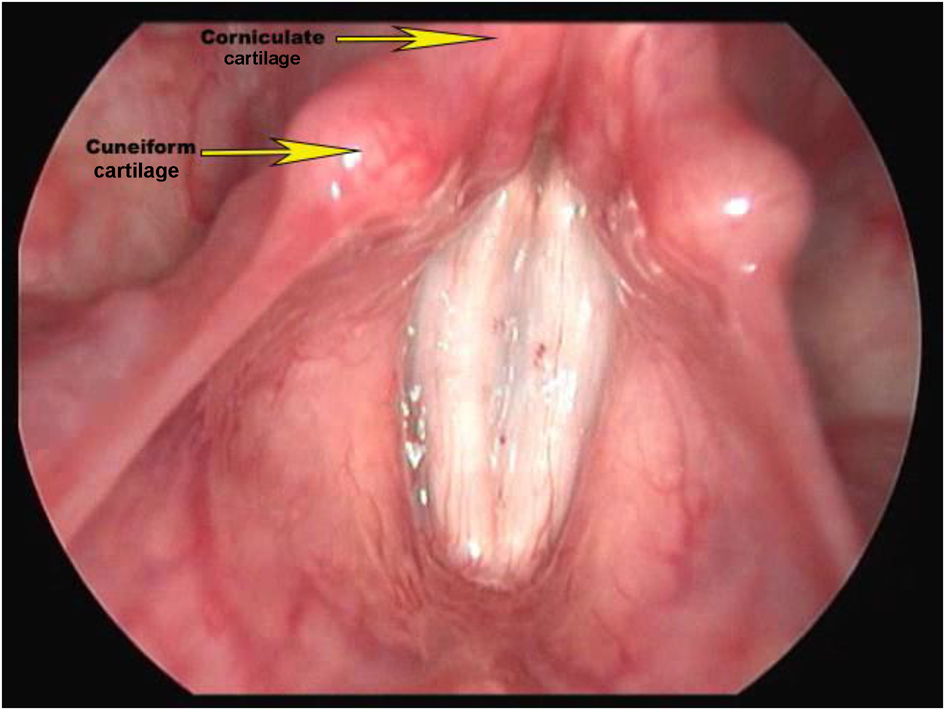
Fig. 1. Endoscopic view of normal laryngeal inlet while adducting: symmetry of inlet is well seen.

Fig. 2. Proforma used for collecting data. no = number; AAA = arytenoid adduction asymmetry; R = right; L = left
Grading of the asymmetry was performed as: 1 = mild or grade 1 (Figure 3), with corniculate touching the posterior aspect of the opposite cuneiform; (2) moderate or grade 2 (Figure 4), with corniculate touching the middle part of the opposite cuneiform; and (3) severe or grade 3 (Figure 5), with corniculate touching the cuneiform of the opposite side in its anterior aspect. Statistical analysis was performed using SPSS® statistical software (version 20.0). Analysis was performed using the Pearson chi-square test, Z test and Mann–Whitney U test. A p-value of less than 0.05 was considered significant. Inter-observer reliability was determined using kappa statistics, as described by Fleiss (with Reliability Calculator (‘ReCal’) software).Reference Fleiss5,Reference Freelon6

Fig. 3. Endoscopic view of laryngeal inlet with grade 1 arytenoid adduction asymmetry. The right corniculate is touching the left cuneiform in its posterior aspect.

Fig. 4. Endoscopic view of laryngeal inlet with grade 2 arytenoid adduction asymmetry. The right corniculate is touching the left cuneiform in its middle part.
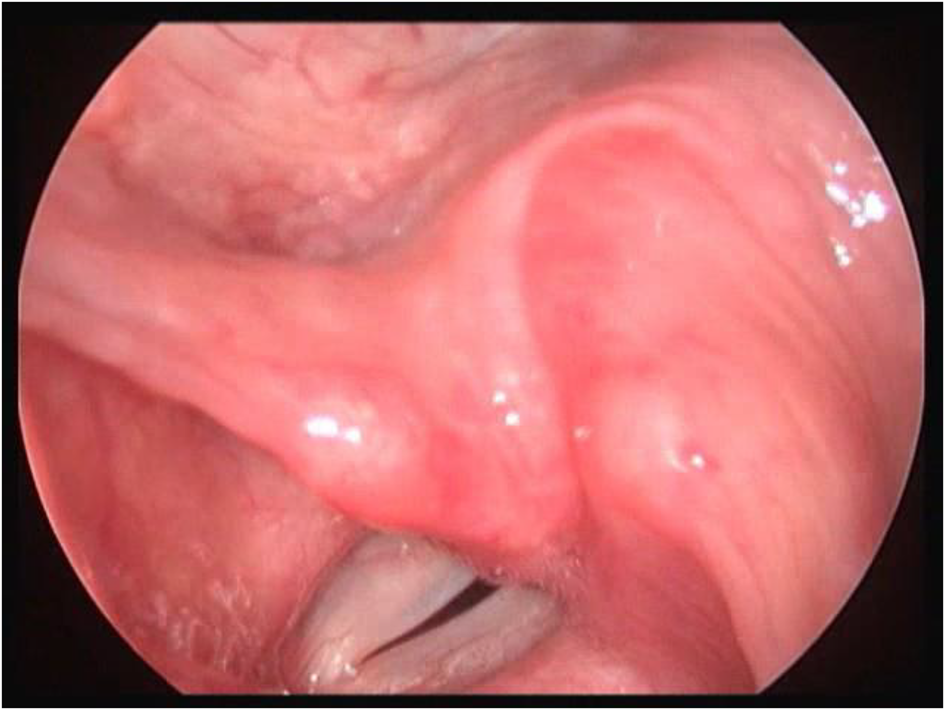
Fig. 5. Endoscopic view of laryngeal inlet with grade 3 arytenoid adduction asymmetry. The right corniculate is touching the left cuneiform in its anterior aspect.
Results
Of the 347 patients who underwent the flexible laryngoscopic video examination, there were 196 females and 151 males. The mean age of the study group was 37.01 years. Among these normophonic patients, 36.4 per cent (n = 126) had asymmetric arytenoids on adduction. Out of them, 76.9 per cent (n = 97) had asymmetry on the right side.
Right-sided predominance of arytenoid adduction asymmetry was statistically significant (p < 0.01) (Table 1; Figure 6). Out of the 126 patients with arytenoid adduction asymmetry, there were 65 males (51.58 per cent) and 61 females (41.41 per cent). Male-to-female ratio of arytenoid adduction asymmetry in our study group was 1.06:1. Patients with overriding arytenoids (arytenoid adduction asymmetry) were classified as mild (grade 1 = 60.3 per cent), moderate (grade 2 = 34.9 per cent) and severe cases (grade 3 = 4.8 per cent; Table 2) according to the position of corniculate in relation to the opposite side cuneiform (Figure 7; Table 2).

Fig. 6. Bar diagram showing association of arytenoid adduction asymmetry (overriding arytenoid (ORA)) and gender.

Fig. 7. The distribution of patients according to grade of arytenoid adduction asymmetry (overriding arytenoid).
Table 1. Distribution of patients according to arytenoid adduction asymmetry (overriding arytenoid)

Z test for proportion = 6.69, p < 0.01
Table 2. Distribution of patients according to grade of arytenoid adduction asymmetry (overriding arytenoid)

However, the prevalence of arytenoid asymmetry was 14.04 per cent when mild asymmetries were excluded. Mild and severe asymmetries were greater on the right side (61.9 per cent and 5.2 per cent) when compared with the left side (55.2 per cent and 3.4 per cent), whereas moderate asymmetry was more on the left side (41.4 per cent) than on the right side (33 per cent) (Figure 8; Table 3). The incidence of mild asymmetry was higher in females (63.9 per cent) than in males (56.9 per cent; p < 0.01) unlike moderate asymmetry, which was greater in males (38.5 per cent) compared with females (31.1 per cent) (Figure 9; Table 4). Males (4.6 per cent) and females (4.9 per cent) shared nearly equal incidence of severe asymmetry. Among the right-sided arytenoid adduction asymmetry cases, mild, moderate and severe asymmetries were 61.9 per cent, 33 per cent and 5.2 per cent, respectively, and in left-sided arytenoid adduction asymmetry cases, mild, moderate and severe asymmetries were 55.2 per cent, 41.4 per cent and 3.4 per cent, respectively (Figure 4).

Fig. 8. The distribution of grade based on the side of arytenoid adduction asymmetry (overriding arytenoid (ORA)).

Fig. 9. The distribution of grade of arytenoid adduction asymmetry (overriding arytenoid) based on gender.
Table 3. Association of grade of arytenoid adduction asymmetry and side

*Mann–Whitney U test; †significant at the 0.05 level
Table 4. Association of grade of arytenoid adduction asymmetry (overriding arytenoid) and gender

*Mann–Whitney U Test; †significant at the 0.05 level
Discussion
Identifying laryngeal asymmetry is critical to understanding the biomechanical behaviour of arytenoids. A literature search confirmed many anatomical studies demonstrating asymmetry in the laryngeal framework, but none scientifically illustrated its clinical implications in normophonic patients. Therefore, we undertook a study on a group of singers who had never had problems with their voice, and they were analysed for the demographic features and prevalence of arytenoid adduction asymmetry. Corniculate cartilage is attached to the top of arytenoids by fibrous connections, whereas cuneiform cartilage is embedded in aryepiglottic folds anterior and superior to corniculate tubercles.Reference Hamdan, Nassar, Ashkar and Sibai3 The asymmetry in the position of cuneiform-corniculate complex of either side reflects the asymmetry in the movements of arytenoids over the cricoid facet. Arytenoid asymmetry can manifest as the anterior positioning of cuneiform cartilages, overlapping posture of corniculate cartilages and sharpening of the aryepiglottic fold.Reference Husseini, Ashkar, Halawi, Sibai and Hamdan2,Reference Bonilha, O'Shields, Gerlach and Deliyski4
Extensive literature review could not help us find a single diagnostically significant parameter to diagnose arytenoid adduction asymmetry in normophonic speakers. When isolating our investigation to the corniculate cartilage overlaps, the prevalence of arytenoid adduction asymmetry was 36.4 per cent in our study. However, when cases showing mild asymmetry were excluded, arytenoid adduction asymmetry's incidence was only 14.04 per cent. The age range of the study group was between 18 and 45 years, with a mean age of 37.01 years. In a study involving 109 non-dysphonic patients, Lindestad et al. reported a 70 per cent prevalence of arytenoid asymmetry.Reference Lindestad, Hertegård and Björck7 This arytenoid asymmetry was more common in the older age group. Hamdan et al. studied the prevalence of arytenoid asymmetry in 116 patients who had presented to the voice clinic for treatment. The prevalence of arytenoid adduction asymmetry was 37.1 per cent.Reference Hamdan, Nassar, Ashkar and Sibai3 In that study, the presence of vocal symptoms did not correlate with the prevalence of arytenoid adduction asymmetry. Husseini et al. observed a 50 per cent prevalence of arytenoid adduction asymmetry in a group of healthy singers.Reference Husseini, Ashkar, Halawi, Sibai and Hamdan2 The mean age groups in the studies by Hamdan et al. and Husseini et al. were 39 and 24 years, respectively.
Bonilha et al. found that the prevalence of marked asymmetry was 57 per cent in the normophonic population (mean age = 41 years).Reference Bonilha, O'Shields, Gerlach and Deliyski4 This study compared the prevalence of arytenoid adduction asymmetry with the dysphonic group (mean age = 54), which was 71 per cent (Table 5). Clarós et al. conducted a study on arytenoid asymmetry in a group of 250 opera singers (mean age = 38.5) who came to the clinic for evaluation.Reference Clarós, Clarós-Pujol and Clarós8 In this study, the incidence of arytenoid adduction asymmetry was 29.4 per cent (considering the position of corniculate cartilage), whereas cuneiform cartilage asymmetry was 37.5 per cent and aryepiglottic fold asymmetry was 33.1 per cent. The details above show that arytenoid adduction asymmetry is more prevalent in older age groups, which can be explained by the anatomical studies showing a higher incidence of thyroid and cricoid cartilage variations in older people.Reference Hirano, Yukizane, Kurita and Hibi9,Reference Leonard10 Age-related degenerative changes in the cricoarytenoid joint can hamper movements of arytenoid cartilage, resulting in increased incidence of adduction asymmetry in the elderly population.Reference Bonilha, O'Shields, Gerlach and Deliyski4,Reference Tarafdar, Datta and Tariq11
Table 5. Comparison of various studies on arytenoid adduction asymmetry

R = right; L = left
According to our study, the incidence of overriding arytenoids showed a male predominance with a male-to-female ratio of 1.06:1. Hamdan et al and Husseini et al.,Reference Husseini, Ashkar, Halawi, Sibai and Hamdan2,Reference Hamdan, Nassar, Ashkar and Sibai3 discovered a male-to-female ratio of 2:1 in their study on arytenoid asymmetry. In the study on arytenoid adduction asymmetry in opera singers, Clarós et al. had a male-to-female sex ratio of 1.02:1, which was similar to the ratio obtained in our study.Reference Clarós, Clarós-Pujol and Clarós8 Hirano et al. reported that closed phases of vibratory cycles of the vocal fold are longer and more complete in males than in females.Reference Fleiss5
Arytenoid adduction asymmetry was significantly greater (76.9 per cent) on the right side in our study (p < 0.01). Various explanations are mentioned in the literature regarding this right-sided predominance of arytenoid adduction asymmetry. A study by Sellars and KeenReference Sellars and Keen12 suggested significant variation in the configuration of cricoid between two sides, resulting in asymmetrical cricoarytenoid joints. The right cricoarytenoid joint is more posterior, lateral and inferior compared with the left.Reference Hirano, Yukizane, Kurita and Hibi9 The longer length of the thyroid lamina on the left side makes the right corniculate cross anteriorly over the left on adduction because the left corniculate is more posterior. Poletto et al. reported a difference in the activation pattern of the cricothyroid and thyroarytenoid muscle of the right and left sides.Reference Poletto, Verdun, Strominger and Ludlow13 The arytenoid cartilage may substantially vary from the right to the left sides in many individuals, or in some cases, the arytenoid may be symmetrical, but the corniculate and cuneiform are asymmetric in position, giving an overall appearance of significant asymmetry of the arytenoid complex.Reference Leonard10 Another reason for right-left asymmetry is that the right thyroid lamina tends to tilt laterally, whereas the left one tends to tilt medially, resulting in a more anterior position of the right tip of the superior thyroid notch.Reference Hamdan, Nassar, Ashkar and Sibai3
• Prevalence of arytenoid adduction asymmetry is not related to presence of symptoms related to speaking voice
• Physiological asymmetry of arytenoids while adducting is explained by anatomical variations of larynx
• Arytenoid adduction asymmetry is common among normophonic speakers
• There is significant right sided predominance of arytenoid adduction asymmetry
• No significant gender variation was noted among cases with arytenoid adduction asymmetry
• Grading based on extent of crossover of corniculate tubercle to the opposite side is a useful assessment tool
In our study, we graded the arytenoid adduction asymmetry as mild (60.3 per cent), moderate (34.9 per cent) and severe (4.8 per cent) using the aforementioned criteria. Bonilha et al., Hamdan et al. and Clarós et al. graded arytenoid adduction asymmetry to mild, moderate and severe asymmetry.Reference Hamdan, Nassar, Ashkar and Sibai3,Reference Bonilha, O'Shields, Gerlach and Deliyski4,Reference Clarós, Clarós-Pujol and Clarós8 Bonilha et al. and Clarós et al. considered three criteria to detect and grade arytenoid adduction asymmetry, namely, overlapping posture of corniculate tuberculum, anterior position of cuneiform tubercle and acuteness of the aryepiglottic angle.Reference Clarós, Clarós-Pujol and Clarós8 Hamdan et al. looked at the angle of the aryepiglottic fold and counted a sharper angle as severe asymmetric adduction.Reference Hamdan, Nassar, Ashkar and Sibai3 According to Clarós et al.,Reference Clarós, Clarós-Pujol and Clarós8 corniculate asymmetry was 29.4 per cent (mild = 61.1 per cent, moderate = 34.7 per cent and severe = 4.1 per cent), which is similar to our study in its distribution according to severity. Cuneiform asymmetry was 37.5 per cent (mild = 67.4 per cent, moderate = 25 per cent, severe = 7.6 per cent) in the study by Clarós et al.,Reference Clarós, Clarós-Pujol and Clarós8 and Bonilha et al.Reference Bonilha, O'Shields, Gerlach and Deliyski4 studied the prevalence of arytenoid asymmetry using all three criteria mentioned above. In the investigation limited to corniculate tuberculum posture, arytenoid adduction asymmetry prevalence was 76 per cent, and more cases (48 per cent) showed marked asymmetry; there was also a difference in the prevalence of asymmetry between dysphonic and non-dysphonic patients. Mild asymmetry was greater (38 per cent), and there was no difference in prevalence between these two groups when cuneiform posture was used as the parameter of asymmetry. Most patients with and without voice symptoms had some asymmetry in the aryepiglottic fold angle, which indicates that the aryepiglottic angle would not be a good marker to ascertain arytenoid asymmetry. All these studies suggest that corniculate crossover is a reliable sign of arytenoid asymmetry. The literature review failed to suggest a definitive anatomical pointer for grading the severity of asymmetry. An observation unique to our study was that we used two anatomical pointers, corniculate and cuneiform tubercle, for grading arytenoid adduction asymmetry.
Conclusion
Arytenoid adduction asymmetry or overriding arytenoid is prevalent in more than one-third of the normophonic population. Arytenoid adduction asymmetry shows significant right-sided predominance. In the absence of any voice complaint or imperfect glottic closure, it can be taken as physiological or innocent. The prevalence of arytenoid adduction asymmetry did not differ significantly with gender. The majority of the patients with arytenoid asymmetry have only mild asymmetry, followed by moderate asymmetry, and only a few cases have severe asymmetry. It is important to have normative data regarding innocent arytenoid adduction asymmetry as it helps differentiate it from pathological arytenoid adduction asymmetry occurring as a compensatory strategy in vocal fold palsy, vocal fold paresis, Reinke's space pathologies and early glottis malignancies.
Acknowledgements
We would like to acknowledge Dr Oommen P Mathew for helping us to conduct the statistical analysis, and all the members of the Department of Laryngology, Dr Jayakumar's Institute of Laryngology, Trivandrum, Kerala, India, for the continued help and support throughout the study.
Competing interests
None declared


