Introduction
The sound conduction in the middle ear matches the acoustic impedance during the transfer of the air-borne vibration into the cochlear fluid. Middle-ear diseases, such as otitis media, otosclerosis and cholesteatoma, that interfere with sound conduction, lead to conductive hearing loss. The transmission of sound through the healthy middle ear is believed to be in high fidelity, or naive, where the amplitude of the vibration is only enlarged up to about 40 dB (including the anti-cancelling effect) without altering other aspects of the wave motion. Despite, or because of, this simplicity, a physiological analysis of the middle ear is performed in a limited number of institutes.
The difficulties associated with middle-ear research lie in the speed of the sound-induced vibration. Electrophysiological techniques, which are widely used to analyse quick electrical events in nerves or muscles, cannot detect the almost purely physical ossicular movement. The current knowledge about middle-ear sound conduction comes mainly from two sources. A laser Doppler vibrometer can reveal the precise movement of the tympanic membrane and ossicles during sound- or actuator-induced vibrations.Reference Goode, Ball and Nishihara1, Reference Goode, Ball, Nishihara and Nakamura2 Laser Doppler vibrometry made it possible to analyse the complex, 3D motion of the stapes in animalsReference Sim, Lauxmann, Chatzimichalis, Roosli, Eiber and Huber3, Reference Sim, Chatzimichalis, Lauxmann, Roosli, Eiber and Huber4 or in human temporal bone specimens.Reference Hato, Stenfelt and Goode5 Laser Doppler vibrometry could also be used to analyse the vibration of the tympanic membrane in the clinicReference Rosowski, Nakajima and Merchant6–Reference Nakajima, Pisano, Roosli, Hamade, Merchant and Mahfoud8 or of the ossicles during surgery.Reference Chien, Rosowski and Merchant9, Reference Huber, Linder, Ferrazzini, Schmid, Dillier and Stoeckli10
Another popular tool used for middle-ear research is finite-element modelling.Reference Gan, Cheng, Dai, Yang and Wood11, Reference Sun, Chang, Dormer, Dyer and Gan12 The continuous cycle of laser Doppler vibrometer-measured parameters and refined finite-element modelling calculations led to the development of a rigorous model for middle-ear sound conduction. A video analysis using a stroboscope, which has a long history in laryngology, was once employed to observe the ossicles.Reference Gyo, Aritomo and Goode13 However, we could not find any recent reports using this technique, probably because it has been difficult to count the submillimetre movements in the video.
Because high-speed cameras are now smaller and more affordable than in the past, they are now becoming popular for use in the life sciences, especially where the detection of quick events is required. The combination of electrophysiology studies and a high-speed video analysis has provided previously unavailable information about the quick shape changes that cochlear outer hair cells exhibit in the inner ear.Reference Kitani, Kakehata and Kalinec14 The combination of laser confocal microscopy and a high-speed camera has detected the intra-organ and inter-organ distribution of administered drugs in drug delivery research.Reference Matsumoto, Nomoto, Cabral, Matsumoto, Watanabe and Christie15 The wider popularity of the video analysis systems has also been seen in clinical otolaryngology. For example, the analysis of quick ocular movements (nystagmus) by video oculography is replacing conventional electrophysiological nystagmography.Reference Iijima, Minamitani and Ishikawa16, Reference Baloh and Furman17
In the present study, we employed a commercially available high-speed camera to record sound-triggered ossicular movements. The simple and straightforward analysis was capable of visualising the fine sinusoidal motion of the stapes. The obtained data implied the usefulness of this system for basic research of the middle ear, and further studies towards the clinical use of such a system are warranted.
Materials and methods
Preparation
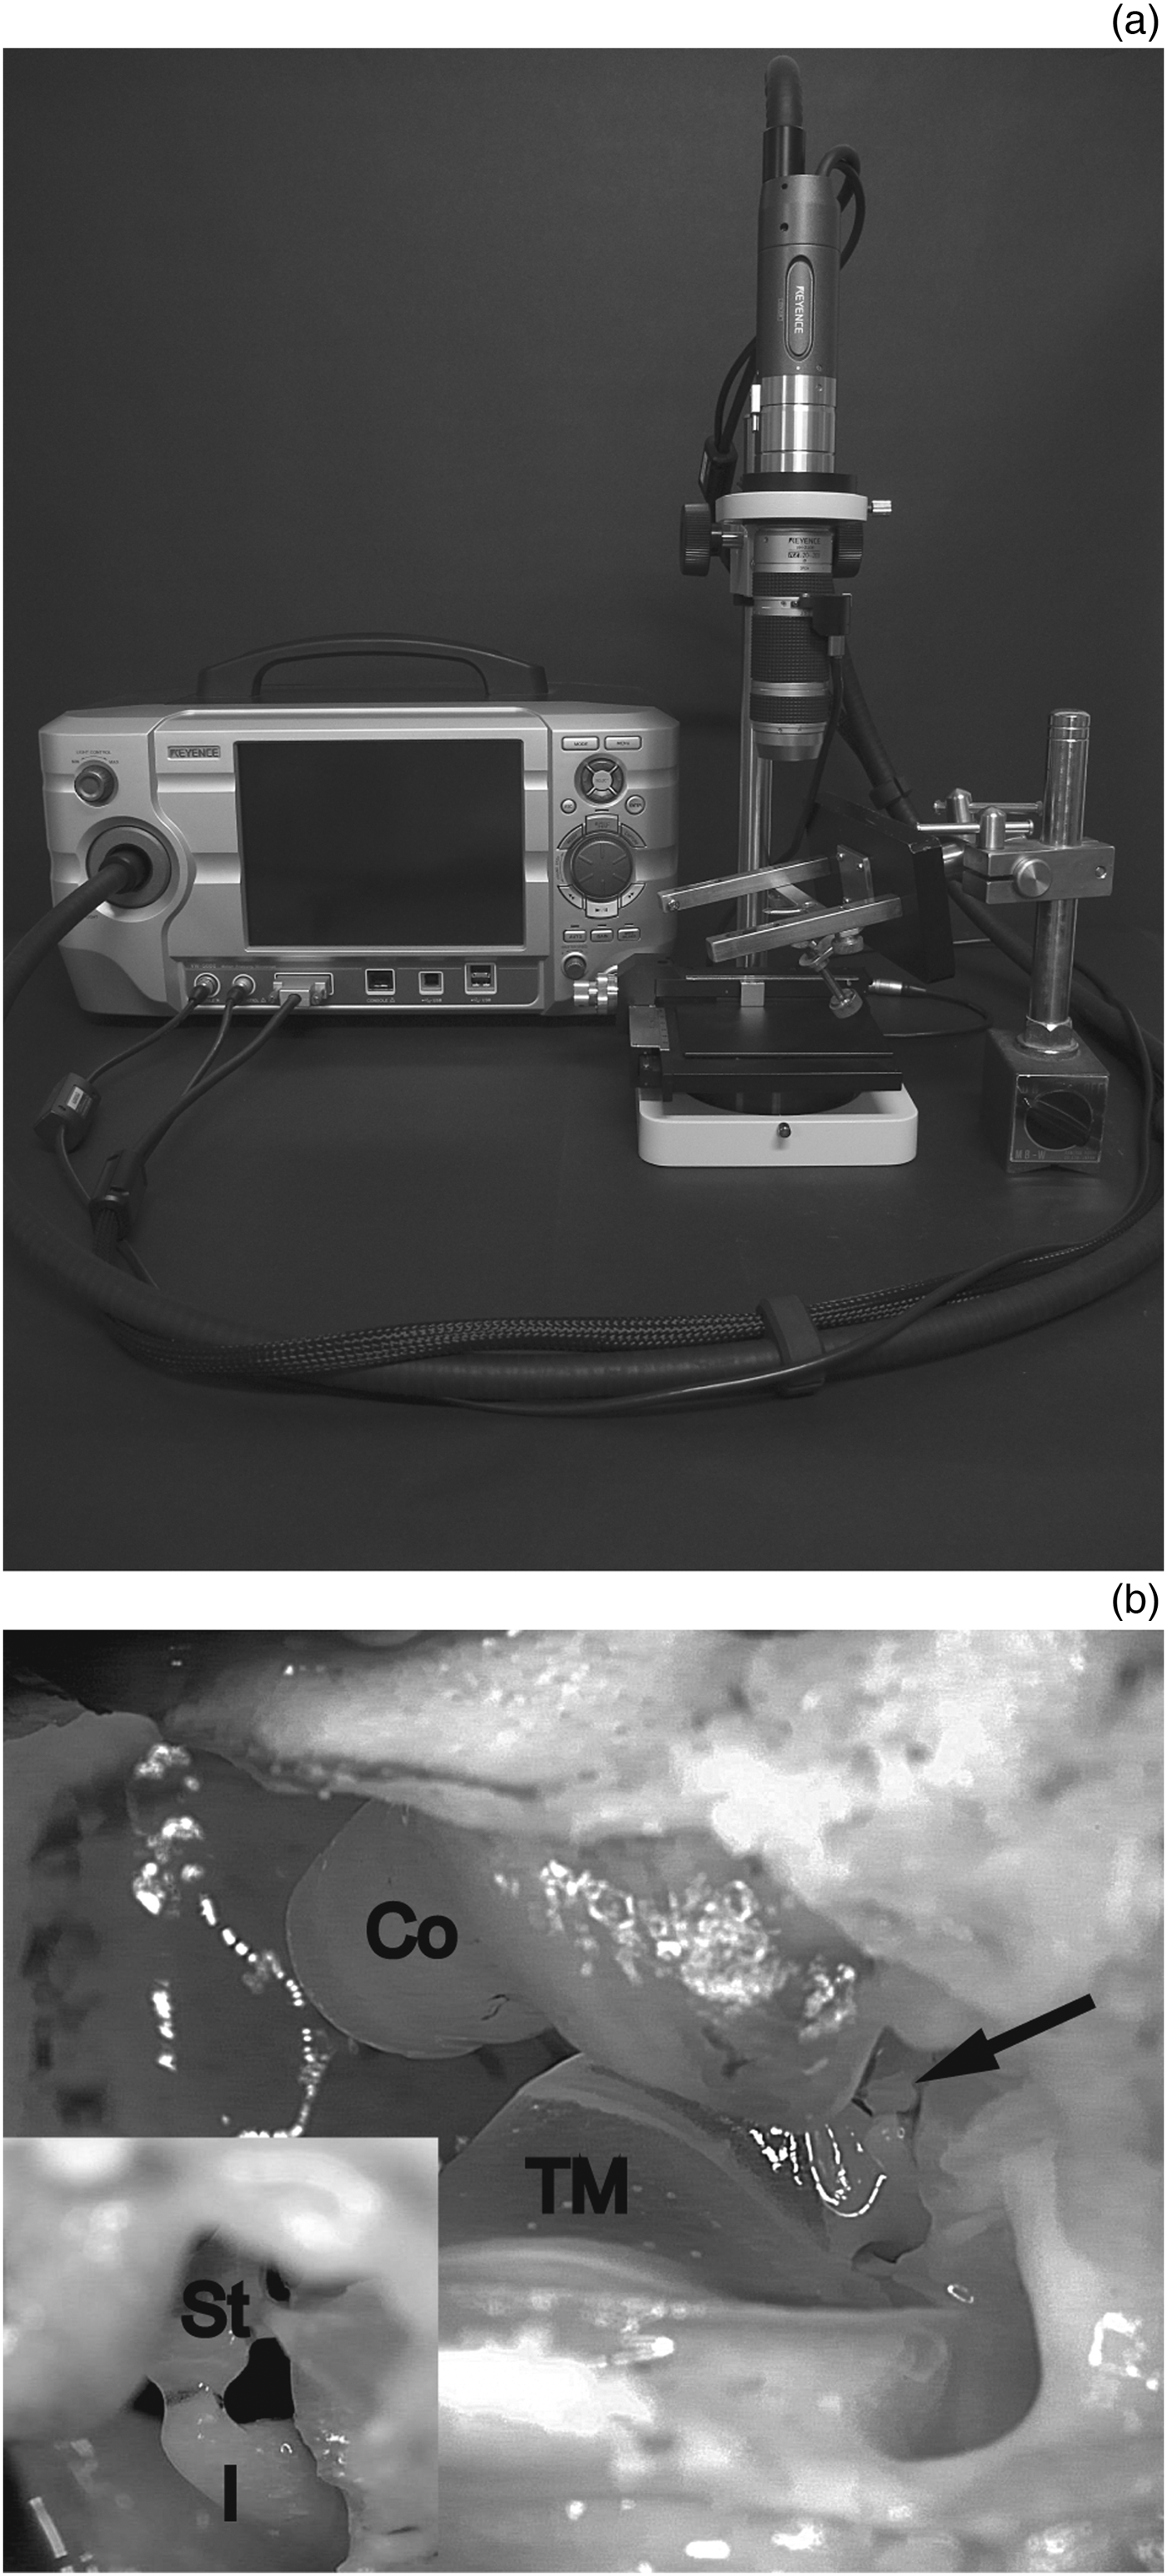
Guinea pigs (200–300 g) of either sex with a positive Preyer's reflex were euthanised by decapitation after intra-peritoneally administering a sedating dose (20 mg/kg), then a lethal dose (200 mg/kg) of pentobarbital, following procedures that were approved by the institutional committees on animal experimentation of the Graduate School of Medical Sciences, Kyushu University. The ventral wall of the otic bulla was removed without injuring any of the key structures comprising the conductive hearing system, i.e. the external auditory canal, tympanic membrane and ossicles. The specimen was then placed under a high-speed camera (VW-5000, Keyence, Osaka, Japan) equipped with a ×20 zoom lens (VH-20w, Keyence). The tympanic membrane and three ossicles could be visualised (Figure 1). We placed the camera so that the head of the stapes was in the center of the view. We confirmed that the tympanic membrane and ossicles were intact before every experimental recording, unless we injured them intentionally. A custom earphone was inserted into the external auditory canal. Tone bursts were generated in our auditory brainstem response (ABR) system (Neuropack M1: MEB-9204, Nihon Kohden, Tokyo, Japan) and delivered through the earphone. The sound intensity was calibrated at the exit of the earphone and is presented in the present study as the dB SPL.

Fig. 1 The experimental set-up. (a) An overview of the system. (b) An image of a specimen. Co = cochlea; I = incus; St = stapes; TM = tympanic membrane; arrow = center of the magnified inset
Recording and analysis
Tone bursts of various frequency (125, 250, 500 and 1000 Hz) and intensity (50–120 dB SPL) were delivered for the duration of 100 milliseconds every 1 second. We recorded the video during acoustic stimulation at 1000 frames per second (fps) when the stapes was stimulated at 125 and 250 Hz, and at 4000 fps to record the stapedial movement under the stimulation with 500 and 1000 Hz, unless otherwise specified. We rotated the camera if necessary, so that the movement of the stapes would be vertical in the recorded image. The video recordings were analysed using a software program designed for a moving target analysis (VW-H1MA, Keyence). A point of interest was placed on the head of the stapes. The software program automatically tracked the point of interest in every frame of the recordings. The y-coordinate (the vertical axis) of the tracked point was collected as the value representing the stapedial motion in the recordings. Student's t-test using the Excel software program (Microsoft Japan, Tokyo, Japan) was used for the statistical comparisons.
Results
Verification of the recording system
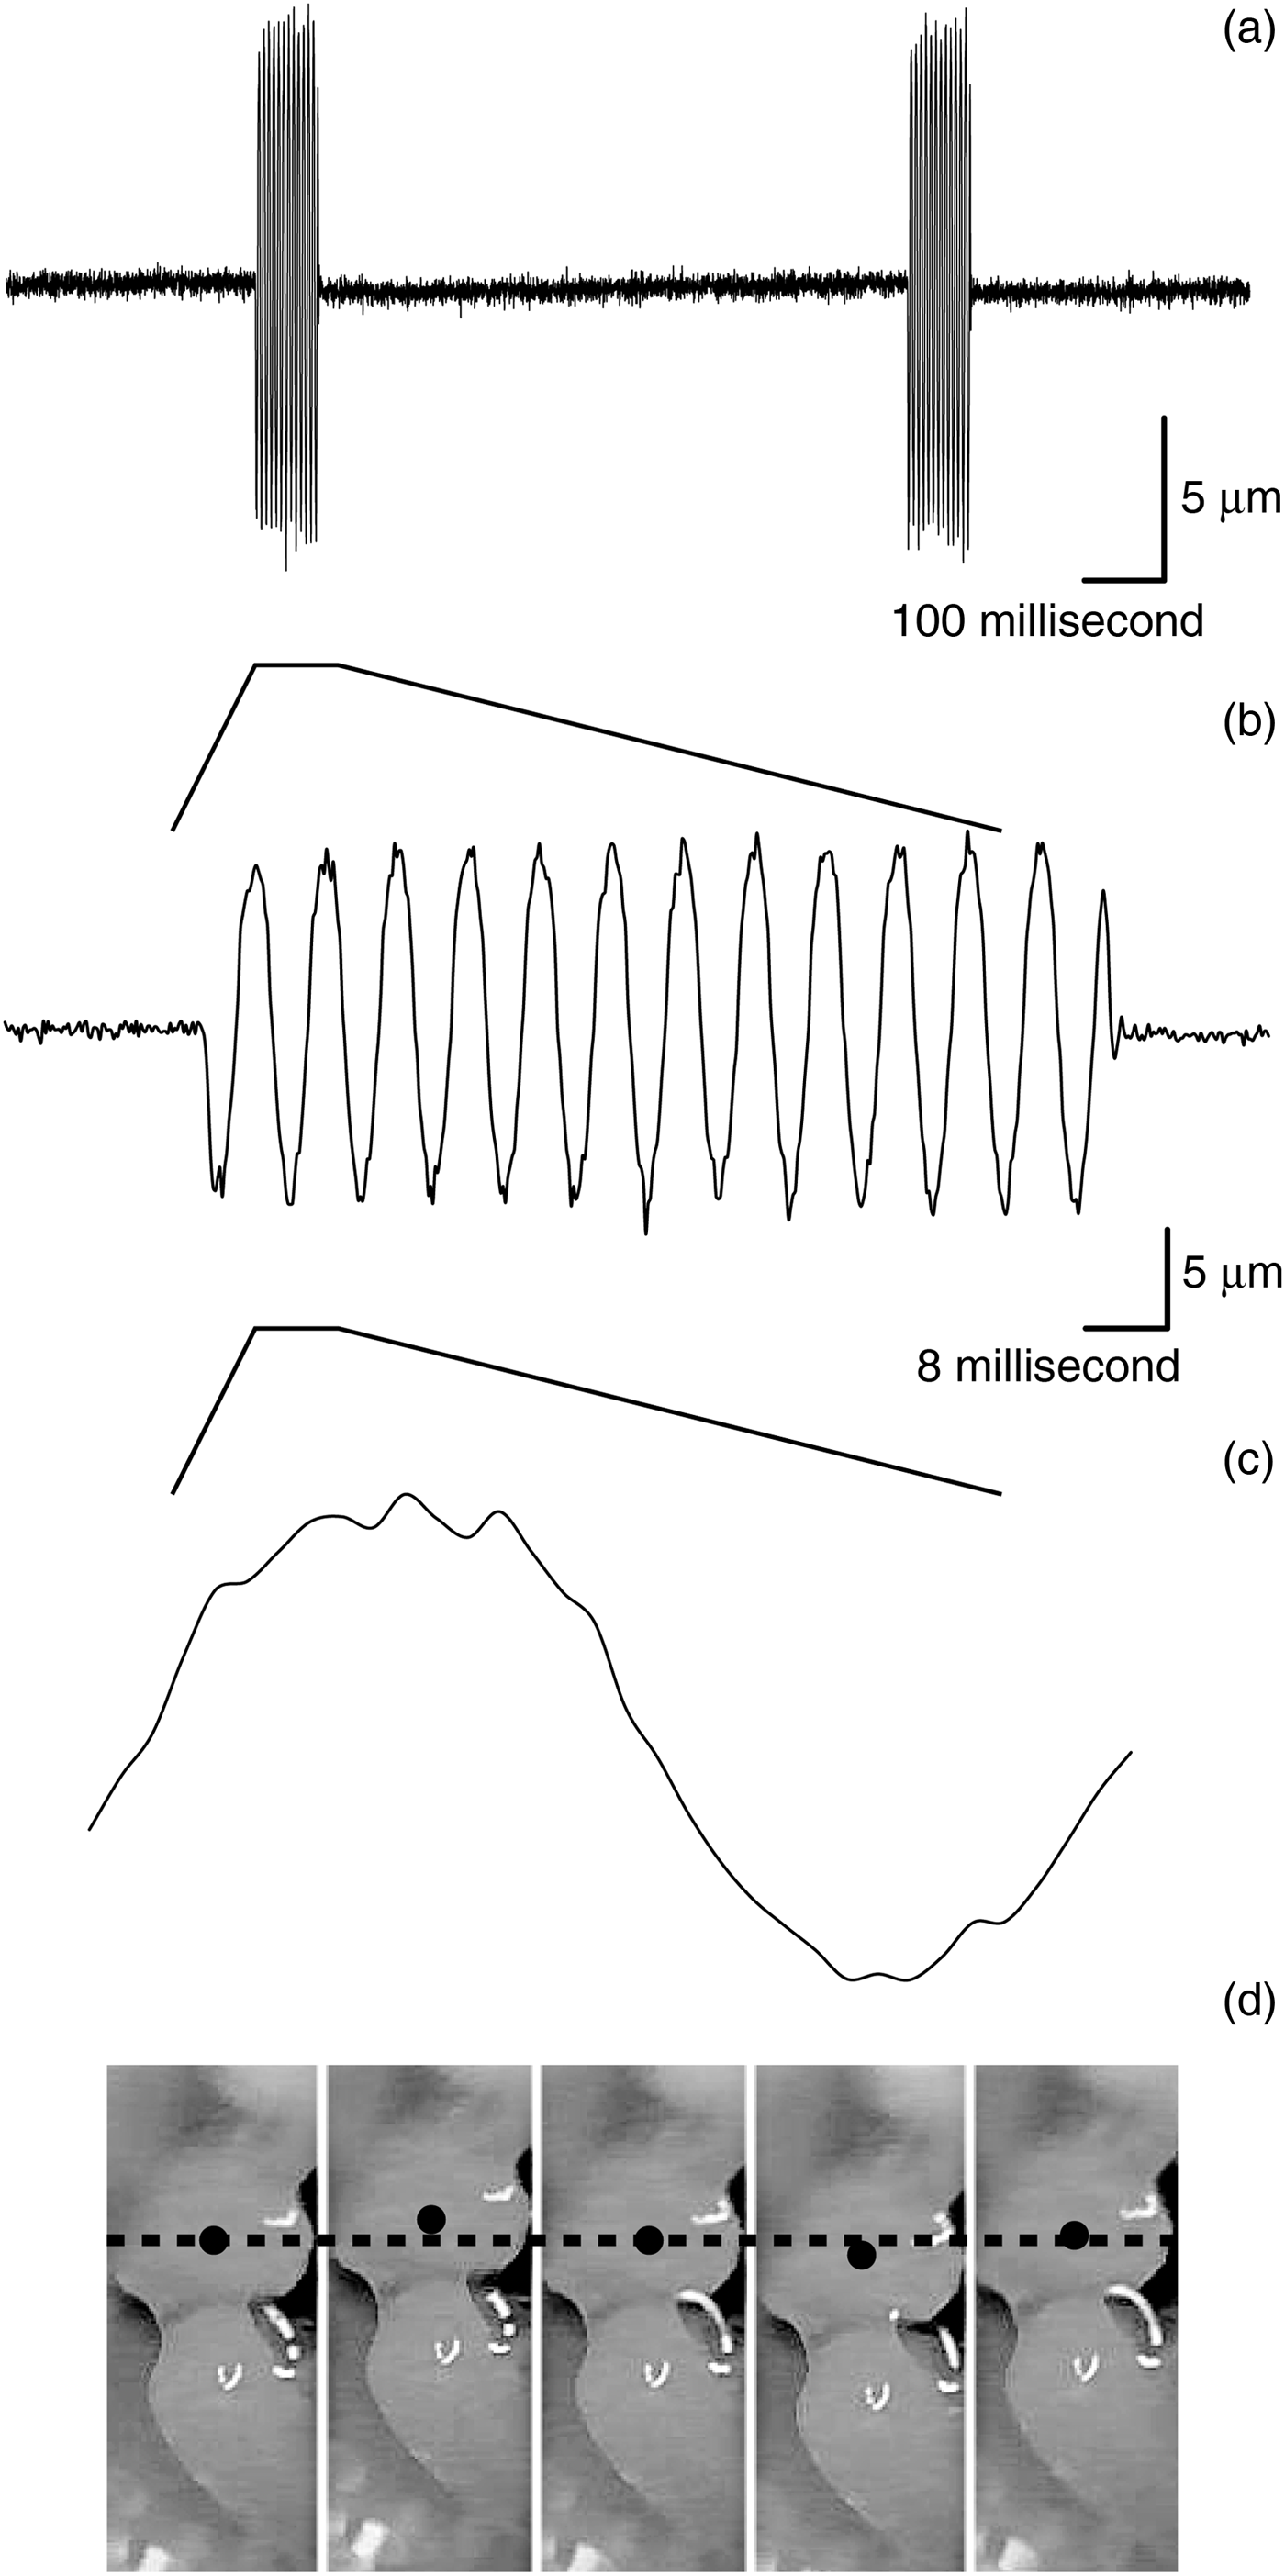
The movement of the stapes was visually identifiable in every recording. The movement was nearly sinusoidal, and was clearly distinguishable from the background noise (Figure 2). There were 12.5 cycles recorded when a sound of 125 Hz was delivered for 100 milliseconds (Figure 2b), thus indicating that there were a sufficient number of sample points to record every cycle of the stapedial movement without altering the frequency of the wave form.
Fig. 2 The stapedial motion. (a–c) The analysed stapedial motion on different time scales. (d) The captured motion analysis window of the software program.
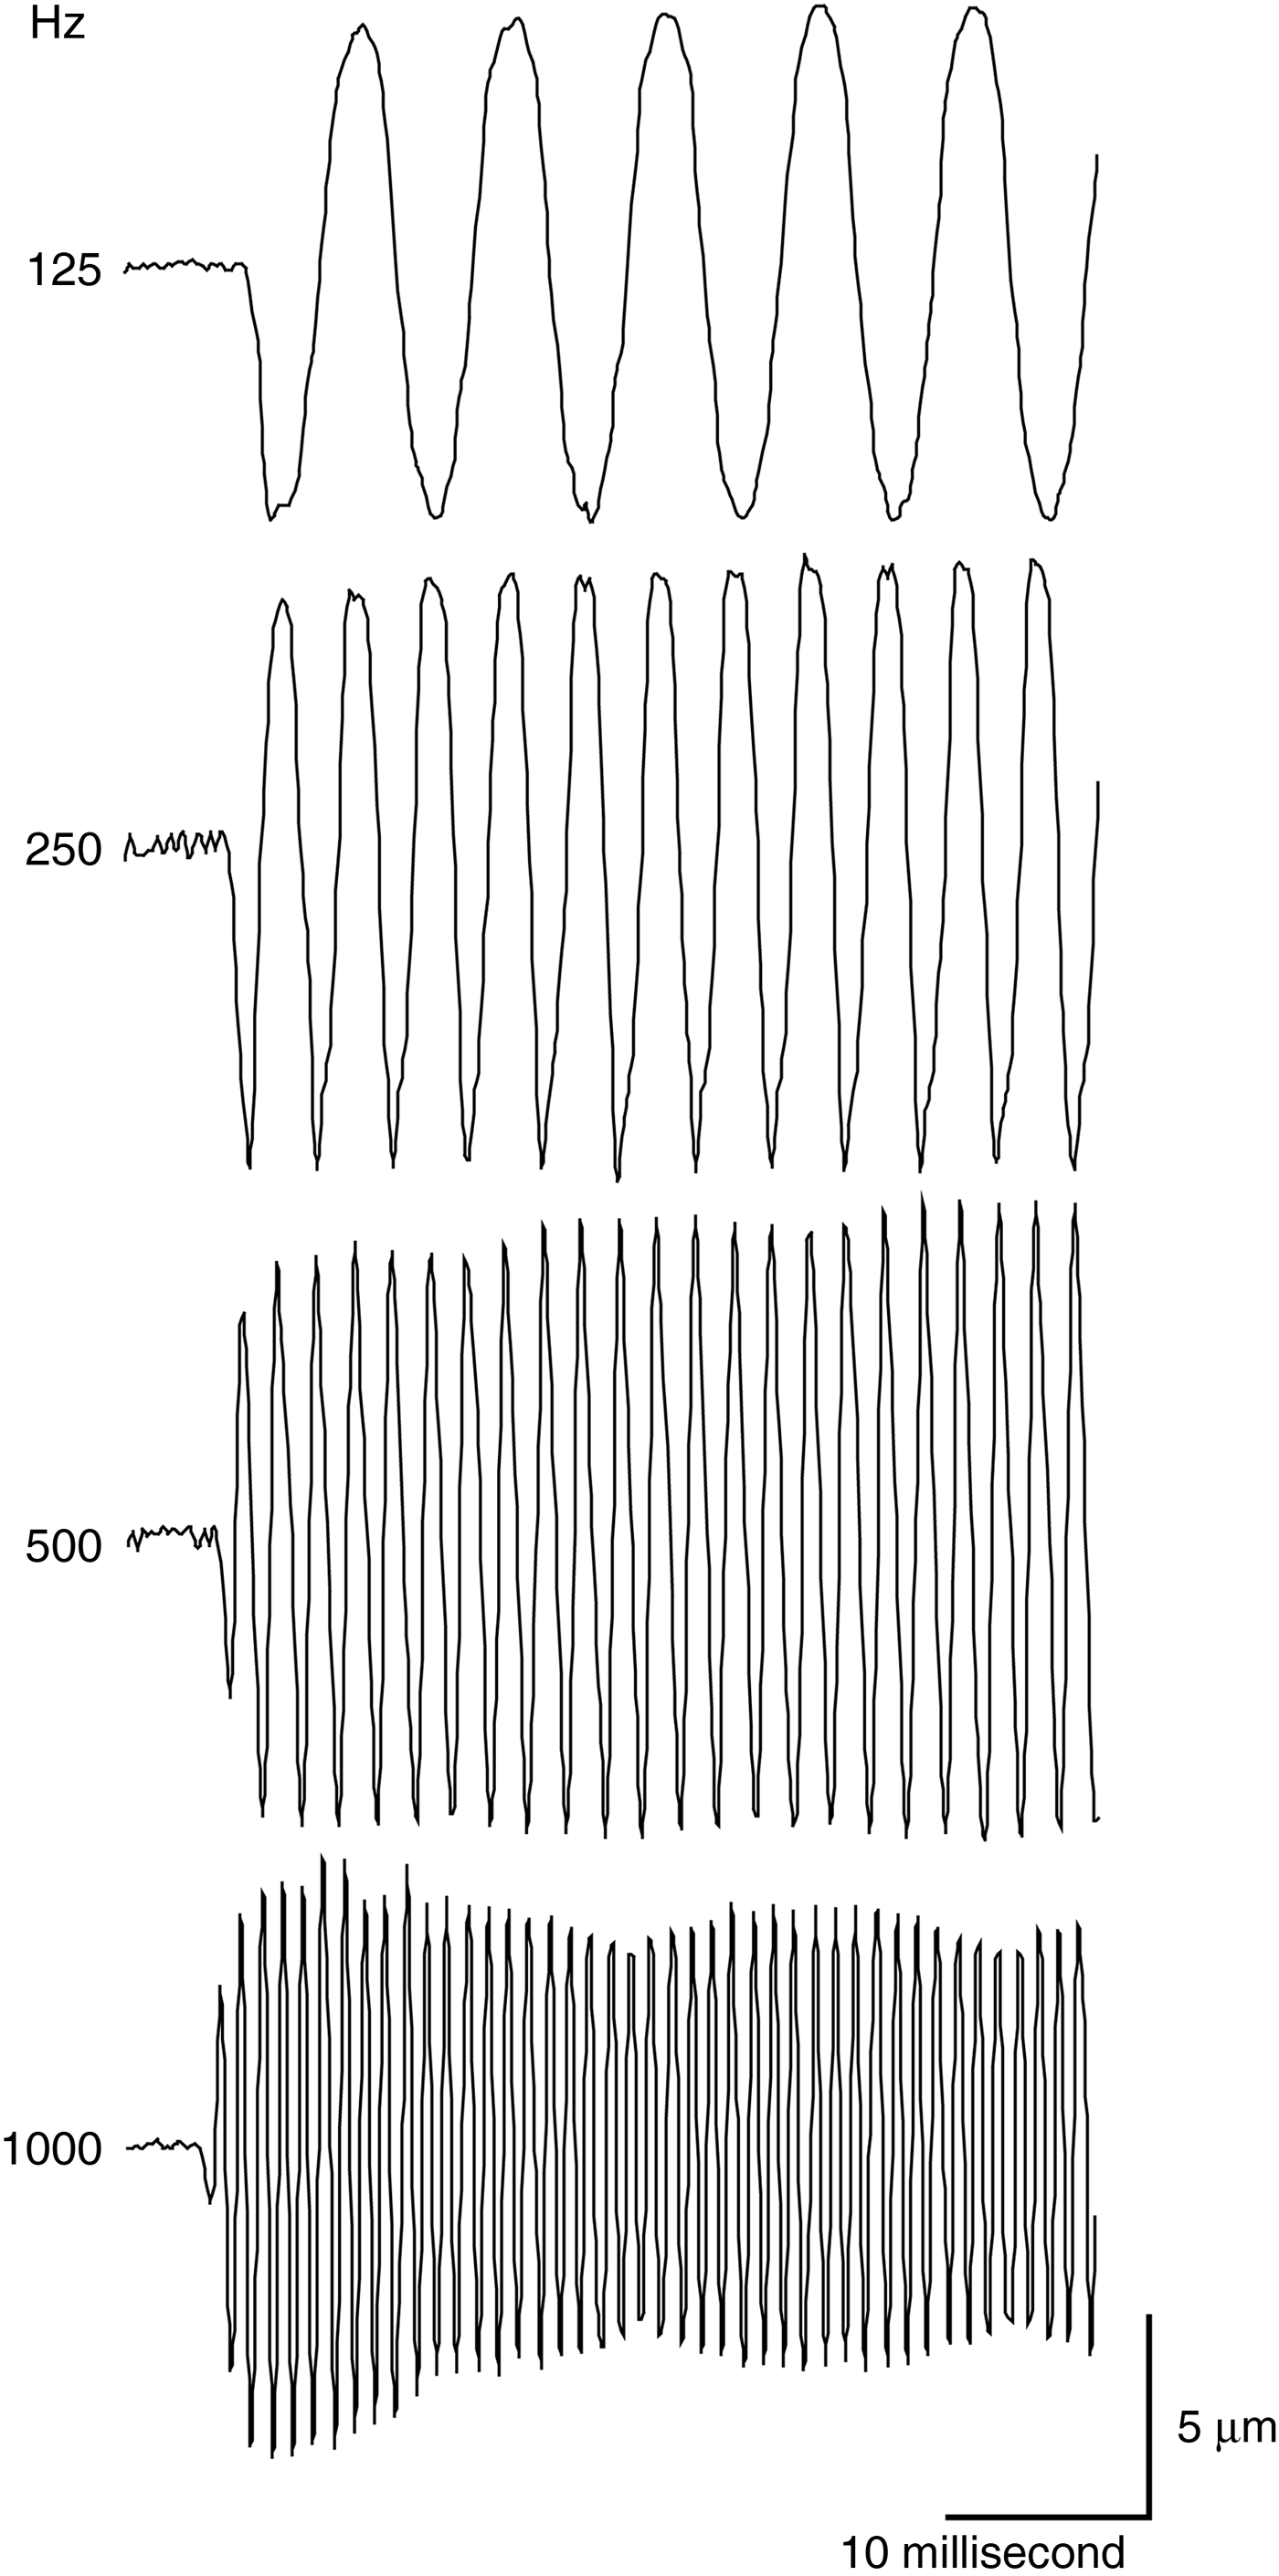
Our experimental conditions could record faster ossicular oscillation (Figure 3). However, the stapedial movement during the stimulation with 1 kHz sound showed fluctuating amplitude, which we interpreted as a strobe effect (Figure 3).
Fig. 3 The stapedial motion at different frequencies.
The amplitude of the stapedial motion was proportional to the delivered sound intensity (Figure 4). The threshold above which the stapedial motion could be distinguished by the human eye, was between 65 and 85 dB SPL. It was therefore possible to quantify the effectiveness of the middle-ear sound conduction.

Fig. 4 The stapedial motion at different sound intensities.
Analysis of conductive hearing loss
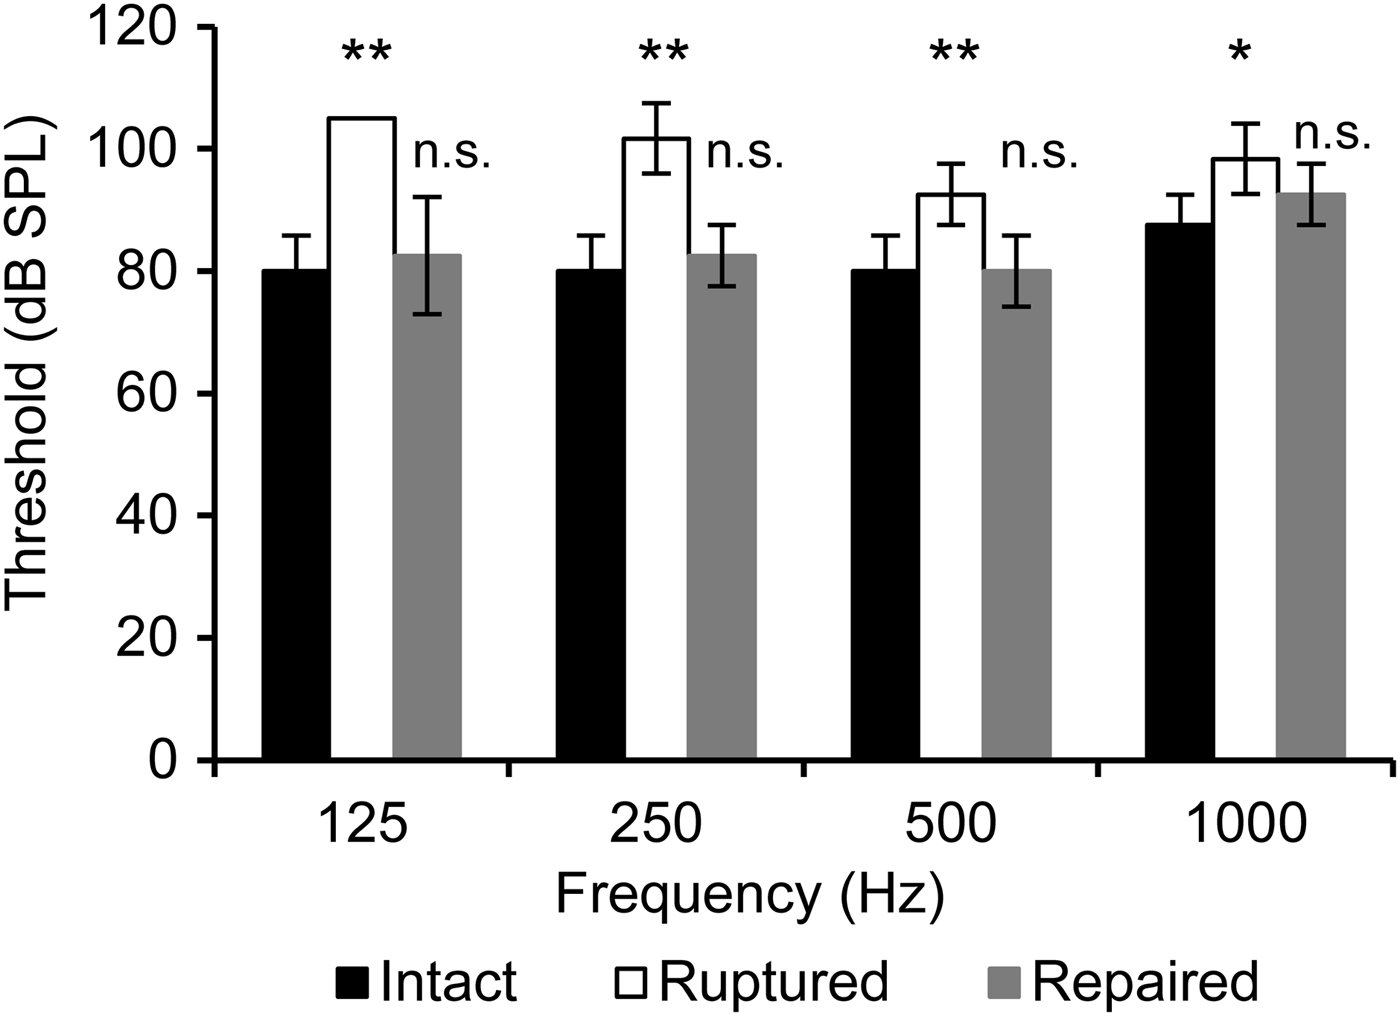
We investigated whether an experimental condition simulating conductive hearing loss could provide consistent results with the clinical hearing test results. We chose to make a traumatic perforation of the tympanic membrane, because it is a well-known pathological condition that results in pure conductive hearing loss. The amplitude of the stapedial oscillation was smaller when the tympanic membrane was ruptured (Figure 5). The amplitude fully recovered to the control value when the perforation was repaired with a small piece of wet tissue paper (KimWipe, Kimberly-Clark, Irving, Texas, USA). The same experiment was repeated in four guinea pigs, and the conductive hearing threshold was determined with a video analysis. The perforation attenuated the conductive hearing and also shifted the threshold of visually distinguishable stapedial motion for 15–25 dB in all tested frequencies of 125–1000 Hz. The shifted thresholds in all frequencies thereafter recovered to the control values after patch closure of the perforation (Figure 6). This perforation-induced conductive hearing loss was slightly larger in the lower frequencies.
Fig. 5 The stapedial motion under a pathological condition. (a) An ear with a ruptured (left) or patch-repaired (right) tympanic membrane. (b) The sound-induced stapedial motion in the intact, ruptured and repaired tympanic membranes.
Fig. 6 The threshold of the distinguishable stapedial motion. Each column and vertical bar represents the mean ± standard deviation from four experiments. Statistical significance (not significant: p ≥ 0.05, *: p < 0.05, **: p < 0.01) was tested against the ‘Intact’ condition at the corresponding sound frequency.
Discussion
The most widely used technique in the research of middle-ear sound conduction is laser Doppler vibrometry.Reference Gan, Cheng, Dai, Yang and Wood11 Laser Doppler vibrometry is capable of analysing the ossicular movement at high temporal resolution up to 70 kHz or higher, which is much higher than our current study. However, laser Doppler vibrometry requires expensive equipment and experts in physics who understand the theory and analysis. Consequently, laser Doppler vibrometry is not widely used in middle-ear research or in the clinical setting, despite the long history and proven accuracy. In the present study, we used a commercially available high-speed camera to directly observe and analyse the ossicular movement. Our simple analysis using a high-speed camera provided a straightforward, assumption-free, easy-to-understand slow-motion video. The conductive hearing loss due to traumatic tympanic membrane perforation and its recovery after patch-repair could be clearly observed, especially in the lower frequencies. This result is exactly what is seen in otolaryngology clinics, where perforation of the eardrum usually affects conductive hearing at lower frequencies of 125–500 Hz.Reference Saliba, Abela and Arcand18 Our high-speed video camera records up to 140 000 fps. However, a recording rate of ≥4000 fps did not always provide analysable video under our experimental conditions, mainly due to the limited light intensity. A brighter light source and more sensitive camera would allow the recording rate to be increased.
The high-speed video analysis works best when the target moves within the focal plane of the camera. This is in contrast to laser Doppler vibrometry, which has better accuracy when the target is moving along the axis of the laser.Reference Chien, Ravicz, Merchant and Rosowski19 Because of this preference for the shooting angle, it is much easier to prepare a specimen for a video analysis, because it is unnecessary to remove any of the conductive hearing structures, i.e. the tympanic membrane and ossicles.
The current study showed that video analysis could evaluate middle-ear function, regardless of the animal's sensorineural hearing status or even life. If applied to living animals, a high-speed video analysis should be able to analyse any intrinsic modification of the sound conduction, such as the stapedial reflex. In addition, the more recently developed motion analysis software programs can track arbitrarily set points in a video image without necessitating the use of microbeads, reflector sheets or other tracking strategies. These features are important for basic research, because any mass on the vibrating system interferes with the analysis. The same features imply that a high-speed camera may have potential future applications on a surgical microscope to analyse the ossicular movement of patients intra-operatively.
Our initial experiments showed that a non-traumatic level of sound intensity (65–75 dB) was sufficient to induce visually analysable stapedial motion. We expect that stapedial movement triggered by even weaker, and hence safer, sound would be able to be visualised with some refinements in the optics. The advantage of using a high-speed camera in the operating room is that, unlike intra-operative laser Doppler vibrometry, there is no ‘additional’ equipment needed. Because the high-speed camera can, of course, be used as a standard video camera, the video camera on the surgical microscope can be replaced with one that can be used in both standard and high-speed modes.
The intra-operative analysis of the ossicular mobility after ossiculoplasty may provide a powerful tool to confirm the effects of the surgery before closing the incision. However, again, the light intensity and the sensitivity of the camera are key issues that need to be resolved prior to clinical use of the high-speed camera. The use of a harmful level of light in the operating room for the purpose of high-speed recording would not be allowed without protective equipment for the patient and the staff. As such, infrared light, instead of visible light, may be a better candidate for use in the operating room.
Conclusion
A high-speed video analysis of the ossicular movement in response to acoustic stimulation may become a mainstream strategy in both basic research and clinical testing of the middle-ear physiology and pathology.
Financial support
The study was supported by JSPS KAKENHI Grant No. 24500549, which was awarded to NM.