


Introduction
Poverty is a multifaceted problem that requires action on many fronts. Over the last two decades, poverty reduction strategies (PRS) have emerged globally as an increasingly popular policy instrument to deal with this complexity (Noël, Reference Noël2006). Initially proposed by the World Bank and International Monetary Fund for developing countries (Reference LevinsohnLevinsohn, 2003), rich countries began to implement them beginning with the UK in 1999 (Reference CollinCollin, 2007). In the European Union, these plans are known as National Action Plans on Social Inclusion and are widespread (Reference Atkinson, Cantillon, Marlier and NolanAtkinson, Cantillon, Marlier, & Nolan, 2005).
In Canada, the first PRS was formally committed to in Quebec in its Act to Combat Poverty and Social Exclusion in 2000 and rolled out in 2004. Since then, Canada has seen a proliferation of first provincial PRS, peaking in 2009 and continuing until the last of the ten provinces, British Columbia, made its commitment to introduce a plan in 2017. At the time of this writing, early 2018, three provinces are implementing their second action plans and Quebec is now implementing its third.
The Canadian provinces provide an ideal testing ground for advancing our understanding of the impacts of PRS (Imbeau et al., Reference Imbeau, Landry, Milner, Petry, Crete, Forest and Lemieux2000). On the one hand, the provinces are highly similar, having more in common with one another than they do with other jurisdictions (Reference Bernard and Saint-ArnaudBernard & Saint-Arnaud, 2004). On the other hand, they differ in important ways that can bring the effects of policy intervention into relief (for example, van den Berg, Plante, Raïq, Proulx, & Faustmann, Reference van den Berg, Plante, Raïq, Proulx and Faustmann2017). Canada also benefits from a highly coordinated systems of data collection and recognised common indicators.
At their best, PRS set targets and timelines and chart a course for poverty reduction; they bring together stakeholders from inside and outside of government to coordinate and focus their efforts; and they overcome traditional silos and piecemeal approaches to benefits and service provision to create a united front in the fight against poverty (Reference Barata and MurphyBarata & Murphy, 2011; MacInnes, Bushe, Kelly, & McHardy, Reference MacInnes, Bushe, Kelly and McHardy2014; Reference Notten and LaforestNotten & Laforest, 2016; Reference TorjmanTorjman, 2008). Repeated PRS can serve as a basis for deliberative evidence-based policy learning (Reference Notten and LaforestNotten & Laforest, 2016).
However, PRS also have their share of critics (Benbow, Gorlick, Forchuk, Ward-Griffin, & Berman, Reference Benbow, Gorlick, Forchuk, Ward-Griffin and Berman2016; Reference Craig and PorterCraig & Porter, 2003; Reference Fernando and EarleFernando & Earle, 2011; Reference GreasonGreason, 2012; Smith-Carrier & Lawlor, Reference Smith-Carrier and Lawlor2017). For example, when Saskatchewan introduced its first PRS in 2016, which read as a laundry list of already existing programmes and initiatives and proposed no new ones, it was met with widespread condemnation from the local poverty advocacy community.Footnote 1 At their worst, PRS are regarded as just another way for governments to say they are doing something about poverty when they really are not. In effect, governments may simply use PRS as ‘window dressing’ (Reference LevinsohnLevinsohn, 2003, p. 9).
Despite their rapid proliferation, at this time, there is surprisingly little academic research on PRS and their impacts. In this study, I explore recent provincial poverty trends in order to evaluate Canada's provincial PRS on their own terms by answering the question: what impact, if any, have they had on overall poverty levels? As one of the first studies to focus on the impacts of PRS, my aim is not to have the final word on this matter but to use evidence to narrow discussion and unearth interesting hypotheses to advance more in-depth study in the future.
In the spirit of exploration, I eschew more complex forms of statistical analysis, adopting instead a relatively straightforward descriptive empirical strategy which compares poverty levels before and after the introduction of provincial PRS action plans. I also situate these developments historically by examining changes in poverty rates going back to 1976. I operationalise poverty using forty years of Statistics Canada data and the popular Low Income Measure (LIM) (Reference Murphy, Zhang and DionMurphy, Zhang, & Dion, 2010). I also consider recent developments in poverty measured by Canada's newly recognised official poverty measure (GoC, 2018).
I find that there has been no definitive short-term relationship between the timing of PRS action plans and reductions in poverty levels among the provinces. Looking at five-over-five years changes in poverty over time, action plans in most provinces have actually tended to follow periods of prolonged poverty reduction rather than give rise to them. Moreover, every province has seen more impressive five-over-five year improvements in poverty at earlier points in their history.
These results suggest that governments may be timing the introduction of their first action plans to showcase recent poverty reduction achievements rather than ensure them in the future – a dynamic that political scientists call ‘credit claiming’ (Reference Bonoli, Bonoli and NataliBonoli, 2012; Reference WeaverWeaver, 1986). I discuss the strengths and limits of this conclusion in the closing sections of this paper, underline practical lessons we should take from the Canadian provincial experience, and identify directions for future study.
Poverty reduction strategies
The promise of poverty reduction strategies
Poverty is a multifaceted problem which cannot be addressed by a single policy intervention. On the one hand, macro-economic forces conspire to place the means of basic subsistence and social participation more or less in reach of people (Reference Evans and MitchellEvans & Mitchell, 2011). The opportunities that economic growth provides have been shown to be a key determinant of poverty levels in rich and poor countries, although this is also mediated by their distribution throughout society (Reference Ferreira and RavallionFerreira & Ravallion, 2008; Notten & de Neubourg, Reference Notten and de Neubourg2011).
On the other hand, economic forces interact with people's individual qualities and social circumstance to make some people more susceptible to poverty than others (Reference SharmaSharma, 2012).Footnote 2 Smith-Carrier (Reference Smith-Carrier2017), for example, points to several interventions beyond income assistance that are needed to eliminate poverty among women, including: increasing minimum wages, ensuring greater employment security, improved access to child care, and greater legal recognition of their rights.
PRS are presented as an ‘innovative governance process’ (Reference Notten and LaforestNotten & Laforest, 2016, p. 2) that can meet the diverse challenges poverty reduction presents head on and reduce poverty levels in spite of wider economic and demographic forces (MacInnes et al., Reference MacInnes, Bushe, Kelly and McHardy2014; Reference TorjmanTorjman, 2008). They do so by providing a framework of targets, timelines, and accountability mechanisms that enable stakeholders inside and outside of government to monitor and coordinate their efforts to reduce poverty across historically disparate service areas, governmental departments, and sectors.Footnote 3
Over the long-term, repeated PRS should provide a foundation for the kind of deliberative evidence-based policy learning which Sanderson (Reference Sanderson2009) calls ‘intelligent policy making.’ Under this approach, each PRS is regarded as a set of hypotheses to be tested in practice and improved upon. Repeated PRS offer stakeholders opportunities to assess progress and make adjustments to ensure past failures contribute to future accomplishments. In the EU, this dynamic is also supposed to emerge cross-sectionally among countries through the ‘open method of coordination’ (Reference Ferrera, Matsaganis and SacchiFerrera, Matsaganis, & Sacchi, 2002).
However, PRS have also been criticised. According to their strongest detractors, PRS merely serve as an opportunity for governments to dress up mediocre and/or partial poverty reduction efforts (Benbow et al., Reference Benbow, Gorlick, Forchuk, Ward-Griffin and Berman2016; Reference GreasonGreason, 2012; Smith-Carrier & Lawlor, Reference Smith-Carrier and Lawlor2017). According to this perspective, PRS are used as ‘window dressing’ (Reference LevinsohnLevinsohn, 2003, p. 9), or as good news opportunities for governments that have little ambition to actually reduce poverty.
This having been said, the use of PRS as window dressing does not necessarily have to be to paper over failures but could also be used to claim credit for recent successes. Credit claiming is most likely when the perceived costs of a policy are relatively low and its benefits great (Reference WeaverWeaver, 1986). Bonoli (Reference Bonoli, Bonoli and Natali2012) observes that modern welfare states are presented with few opportunities for ‘affordable credit claiming’—that is, policies that can be seen as ‘win-win’ (p. 104)–although PRS may offer precisely this kind of incentive structure (MacInnes et al., Reference MacInnes, Bushe, Kelly and McHardy2014).
Evaluating poverty reduction strategies on their own terms
Although PRS vary considerably they share the common stated objective of reducing poverty. For example, looking at Canada's first two PRS, in its 2005 Speech from the Throne, Newfoundland and Labrador committed to developing and implementing a PRS in order to ‘transform Newfoundland and Labrador over a ten-year period from a province with the most poverty to a province with the least poverty’ (GoNL, 2006, p. 9). Meanwhile, in its An Act to Combat Poverty and Social Exclusion in 2002, Quebec committed to, ‘progressively make Québec, by 2013, one of the industrialized nations having the least number of persons living in poverty’ (Ch. 2, article 4).
PRS are complex policy instruments that are sure to have many different impacts, however, their objective to reduce poverty is unqualified. That is, the purpose of PRS is precisely to overcome the complex set of challenges that forstall unfocused and uncoordinated poverty reductions efforts and reduce poverty unconditionally. PRS that reduce poverty but are swamped by other determinants that cause poverty levels to continue to rise fail to meet their primary objective (Reference Evans and MitchellEvans & Mitchell, 2011).
For example, the PRS of Newfoundland and Labrador commits to making the province one of the least poor jurisdictions in the country. It does not say it will ‘transform Newfoundland and Labrador over a ten-year period from a province with the most poverty to a province with the least poverty’ only if oil prices continue to rise and there are no unexpected increases in the number of newcomers choosing to settle in St John's (the Maritime province's largest city).
In this exploratory study, I evaluate PRS on their own terms by answering the question: has the introduction of PRS among the Canadian provinces actually tended to be immediately followed by unconditional reductions in overall poverty levels? In order to answer this question, I deliberately adopt a straightforward descriptive approach and eschew more elaborate regression techniques that model conditional outcomes.
This methodological approach is warranted because, first and foremost, PRS make unconditional commitments to reduce poverty. Even though governments cannot control all determinants of poverty, the stated objective of PRS is to supply governments with the kinds of mechanisms they need to respond to and overcome these factors. Second, modelling conditional outcomes, particularly at this early exploratory stage, risks obscuring interesting relationships. In fact, adopting this approach would have very likely led to the the key empirical finding of this paper – that reductions in poverty have tended to precede rather than follow the introduction of PRS – to be overlooked.
Before we proceed, one brief note of caution is warranted. Since it has been less than a decade since most PRS in Canada were enacted, this study must focus on their relatively short-term impacts. Indeed, if the benefits of PRS are concentrated in their long-term capacity to induce processes of iterative policy evaluation and learning, then these effects will lie beyond the scope of this study. In the closing sections of this article, I consider how recent short-term empirical trends can inform long-term PRS efforts.
The content of poverty reduction strategies
In Canada, there have been as many approaches taken to provincial PRS as there have been adopting provincial governments. Notten and Laforest (Reference Notten and Laforest2016), for example, compare and contrast the cases of Newfoundland and Labrador, Quebec, Ontario, and Manitoba in terms of three dimensions: institutional arrangements, stakeholder involvement, and strategic management and measurement. They conclude that none of the provinces have adopted the same arrangements in any one of these dimensions.
An exhaustive survey of the specific commitments and proposals put forth by Canada's provincial PRS is beyond the scope of this paper. For treatments of this sort, the reader should refer to Notten and Laforest's (Reference Notten and Laforest2016) aforementioned study and that of MacInnes et al. (Reference MacInnes, Bushe, Kelly and McHardy2014) which reviews the same provincial PRS plus that of Nova Scotia and situates them within the wider context of numerous international PRS. Béland and Daigneault's edited-volume (Reference Béland and Daigneault2015) provides an exhaustive summary of recent developments in the closely related area of social assistance in Canada.
In general, Canadian PRS have included some combination of the following four elements (MacInnes et al., Reference MacInnes, Bushe, Kelly and McHardy2014; Reference Notten and LaforestNotten & Laforest, 2016; Reference Plante and SharpPlante & Sharp, 2014; Reference TorjmanTorjman, 2008): i) named objectives, measures, and indicators for tracking poverty reduction progress; ii) new poverty reducing policy interventions and budgetary commitments, as well as an accounting of past efforts and commitments to improving them; iv) a listing of particularly vulnerable and hard to reach populations which the plan aims to reach; and, iv) a strategy for engaging stakeholders inside and outside of government to implement, monitor and assess these efforts.
For example, in its first PRS, the Government of Nova Scotia (2009) committed to spending $155 million over and above the $200 million it already spent on poverty reduction related activities – including on things like increases to income assistance and creating more subsidised child care spaces – and listed eight particularly vulnerable groups that required specific attention. It also committed to creating a new coordinator position and committee with representatives from nine government departments to mobilise these efforts. Although the PRS did not name a specific target, timeline, and measure of progress, it committed the Nova Scotia government to doing so in the near future.
A handful of studies have reported on the social and political conditions that have given rise to specific provincial PRS in Canada and their content. Specifically, studies on PRS in Quebec (Reference DufourDufour, 2011; Noël, Reference Noël2002; Reference TorjmanTorjman, 2010), Newfoundland and Labrador (Reference Hudson and CloseHudson & Close, 2011), and Ontario (Reference Barata and MurphyBarata & Murphy, 2011; Reference Fernando and EarleFernando & Earle, 2011; Reference Hudson and GraefeHudson & Graefe, 2011)Footnote 4; and, two studies that offer a critical discourse analysis of the language used in Ontario's (Benbow et al., Reference Benbow, Gorlick, Forchuk, Ward-Griffin and Berman2016; Smith-Carrier & Lawlor, Reference Smith-Carrier and Lawlor2017).
The poverty reduction strategy process
In this paper I assess the immediate impact, if any, that PRS have had on overall provincial poverty levels. In order to do this effectively, it is important to accurately identify when we should expect this impact to occur. PRS typically unfold as a series of events beginning with a commitment, followed by some amount of consultation, the adoption of an action plan, several years of implementation, and, finally, an assessment and review (see also, Notten & Laforest, Reference Notten and Laforest2016). In several provinces, this process has also been punctuated by the adoption of related legislation.
Initial government commitments are not expected to impact poverty rates by themselves. Nonetheless, it is important to distinguish them because provinces are often given credit for meeting this relatively low hurdle. Commitments are official statements of intent by governments that they will deliver a poverty reduction action plan in the future. Commitments have been provided in a number of ways but the modal format is for them to be announced in a Speech from the Throne.Footnote 5
The provinces have varied greatly in how their initial commitments have fit into their PRS process and the time it has taken them to follow through with action plans. At one extreme, Ontario and Manitoba's official commitments actually coincided with the introduction of their action plans. Most provinces, however, deliver their action plans a year or more later. At the other extreme, Alberta committed to enacting a PRS in 2012 but has yet to deliver on it promise at the time of this writing, more than six years on.
Insofar as PRS are successful in the short to medium term, we should expect to see their impact on poverty levels coinciding with and following the delivery of action plans. Action plans state the aims of the PRS and detail what courses of action the province will take in order to meet them. Promised actions tend to include a mixture of administrative measures, adjustments to existing social programmes and services, and commitments to introduce new benefits and/or services.
The timing of action plans is relatively easy to pin down as they are delivered in the form of widely distributed policy documents. Figure 1 provides a visual summary of the timing of key PRS events in each province overlayed with the political affiliation of sitting provincial governments. The action plans are also listed and linked to in the appendix to this article. Evidently, PRS have been committed to and enacted by all kinds of governments.

Figure 1. Timing of key political and poverty reduction strategy events for each Canadian province, 2000–2017.
Over time the PRS process can become cyclical (Reference Notten and LaforestNotten & Laforest, 2016). Once initial action plans have been implemented and assessed, governments will often initiate new rounds of consultation and introduce new action plans. At the time of this writing, Quebec is in the process of implementing its third action plan, meanwhile, New Brunswick, Manitoba and Ontario are well into their second.
However, there is considerable variation in the pace of this cyclical dynamic and it is not guaranteed. Newfoundland and Labrador, the second province to adopt its first plan has yet to adopt its second after more than a decade. In contrast, Manitoba's second plan followed its first after only three years.
Quebec, Ontario, and Manitoba have also introduced and passed legislation that stipulates the timing of ongoing PRS events and ensures that the cycle is repeated at regular intervals. Insofar as the ultimate aim of PRS is long-term deliberative policy development, then legislation may yet have long-term impacts. However, we would not expect it to have short to medium term impacts independent of action plans.
Operationalising provincial poverty
Indicating poverty
This paper adopts an income-based poverty threshold rooted in an absolute concept of poverty in the space of human functioning (Reference SenSen, 1985) as being capable of achieving a modest level of subsistence and social inclusion.Footnote 6 Since the cost of achieving this outcome varies from one social milieu to another, this means adopting an income threshold that is also variable (Reference BradyBrady, 2003; Reference SenSen, 1983). At this time, the leading measure of this sort in Canada and internationally is the Low Income Measure (LIM).
The LIM is defined annually as fifty percent of national median household adjusted disposable income (Murphy et al., Reference Murphy, Zhang and Dion2010; Statistics Canada, 2016). Disposable income refers to the income that remains after government taxes and transfer have been taken into account. This amount is then divided by the square root of the number of household members in order to account for the effects of economies of scale in larger households to arrive at ‘adjusted’ disposable income.
There are two additional low income measures that are also popularly used to measure poverty in Canada: the Low Income Cut-Off (LICO) and the Market Basket Measure (MBM) (Statistics Canada, 2016). In 2018, Canada adopted the MBM as its official measure of poverty. The current version of the MBM measures the cost of a modest basket of goods needed to achieve basic subsistence and social participation in each of fifty economic regions throughout the country in 2011 (Statistics Canada, 2016).
Both the MBM and LICO are sometimes referred to as ‘absolute’ measures because they define income-based poverty thresholds that are only adjusted for purchasing power over time. These kinds of measures pose practical and conceptual problems. First, both the MBM and LICO are calculated using highly specific information that makes it difficult or impossible to calculate them for jurisdictions outside of Canada and over time. For example, as a result of the detailed price information needed to calculate the MBM it can only be calculated for Canada and only as far back as 2002.
Second, measures like the LICO and MBM, which define invariable thresholds that are only adjusted for price changes, are conceptually problematic. Although these kinds of measures tend to define poverty standards very well within particular contexts, they capture unclear standards across contexts (Reference BradyBrady, 2003).Footnote 7 For example, the MBM defines poverty based on detailed basket of goods and services in 2011. This basket, however, includes items – like being able to afford internet service – which would have been meaningless to include in the not so distant past and could change in the future.Footnote 8
In contrast, the LIM is readily calculated for all rich countries and for this reason has emerged as the leading measure of poverty globally (Reference BradyBrady, 2003) – for example, the European Union uses a variant of the LIM, the ‘at-risk-of-poverty’ measure, as its ‘headline’ poverty indicator (Reference Maquet, Stanton, Besharov and CouchMaquet & Stanton, 2012, p. 62).Footnote 9 It is also updated annually in a regular and systematic fashion and so can be used to make comparisons over extended periods of time. In fact, the LIM also fixes thresholds, but only within years.
For the above reasons, in this study, I primarily present results calculated using the LIM. Theoretically, this measure captures the same standard of deprivation across diverse contexts (Reference BradyBrady, 2003).Footnote 10 Nonetheless, since the Canadian government and some provinces recognise the MBM as their official measure, I also briefly consider outcomes based on it. This measure will be a more effective indicator of poverty nearest to the year in which it is based, 2011.
Measuring poverty levels
Once we have determined who suffers from poverty, we also need to select a way of adding these statuses up to determine the overall level of poverty in each province (Reference SenSen, 1976). In this study, I do so using both the poverty rate and interval index, which is the product of the poverty rate and the gap ratio (Reference AtkinsonAtkinson, 1987; Reference BradyBrady, 2003). Whereas, the poverty rate calculates the proportion of people whose household incomes fall below the poverty line, the gap ratio calculates the average proportionate amount by which these incomes fall short.
There are well established limitations to using only the poverty rate to assess poverty reduction efforts (Reference BradyBrady, 2003; Reference Osberg and XuOsberg & Xu, 2008). Specifically, it is insensitive to the effects of policy efforts that improve people's incomes but do not raise them above the poverty line; and, it is overly sensitive to improvements in people's incomes if they already lie near the poverty line. The gap ratio, by contrast, specifically measures improvements in income that fall short of the line. That is, it measures how poor the poor are.
The most straightforward way to understand the interval index is as a poverty rate weighted by the gap ratio. In other words, if every poor person has exactly zero income and so is ‘fully’ poor, then the interval index will take on a value that is identical to the poverty rate. However, if poor people tend to have income totalling half of the poverty threshold, then the interval index will take on a value that is half the poverty rate. (Of course, the index could also be interpreted the other way around, as the gap ratio weighted by the share of people in society that are poor.)Footnote 11
Note that when I refer to ‘poverty levels’ throughout this document I am referring to poverty rates, gap ratios, and interval indexes as a group.
Data
I carry out my study using four decades of Statistics Canada income data collected in the Survey of Consumer Finances (SCF) from 1976 to 1997, the Survey of Longitudinal Income Dynamics (SLID) from 1992 to 2011, and the Canadian Income Survey (CIS) from 2012 to 2015. Statistics Canada has done considerable work to correct for differences between the surveys that risk biasing comparisons (Statistics Canada, 2015). Data were accessed locally through the Research Data Centres (RDC) programme.
Though the SCF, SLID, and CIS contain 1,088,874 observations of individual persons spanning forty years, they are not without their limitations. For example, it should be noted that the surveys are administered by telephone and are thus unlikely to capture homeless populations. The sampling frame also excludes residents of institutions and people living on First Nations reserves.Footnote 12
The MBM estimates below were calculated based on the same underlying data but were retrieved from Statistics Canada's CANSIM Table 206-0041 and are freely available online.
Analysis
Comparing poverty levels over time
If PRS have had a short- to medium-term impact on poverty levels, we would expect poverty levels to be different and lower following the enactment of PRS action plans. Figure 2 illustrates the three kinds of trajectories in poverty rates we should see if PRS are successful.

Figure 2. Different hypothetical effects successful poverty reduction strategy action plans can have on trajectories of poverty indicators (action plan indicated by a solid vertical line).
First, PRS can have an immediate effect on poverty, reducing poverty just after when the plan is implemented and not afterward. This is illustrated in the second panel of Figure 2. This produces a discontinuity about the year the action plan is introduced but does not affect the slope of the trend.
We might expect this kind of impact when action plans enact policies that have an immediate effect on poverty rates. For example, an increase in social assistance rates which shifts household incomes above the poverty line or a workfare initiative that immediately puts people to work and increases their earned income in the short-term.
Second, PRS can have an incremental and continuous impact, so that each year they reduce poverty by some additional amount. This kind of effect does not result in a discontinuity about the year the PRS was enacted but it does reduce the slope of the poverty trend. We would expect this kind of pattern if poverty reduction efforts take time to lift people out of poverty and induce positive cumulative effects. It is illustrated in the third panel of Figure 2.
If immediate increases to social assistance improve people's capacity to balance work and family so that they can excel at both, and/or make investments in themselves that can lead them to pursue more favourable labour market outcomes, we would expect it to have a cumulative effect on poverty reduction over time. The effects of government initiatives can also take time to have effect, either because it takes time for them to reap benefits, such as in the case of investment in upskilling, or because it can take governments time to enact programmes.
Finally, a successful PRS can have some combination of both an immediate and ongoing impact on poverty levels as illustrated in the fourth panel in Figure 2.
Descriptive estimates
In this study, my objective is to determine whether overall poverty levels tend to be lower after PRS than before. If PRS are merely being used by governments as window dressing, we would expect poverty rates to be the same or worse before and after their introduction. Because this work is exploratory and my focus is their unconditional impact on poverty levels, I adopt a straightforward descriptive approach.
Poverty action plans commonly apply to five year intervals. For this reason, I focus on making comparisons between the five years leading up to their enactment and the five years following them, including the year in which they were enacted. Making comparisons between shorter intervals risks missing the impact of initiatives that take time to implement and/or have effects; but, making comparisons between longer intervals risks diluting their impact. Five years strikes a reasonable balance between these conflicting concerns.
In order to situate these developments in historical context, I examine trends in five-over-five year changes in poverty in the years between 1981 and 2011 and contrast these with the five-over-five year changes in the years that PRS were implemented.Footnote 13 I then turn my attention to the specific nature of these trends around PRS. I focus primarily on first action plans because too few years have passed since most provinces enacted their second plans.
Poverty levels are statistical estimates and so entail a certain amount of sampling error. Using the approach advised by Osberg and Xu (Reference Osberg and Xu2000), for each estimate I calculated in the RDC, I calculated bootstrap standard errors using 500 iterations.
When I tabulate multi-year average poverty levels and their standard errors, I begin by calculating poverty estimates and standard errors within each year separately. I then combine these by weighting each year equally and taking their means over the time interval of interest.Footnote 14
Results
Effects in historical context
Figure 3 illustrates all five-over-five year changes in the national and provincial poverty rates in Canada between 1981 and 2011. No change is indicated in this figure by a solid line in each panel. When the five-over-five year markers are above the solid line, poverty rates have increased, and, when they lay below the line, poverty rates have decreased.

Figure 3. Five-over-five year average changes in poverty rate among the Canadian provinces, 1980–2010 (Source: SCF, SLID & CIS).
Broadly speaking, changes in poverty rates, both positive and negative, have been the historical norm among the Canada's provinces. The province with the steadiest five-over-five year changes has been Alberta although even it regularly experiences fluctuations in excess of 1 percentage point. At the other extreme, PEI saw fluctuations of nearly 5 percentage points in the 1990s.Footnote 15 On average, all the provinces have seen periods in which poverty rates tended to increase, and others in which they tended to decline.
The enactment of provincial action plans are indicated in Figure 4 by white circles. Over the course of the thirty year period of observation, in not a single province does the largest decrease in five-over-five year changes in poverty rates coincide with the enactment of PRS. Even Newfoundland and Labrador's substantial five-over-five year change of −4.5 percentage points in 2006 is not as great as the −5.3 percentage points change it experienced in 1988.
The timing of most action plans is also notable.Footnote 16 The first action plans in Newfoundland and Labrador, Nova Scotia, New Brunswick, and Quebec all occurred after prolonged periods of decreases in five-over-five year changes in poverty rates. That is, when their patterns of change in poverty rates were the most promising they had been in more than a decade. The timing of Manitoba's action plan follows a similar though more muted downward historical trend in changes.Footnote 17
Although the introduction of Saskatchewan's action plan happened too recently to be shown in Figure 4, it too was introduced following a prolonged period of declining poverty rates. Meanwhile, though it is yet to enact an action plan, Alberta's poverty levels have been declining steadily since the mid-1990s.
The only province to enact a PRS when changes had been previously on the rise is Ontario in 2008. Quebec's second action plan also followed a recent uptick in five-over-five year changes in poverty levels.
The last panel in Figure 4 superimposes all of the information of the previous panels onto one. It shows that in addition to provincial trends in changes there have also been national level trends. Levels were more likely to decline in the country as a whole in the 1980s and early 1990s and increase in the late 1990s. In the 2000s, poverty levels were again more likely to decline.
Immediate effects of poverty reduction strategies
For the provinces that have enacted PRS, Figures 4 and 5 illustrate poverty rate and interval index trends in the five years preceding their adoption and five years following, including the year in which they were adopted. In order to more clearly illustrate the trend in poverty levels before and after action plans, OLS regression lines are fitted for each interval. The last panel superimposes all these trends onto one.

Figure 4. Before and after PRS poverty rate trajectories among adopting Canadian provinces using LIM (action plan indicated by the solid vertical line) (Source: SLID & CIS).

Figure 5. Before and after PRS interval index trajectories among adopting Canadian provinces using LIM (action plan indicated by a solid vertical line) (Source: SLID & CIS).
Evidently, there has been no single pattern in poverty levels around the introduction of provincial PRS.
Newfoundland and Labrador is the only province that exhibits the pattern depicted in Panel 2 of Figure 2 in poverty rates, wherein the introduction of a PRS has an immediate impact. However, even though poverty rates continued to decline after the introduction of the plan, the slope remained the same, suggesting that the plan may not have had a continuing impact.
Meanwhile, in Nova Scotia and Manitoba, though plans did not have an immediate effect, they do appear to have had the kind of ongoing incremental impact illustrated in in Panel 3 of Figure 2 in the years that followed.
These positive developments, however, are somewhat muted when we also take into account the depth of poverty using the interval index in Figure 5. Though in Newfoundland and Labrador we continue to see an immediate drop in poverty around the enactment of its PRS, year-over-year incremental gains stop. Similarly, Manitoba and Nova Scotia experience a reversal in fortunes in their incremental gains.
Negative discrepancies between trends in the poverty rate and the interval index suggest that developments in the gap ratio in these provinces are at odds with developments in their rates. In other words, even as provinces may be reducing the number of poor individuals in their provinces, the poverty of those that remain poor is becoming worse. This could reflect, for example, the result of an immediate increase in social assistance rates that raises households near the poverty line out of poverty but hardly improves the status of the poorest.
Trends in PEI, Ontario and New Brunswick have generally been at odds with what we should expect to be the impact of successful PRS efforts. In PEI and Ontario, poverty rates continued upward after PRS and these developments were even more pronounced when we consider the interval index. Meanwhile, in New Brunswick, although its poverty rate and interval index had been trending downward before the enactment of its PRS they flattened out afterward.
Interestingly, Quebec, the province other than Newfoundland and Labrador that has perhaps been most celebrated for achieving reductions (Reference DufourDufour, 2011; Noël, Reference Noël2002; van den Berg et al., Reference van den Berg, Plante, Raïq, Proulx and Faustmann2017), saw its poverty rate increase incrementally after the enactment of its first PRS. However, the increases in the interval index are more muted, suggesting that the province may have still seen some success in reducing poverty levels among its most poor (see also, van den Berg et al., Reference van den Berg, Plante, Raïq, Proulx and Faustmann2017).
These mixed results are further evidenced in Tables 1 and 2 which contrast average poverty rates and interval indexes for the five years before and after first and second action plans. Whereas, negative changes in poverty rates following first action plans are substantial and statistically significant in Newfoundland and Labrador and New Brunswick, they are positive and statistically significant in Ontario. The negative change in Newfoundland and Labrador is muted in both provinces when we consider the interval index and only remains statistically significant for the former. Ontario's positive increase is also muted.


Whereas PEI exhibits a positive increase in poverty levels between the five years preceding and following the enactment of its first PRS, this difference is only statistically significant when developments in the depths of its poverty are taken into account using the interval index.
Developments in the poverty rates and interval indexes around second actions plans have not been statistically significant for all three provinces that have enacted them. It should be noted that since Ontario and Manitoba enacted their second action plans after 2011–2014 and 2012, respectively – results for these provinces are censored and may change as data for later years becomes available.
Contrasting the illustrated results in Figures 4 and 5 with the tabulated estimates in Tables 1 and 2 underscores why we should not stop at just five-over-five year before and after action plan comparisons. For example, in Manitoba and Nova Scotia, poverty rates increased in the years leading to their first action plan and declined afterward. Even though visual inspection of the trends suggest success, when we compare the averages between these periods they cancel each other out.
Meanwhile, in New Brunswick, poverty levels declined before they levelled out or increased. As a result, the province's average rates tended to be lower after they enacted their action plan, even though poverty reductions had actually stalled.
Does the choice of threshold affect these results?
Although the LIM is a more widely recognised measure of poverty globally (Reference BradyBrady, 2003), the Canadian government has adopted the MBM as the official Canadian measure of poverty (GoC, 2018). In order for this study to inform Canadian conversations it helps to consider whether the above results carry over when that measure is used. Figure 6 replicates Figure 5 using that measure.
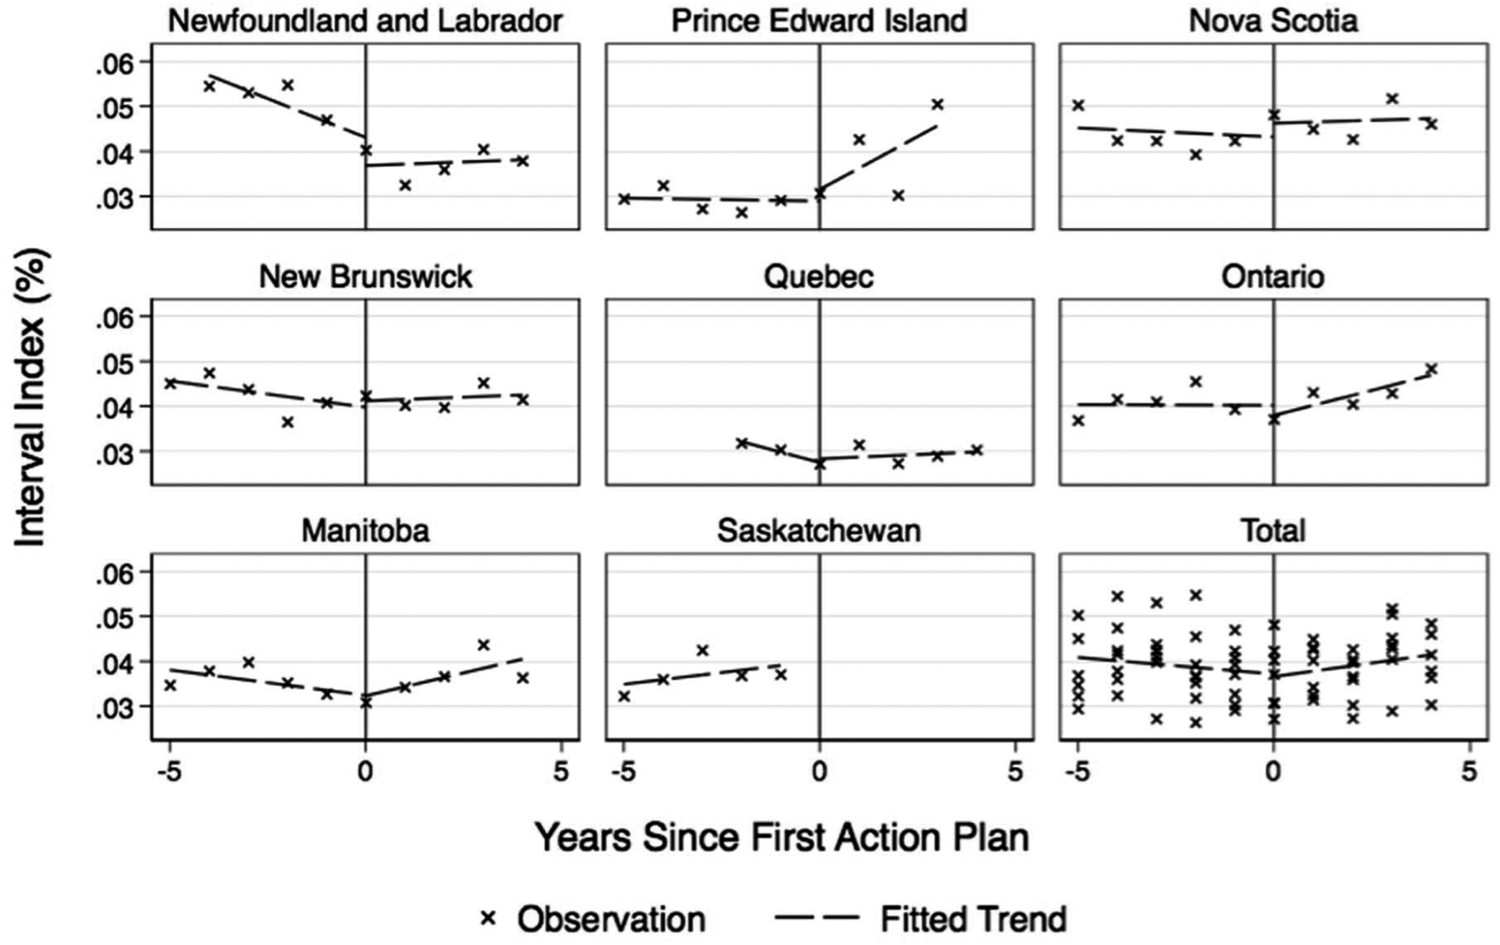
Figure 6. Before and after PRS interval index trajectories among adopting Canadian provinces using MBM (action plan indicated by a solid vertical line) (Source: SLID & CIS).
Evidently, although the overall levels tend to be lower, the fitted tends are virtually identical. Note that the result is censored for Quebec and Newfoundland and Labrador since the MBM can only be calculated back to 2002 and Quebec's first PRS was issued within five years of that year.
Discussion
Policy or window dressing?
Empirical poverty trends before and after PRS suggest that some provinces did indeed reduce poverty, at least measured by the rate, in the years that followed – specifically: Newfoundland and Labrador, Nova Scotia, and Manitoba. However, the PRS of just as many provinces had no discernable impact on poverty and may have even increased it. Moreover, the largest five-over-five year decreases in poverty occurred in earlier periods, decades before the invention of PRS.
Broadly speaking, these empirical findings suggest that PRS cannot be counted on to reduce poverty unconditionally, at least in the short-term. At best, PRS are failing to achieve their stated objective of meeting the complexity of poverty head on and are instead being overwhelmed by it in the years that immediately follow them (Reference Evans and MitchellEvans & Mitchell, 2011). At worst, these results lend support to the accusation that PRS are being used by governments as window dressing.
Having said this, even though poverty levels have not tended to decline following PRS, they have tended to decline leading up to them. If it is indeed the case that governments are using PRS as window dressing, then this result suggests that they are using them to showcase and claim credit for past poverty reduction achievements and not simply to gloss over failures or inaction. This credit claiming could be being engaged in constructively or dishonestly.
The possible use of credit claiming to dress up policy efforts appears to be particularly prevalent as far as first action plans are concerned. At the time of this writing, there is too little information on poverty levels surrounding second action plans to say anything conclusive about them, but their use as window dressing could be mitigated by the kinds of legislative and institutional restrictions that initial commitments and action plans put in place.
Constructive credit claiming
Insofar as PRS are being used to honestly to showcase achievements, governments could also be attempting to use them as a catalyst for advancing further gains in the face of diminishing returns. As poverty levels fall, the remaining poor are more likely to be the most vulnerable of the vulnerable and policy efforts may need to be increasingly targeted and coordinated in order to ensure further gains. Governments that have already been successful at reducing poverty could be trying to use PRS to squeeze out further reductions at the margins.
Perhaps the PRS most likely to fit this mould is Quebec's. In the late 1990s, the province enacted a host of major social reforms (Reference DufourDufour, 2011; Noël, Reference Noël2002; Reference TorjmanTorjman, 2010). According to van den Berg et al. (Reference van den Berg, Plante, Raïq, Proulx and Faustmann2017), the province's introduction of more generous parental leave and affordable childcare, in particular, marked a social investment turn that was distinctive within Canada and which brought the province's poverty levels among families in line with those of the nordic countries on the other side of the Atlantic – the aforementioned ‘industrialized nations having the least number of persons living in poverty.’
In fact, Quebec's second poverty reduction strategy commented on the achievements of its earlier poverty reduction efforts among families and committed to increasing the province's Working Income Tax Benefit and Solidarity Tax Credit in order to alleviate poverty among singles and couples without children (GoQC, 2010). Nonetheless, as we have seen, these measures do not appear to have had a discernible impact on overall poverty levels.
If it is indeed the case that governments have been using PRS to achieve increasingly hard-fought reductions in poverty, however, the evidence so far suggests that these efforts have not initially tended to be successful.
Dishonest credit claiming
Conversely, governments could also be introducing PRS following reductions in poverty to try to acquire credit for outcomes they had little to do with. Until relatively recently low-income estimates have taken three or more years to make their way out of Statistics Canada. As a result, expert and public conversations about poverty in Canada have ordinarily tended to lag behind outcomes by at least three years. This dynamic could have encouraged this kind of credit claiming for poverty reductions in the recent past.
New governments could be enacting action plans to take credit for the achievements of past governments. As evidenced in Figure 1, however, the majority of action plans have actually been released after governments have been in power for at least five years. In Quebec – the only province in which we see a government enacting an action plan in its first year of government – the initial commitment to creating a PRS was made by the Parti Quebecois after many years in power, although the Liberal government which enacted the province's first action plan may have been more inclined to since it drew attention to what was primarily a good news story.
Or, governments could be using the introduction of PRS to claim credit for beneficial macroeconomic developments over which they had little control. Interestingly, in the final panel in Figure 3, we see that the rising popularity of first PRS in the late aughts coincided with a nationwide downward trend in changes in poverty levels over time. PRS that emerged later in the aughts are those that would have most likely been used to try to take credit for poverty reductions provincial governments had little to do with.
Anecdotally, downward poverty trends during this time in Saskatchewan were indeed a key talking point raised by PRS advocates in their meetings with decisions makers. In fact, a figure was even produced illustrating the recent downward trend and projecting it forward in order to show that the province could achieve further poverty reductions if it only followed its current course.Footnote 18
However, Saskatchewan's anti-poverty advocacy community did not regard the policies of the provincial government as having been responsible for these developments. They regarded them as having resulted from booming commodities prices and oil sector expansion in nearby Alberta that increased economic opportunities in Saskatchewan (Reference EmeryEmery, 2013) but which cannot be depended on. Hence their disappointment when the province's first PRS introduced no new initiatives.
Practical lessons for long-term poverty reduction
At their best, PRS can create an opportunity for deliberative evidence-based policy learning (Reference Notten and LaforestNotten & Laforest, 2016). Just because the decisions of governments to enact first action plans may be encouraged by past reductions in poverty does not mean that PRS cannot play an important role in poverty reduction efforts afterward. This kind of benefit is most likely to be realised in provinces that have stipulated regular review and updating of their PRS, possibly through legislation, and identified accountable parties.
So far, the Canadian provincial experience with PRS and their unconditional impact (or non-impact) on poverty levels offers a handful of lessons for Canadian and international policy makers and advocates. At the time of this writing, early 2018, several Canadian cities, at least two provinces, and the federal government are in the process of creating their first PRS. Meanwhile, the second and/or third PRS of other provinces are due soon. These jurisdictions should be mindful that the mere existence of their PRS does not by itself ensure that poverty levels will decline.
First, not all PRS are created equally and what is included in them matters. Although the bulk of Quebec's poverty reduction achievements preceded the enactment of its PRS, it succeeded in reducing poverty to the extent that it did because it defined a tangible target for its efforts, children and families, and then enacted policies that addressed their needs (van den Berg et al., Reference van den Berg, Plante, Raïq, Proulx and Faustmann2017). However, this kind of targeting should be carried out with a degree of caution as reductions in poverty among target groups should not be achieved at the expense of others.Footnote 19
Second, commitment from elected and unelected decision makers is also likely to play an important role in the success of PRS. Much of Newfoundland and Labrador's successful poverty reduction efforts in the early-aughts coincided with the leadership of the charismatic Progressive Conservative Premier Danny Williams (Reference Hudson and GraefeHudson & Graefe, 2011). The absence of any binding instruction to renew the plan, and a lack of buy-in from leaders since, have led to that province not having another PRS enacted and thus not having the opportunity to benefit from any kind of iterative policy learning process.
Even if government interest in reducing poverty wanes, a well-crafted PRS should be able to ensure sustained action on poverty behind the scenes that can provide a backdrop for when interest returns. Mandated regular assessments, consultation processes, and new plans, even if released to little fanfare in the interim, can provide concerned citizens and decision makers with regular opportunities to coordinate and improve their poverty reduction efforts.
Thus, a third lesson: insofar as the objective of PRS is to ensure an opportunity for sustained policy learning, advocates and policy makers should not just focus on the immediate benefits and services they enact but also consider the wider procedural context that they contribute to. Do they, for example, ensure regular and binding engagement with poverty reduction? This can be achieved by identifying long-term accountable parties and institutions and establishing regular PRS review and renewal, potentially, by legislating them.
There are many opportunities for the research community to advance these efforts. Not least among them, more in-depth comparative analysis of PRS and their impacts of the sort already begun by Notten and Laforest (Reference Notten and Laforest2016) and MacInnes et al. (Reference MacInnes, Bushe, Kelly and McHardy2014). Also, continued study of the policy making process around provincial PRS. So far this work has already been advanced for Ontario (Reference Hudson and GraefeHudson & Graefe, 2011), Quebec (Reference DufourDufour, 2011), and Newfoundland and Labrador (Reference Hudson and CloseHudson & Close, 2011).Footnote 20
Conclusion
In this paper I present a bird's-eye view of the impact that PRS have had on poverty levels among the Canadian provinces. As opposed to focusing on the content and administration of PRS, I take their stated aim – to reduce poverty – at face value and explore whether their enactment is indeed associated with unconditional reductions in overall poverty. Working with forty years of Statistics Canada data I am able to also situate their impacts in historical context.
I find that the enactment of first PRS through actions plans has not generally been associated with reductions in poverty rates. While there are provinces whose poverty rates have fallen following the introduction of plans – namely Newfoundland and Labrador, Nova Scotia and Manitoba – there have been just as many that have seen poverty fortunes stall or become worse. Moreover, even the provincial success stories were more muted when the depth of poverty was also taken into account. The lack of discontinuity in poverty levels about the introduction of PRS suggests that they have tended to have an ongoing rather than immediate impact.
In historical context, most first actions plans have actually tended to follow sustained poverty reductions rather than given rise to them. This suggests that either PRS are being swamped by other determinants of poverty, such as the economy or the demographic makeup of their provinces, or that PRS may be being used by governments to showcase and claim credit for recent achievements around poverty reduction. The latter consideration is consistent with the window dressing hypothesis although it casts it in a somewhat more favourable light: governments are not enacting PRS to dress up failures but to underscore successes.
Still, there are reasons to remain optimistic about the unconditional promise of PRS. Notten and Laforest (Reference Notten and Laforest2016) suggest that their ultimate promise may not lay with their immediate impact on poverty but rather with how they change institutional relationships and norms and introduce new opportunities for learning, which are likely to have a longer terms impacts. These kinds of impacts will be most likely in provinces that have committed to reviewing and updating action plans at regular intervals.
Only time will tell whether Canada's provincial PRS will give rise to the kinds of long-term deliberative evidence-based policy learning advocated for by Sanderson (Reference Sanderson2009). In global context, poverty reduction remains an important policy objective (Noël, Reference Noël2006). At the very least, in the context of ‘permanent austerity’ (Reference PiersonPierson, 1998), Canadian poverty outcomes suggest that PRS may offer a rare opportunity for decision makers to engage in affordable credit claiming (Reference Bonoli, Bonoli and NataliBonoli, 2012).
Acknowledgements
A previous version of this paper was presented at the Canadian Research Data Centre Network National Conference in October 2014. The author thanks Daniel Béland, Alex Waddan, Geranda Notten, and anonymous reviewers for their comments and suggestions.
Disclosure statement
No potential conflict of interest was reported by the author.
Appendix: Provincial PRS action plans
Newfoundland and Labrador
Newfoundland and Labrador enacted its first PRS action plan in June 2006 and has not enacted another since. The Progressive Conservative government of the day made its commitment to enact such a plan in its Speech from the Throne the previous year, GoNL (2006).
Prince Edward Island
The Liberal government of Prince Edward Island delivered the province's first PRS action plan in May 2012. The plan fullfilled a commitment made in its Speech from the Throne in 2010, GoPE (2012).
Nova Scotia
Near the end of their decade long-term in office, the Progressive Conservative led Government of Nova Scotia released the province's first and only PRS action plan to date. This followed the government's commitment to establish this plan with Bill 94 – An Act to Establish a Poverty Reduction Working Group, GoNS (2009).
New Brunswick
The Liberal Government of New Brunswick launched that province's first PRS action plan in 2009 following an initial commitment in 2008. This enactment was followed by legislation in the form of Bill 39 – Economic and Social Inclusion Act. In 2014, the province launched its second action plan under a Progressive Conservative government, GoNB (2009, 2014).
Quebec
Quebec introduced its first PRS action plan in April 2004 under a Liberal government. This followed an initial commitment made by the previous Parti Quebecois government in the form of a motion to the Assemblée Nationale in 2000 and legislation – L-7 – Act to Combat Poverty and Social Exclusion – it passed in 2002. The same Liberal government that enacted the province's first action plan enacted its second in 2010, and a subsequent Liberal government encatd its third in 2017, GoQC (2004, 2010, 2017).
Ontario
Ontario launched two action plans under one continuous Liberal government, first in 2008 and again in 2014. Unlike in many other provinces, the action plan was not preceded by a public commitment to devise a plan. In 2009, the province adopted poverty reduction legislation: Bill 152 – Poverty Reduction Act, GoON (2008, 2014).
Manitoba
Manitoba enacted its first PRS action plan in 2009 under an NDP government. As in Ontario's case, the plan came without a prior commitment. Following the passing of The Poverty Reduction Strategy Act in 2011, the same government released the province's second action plan in 2012, GoMB (2009, 2012).
Saskatchewan
In its 2014 Speech from the Throne, the the center-right Saskatchewan Party led government committed Saskatchewan to creating a PRS. This plan was introduced by the same government in 2016, GoSK (2016).
Alberta
In a 2012 pre-election promise, Alison Redford committed Alberta to creating a PRS action plan under her Progressive Conservative government. Despite completing widespread consultations, more than five years on and a change in government, this plan has yet to materialise.
British Columbia
In 2017, the latest NDP led British Columbia government committed to develop its first PRS. This was the final province to make this commitment. According to news reports, an action plan and legislation are expected in 2018.


