


Introduction
The alleviation of poverty is among the main goals of the welfare state (Barr, Reference Barr2012). It has been also argued that the existence of poverty can be seen as a measure of the effectiveness of social policies (Beckerman, Reference Beckerman1979). However, there are various approaches to defining or measuring poverty. In the context of rich welfare states, the preference is to use a relative definition of poverty, which usually means having less than other members of society (Goedemé & Rottiers, Reference Goedemé and Rottiers2011). Absolute poverty, on the other hand, indicates that an individual has less than a certain specified minimum (Goedemé & Rottiers, Reference Goedemé and Rottiers2011).
Relative poverty thresholds are typically defined in terms of the distance from average household income. Measures using these thresholds are frequently used for evaluating trends in economic disadvantage and the effectiveness of public policies. However, it is likely that linking the threshold with changes in average income affects poverty rates for some population subgroups more than for others. This can occur due to two reasons: (1) some population subgroups are more connected to the labour market and can experience more year-to-year variation in income and (2) some population subgroups have, on average, income that is more close to the poverty threshold. This study focusses on age groups since it is reasonable to assume that there are differences between age groups regarding these factors.
This exploratory study focusses on the most widely used poverty measure in the European Union (EU) and investigates whether there are typical patterns related to changes in age-specific poverty rates. It is analysed whether the magnitude and direction of changes in at-risk-of-poverty (AROP) rates vary between age groups. Magnitude refers to the size of changes in poverty rates, and direction refers to either a decrease or an increase in the poverty rate. Also, it is analysed how changes in age-specific poverty rates are associated with changes in poverty thresholds, income and employment. The aim is to seek for general tendencies regarding the changes in the poverty rates instead of inspecting the effects of, for instance, different welfare state policies. Illustrating general patterns deepens the understanding related to the poverty outcomes when the AROP measure is applied. The analysis uses three age groups: children (0–17), the working-age population (18–64) and the older population (65+). The study utilizes a large number of countries and multiple periods of different length. It is based on European Union Statistics on Income and Living Conditions (EU-SILC) microdata and focusses on the development of poverty rates in 30 European countries around the mid-2010s.
Since this study focusses on the AROP measure, the paper starts by discussing the history, background and strengths and limitations of the measure. This is followed by a discussion on why the risk of poverty varies between age groups and why the changes in the poverty threshold can have a larger impact for some age groups than for others. These are followed by sections on data and methods, results, and conclusions.
Measuring relative monetary poverty
The EU defines poverty as follows: “People are said to be living in poverty if their income and resources are so inadequate as to preclude them from having a standard of living considered acceptable in the society in which they live” (European Commission, 2004). In other words, poverty is not only about meeting basic needs, but about exclusion from a minimum acceptable way of life. Overall, poverty is typically seen as a multidimensional social problem (Atkinson et al., Reference Atkinson, Cantillon, Marlier and Nolan2002; Nolan & Whelan, Reference Nolan and Whelan2011), and the literature uses a wide range of different poverty measures (eg. Atkinson et al., Reference Atkinson, Cantillon, Marlier and Nolan2002; Kangas & Ritakallio, Reference Kangas, Ritakallio and Andreß1998). These measures often follow the most common definitions of poverty and concentrate on lack of resources. Consequently, based on access to resources and a calculation of a poverty threshold, households are classified as either poor or non-poor.
A single measure cannot capture all dimensions of poverty at the same time (Spicker, Reference Spicker2012). Nevertheless, most research uses a similar monetary poverty measure in which the threshold is calculated as the distance from average income (typically median). This can be described as a “floating” threshold (Decancq et al., Reference Decancq, Goedemé, Van Den Bosch, Vanhille, Cantillon and Vandenbroucke2013; Marx, Vandenbroucke, & Verbist, Reference Marx, Vandenbroucke and Verbist2012). In the EU, the threshold is set at 60 per cent of national median disposable equivalent income. This indicator has a relative character because poverty is assessed in reference to the general or average level of prosperity of others in society (Goedemé & Rottiers, Reference Goedemé and Rottiers2011). While considering the level of income of an average household as a basis for a poverty threshold has a long history (see Townsend, Reference Townsend1962), this particular threshold emerged in the UK after it was adopted by the UK as a target level in dealing with child poverty around the turn of the millennium (Spicker, Reference Spicker2012). The EU has since adopted this approach as well, calling it the “at-risk-of-poverty indicator” (Atkinson et al., Reference Atkinson, Cantillon, Marlier and Nolan2002; Marlier et al., Reference Marlier, Atkinson, Cantillon and Nolan2007). Since 2001, this indicator has been officially used to measure poverty and social inclusion in the EU (Atkinson et al., Reference Atkinson, Cantillon, Marlier and Nolan2002; Marlier et al., Reference Marlier, Atkinson, Cantillon and Nolan2007). It is also included in the composite measure used by the EU to evaluate the EU 2020 target regarding the number of individuals in “at risk of poverty or social exclusion” (eg. Nolan & Whelan, Reference Nolan and Whelan2011).
Despite its popularity, accessibility, reasonability and ease of use (Spicker, Reference Spicker2012), the AROP measure has its limitations. First, it can be argued that there is a mismatch between the definition and measurement of poverty. Definitions of poverty refer to a widely accepted standard of living. AROP does not measure this standard (Spicker, Reference Spicker2012) but rather the living conditions prevailing in society. Second, as the poverty threshold is based on median income, half of the population cannot be counted as poor (Spicker, Reference Spicker2012). Third, the choice of the distance to the median income is somewhat arbitrary (Nolan & Whelan, Reference Nolan and Whelan2011). Fourth, the poverty rates produced by AROP do not necessarily highlight the differences between member states in living standards in a meaningful way (Guio, Reference Guio2005). Fifth, the measure does not take into account that economies of scale at the household level vary across the income distribution and across countries (Goedemé et al., Reference Goedemé, Penne, Hufkens, Karakitsios, Bernát, Franziskus, Simonovits, Álvarez, Kanavitsa, Parcerisas, Romaní, Mäkinen, Matsaganis, Arlotti, Kopasz, Szivós, Ritakallio, Kazepov, Van Den Bosch, Storms, Cantillon, Goedemé and Hills2019). Sixth and finally, changes in median income – due to economic downturns, eg. – can result in unexpected swings in poverty rates (eg. Goedemé, Collado, & Meeusen, Reference Goedemé, Collado and Meeusen2014; Jenkins, Reference Jenkins2020). This is related to the fact that changes in median income can move households across the AROP threshold without any real changes in living standards.
This study gives new information on the last-mentioned notion. While changes in the poverty threshold probably only explain a small fraction of all poverty exits or entries, it is possible that for some population subgroups these changes have larger effects. This can result in some population subgroups experiencing, on average, larger changes in AROP rates. In addition to the magnitude, also the direction of changes in the rates can differ due to this reason: for instance, if the median income increases due to economic and employment growth, and there are population subgroups that are not necessarily affected by this growth and have, on average, a low level of income.
Income structure and risk of poverty varies between age groups
This study considers that there can be important differences between age groups regarding the effects of so called “floating” poverty thresholds. The most important reasons are related to the differences in the connectedness to the labour market, income structure and the level of income. The most notable differences can be expected to be found between old-age individuals and other age groups.
There is a long tradition of research that explores poverty during different stages of life. According to Rowntree’s (Reference Rowntree1901) path-breaking study on poverty in York, the risk of poverty was highest during childhood, when building a family, and in old age. It was lower during youth and after the children had left home. Subsequently, there has been a universal decline in poverty among older people, and the highest rates of poverty are now reported for young adults (Ebbinghaus, Nelson, & Nieuwenhuis, Reference Ebbinghaus, Nelson, Nieuwenhuis and Greve2019; Kangas & Palme, Reference Kangas and Palme2000; OECD, 2019). In most OECD countries, the old-age income poverty rate is now lower than for the population as a whole (Ebbinghaus, Nelson, & Nieuwenhuis, Reference Ebbinghaus, Nelson, Nieuwenhuis and Greve2019). Previously, the lowest poverty rates were reported for the working-age population (OECD, 2014).
Generally speaking, families with and without children are not equally well off in terms of the disposable income that is needed for adequate social participation (Penne et al., Reference Penne, Hufkens, Goedemé and Storms2020). This ties in with the important role of social transfers in tackling both child (Bárcena-Martin, Blanco-Arana, & Perez-Moreno, Reference Bárcena-Martin, Blanco-Arana and Perez-Moreno2018) and single mother poverty (Van Lancker, Ghysels, & Cantillon, Reference Van Lancker, Ghysels and Cantillon2015). The socio-demographic characteristics associated with child poverty are single parenthood, a large family, low education and lack of employment (Gornick & Jäntti, Reference Gornick and Jäntti2012; TÁRKI, 2010).
The extent of unemployment or economic inactivity and their distribution across households is important in assessing the poverty risk of working-age individuals (Lelkes, Medgyesi, & Tóth, Reference Lelkes, Medgyesi, Tóth, Ward, Lelkes, Sutherland and Tóth2009). Overall employment trends are obviously important, but so too is the question of which households benefit from rising employment (Cantillon, Reference Cantillon2011). Additionally, there is an important interplay between employment trends and relative monetary poverty thresholds since increases in employment increase median income making it more difficult for individuals to escape poverty (eg. Marx, Vandenbroucke, & Verbist, Reference Marx, Vandenbroucke and Verbist2012). The generosity of social transfers also has a bearing on the poverty risk of working-age individuals (Cantillon, Reference Cantillon2011; Jacques & Noël, Reference Jacques and Noël2021). Jobless and one-person households have a particularly high poverty risk (Lelkes, Medgyesi, & Tóth, Reference Lelkes, Medgyesi, Tóth, Ward, Lelkes, Sutherland and Tóth2009).
One of the main characteristics of older individuals is their withdrawal from paid employment and transitioning into retirement. Retirement brings a substantial reduction in labour force activity, a reduced level of income and a lower likelihood of income fluctuations. The most common statutory retirement age in the EU is 65 years (European Commission, 2015). Economic fluctuations can have a smaller effect on the actual living standards of the older population than on younger age groups because older households have a smaller number of members who are in the work force. However, with respect to the rates of monetary poverty, the effects can be, in fact, larger since the income of older individuals is often close to the poverty threshold (Iacovou, Reference Iacovou, Atkinson, Guio and Marlier2017). Women, the low educated, those from a migration background and those living in a single-adult household are among the subgroups with a higher risk of old-age poverty (Ebbinghaus, Nelson, & Nieuwenhuis, Reference Ebbinghaus, Nelson, Nieuwenhuis and Greve2019). The differences in old-age poverty between European countries are also linked with differences in pension systems, such as the role of minimum income provision of public pension systems (Ebbinghaus, Reference Ebbinghaus2021).
Research questions
Considering the characteristics of the AROP measure and the factors that relate to age groups’ level of income and income development, this exploratory study addresses following research questions:
-
• Can age-group-specific patterns be detected in the magnitude and direction of changes in AROP rates?
-
• What role do changes in poverty thresholds have in explaining age group differences in poverty trends?
-
• How are the development of the employment rate and income associated with changes in poverty rates across age groups?
Data and methods
Data
The analyses are based on EU-SILC microdata. These data include information on income, poverty and living conditions.Footnote 1 EU-SILC covers all EU countries as well as a number of countries participating on a voluntary basis.
This research analyses poverty development from 2013 to 2018, a period for which EU-SILC provides the most comprehensive country coverage. The results of this study are based on information from 30 countries.Footnote 2 The financial crisis around 2008–2012 caused some substantial year-on-year changes in poverty rates in Europe, but this economically turbulent period has no major effect on the results reported here. The focus of analysis was on changes happening during the periods 2017–2018, 2015–2018 and 2013–2018. This study focusses on these periods because during a short period of time changes in the poverty threshold can be expected to have more influence on households’ poverty status. Additionally, the inclusion of multiple periods makes it possible to monitor changes occurring during periods of different length and reduces the impact of the baseline year on the results. Overall, these periods were characterized by relatively steady economic growth in Europe. For the sake of simplicity, the analyses were restricted to three age groups: children (0–17), working-age (18–64) and older people (65+). These represent the most studied age groups in previous research.
Measures of poverty and statistical methods
Both floating and fixed poverty thresholds were used. The floating AROP threshold was set at 60 per cent of national median disposable equivalent income. This threshold was used unless otherwise specified. In addition, a floating 50 per cent threshold and a fixed threshold were used. A “fixed” (or anchored) poverty threshold refers to one that is kept constant in real terms. In the case of fixed thresholds, the first step was to calculate a floating poverty threshold, and this threshold was then adjusted for changes in prices for subsequent years. Poverty rates calculated using a fixed poverty threshold in 2018 were compared to the AROP rates from the baseline year (2013/2015/2017). A so-called modified OECD scale was used to equivalise income, ie. to adjust the income of households of different size.Footnote 3
To analyse the magnitude of changes in poverty rates in different age groups, the changes were illustrated in both absolute (percentage points) and relative (percentages) terms. Relative changes take into account that the absolute size of changes could be associated with level of poverty. The changes were also analysed using absolute values as one of the aims was to illustrate whether there are age group differences in the size of changes in poverty rates regardless of the direction (decrease or increase) of the change. The changes were also analysed using the coefficient of variation.
This study also analysed the statistical significance of changes in age groups’ AROP rates. First, the standard error for the difference in AROP rates was calculated using information on the standard errors of cross-sectional poverty rates. If zero was not included in the 95 per cent confidence interval of the difference in rates, a statistically significant change was concluded.Footnote 4 EU-SILC is a sample survey and therefore it was necessary to take account of the survey design in order to obtain correct standard errors for each country and each year. New variables for primary sampling units and strata were used in the estimation to obtain correct standard errors (Goedemé, Reference Goedemé2013).
Furthermore, it was studied whether changes in age groups’ AROP rates move the total population AROP rate in the same direction. The contribution of changes in age groups’ AROP rates to the changes in the total population AROP rate was examined using a shift-share analysis. Shift-share analysis is a simple decomposition method for distinguishing the roles of, eg., changes in population subgroups’ population shares and poverty rates (eg. Marx, Vandenbroucke, & Verbist, Reference Marx, Vandenbroucke and Verbist2012). The shift-share decomposition can be carried out because the AROP measure is additively decomposable: the rate is the weighted sum of the different subgroups’ rates. Since this research focusses on analysing changes over time, changes in one component (age groups’ population share or AROP rate) between two time points was multiplied by the average value of the other component. These coefficients illustrate the contribution of changes in population shares and AROP rates for each age group.
Pearson’s correlation coefficients were used to analyse how poverty rates calculated using floating and fixed poverty thresholds are associated. A comparison of these rates yields information on how changes in poverty thresholds explain changes in poverty rates over time (Goedemé, Collado, & Meeusen, Reference Goedemé, Collado and Meeusen2014). Furthermore, correlation coefficients were used to investigate how changes in the employment rate and income are associated with changes in poverty rates. Information on annual employment rates for 15–64-year-olds was derived from Eurostat (Eurostat, 2021). A change in the employment rate refers to the percentage point change between 2018 and baseline year. Employment rates were matched with each country’s income reference period in EU-SILC. A change in income refers to a relative (per cent) change in 25th percentile or median income of the total population or a given age group between 2018 and baseline year.
Results
Changes in age groups’ median income
A reasonable starting point for analysing the magnitude and direction of changes in age-specific AROP rates is to inspect whether there are differences in the average changes in disposable income between age groups. One could expect that there would be a positive association between changes in income and changes in the standard of living (eg. poverty). Figure 1 illustrates the average change in per cent in each age groups’ median equivalent disposable income. Absolute values for changes were used since the interest was in the size of changes. The estimates are averages of the three periods analysed in this study (2017–2018, 2015–2018, 2013–2018). Incomes were adjusted for inflation.

Figure 1. Average change in age groups’ median income during three time periods (2017–2018, 2015–2018, 2013–2018), %. Source: EU-SILC.
The general pattern is that the average changes in income were typically smaller among older individuals. Typically, the difference between the older population and the two other age groups was significant. Only in Switzerland and Italy, changes in income were notably higher among older people than among children or the working-age population. If there were notable differences between children and the working-age population, children were the group with the largest increases in income. Additionally, there was a number of countries where all three age groups experienced rather similar income development.
Level and changes in poverty rates among age groups
Next, the poverty rates and trends are analysed. The first set of columns in Table 1 illustrates the AROP rates for all three age groups in 2018. There are significant age differences in these rates in European countries, but no uniform pattern can be detected. The working-age population had the highest AROP rate only in three countries.Footnote 5 Children had the highest AROP rates in approximately same number of countries as the old-age population. The highest AROP rates were the old-age AROP rates in Estonia, Latvia and Lithuania (38–46 per cent).
Table 1. Age groups’ at-risk-of-poverty (AROP) rates and changes in at-risk-of-poverty rates during three time periods in European countries, percentage points.
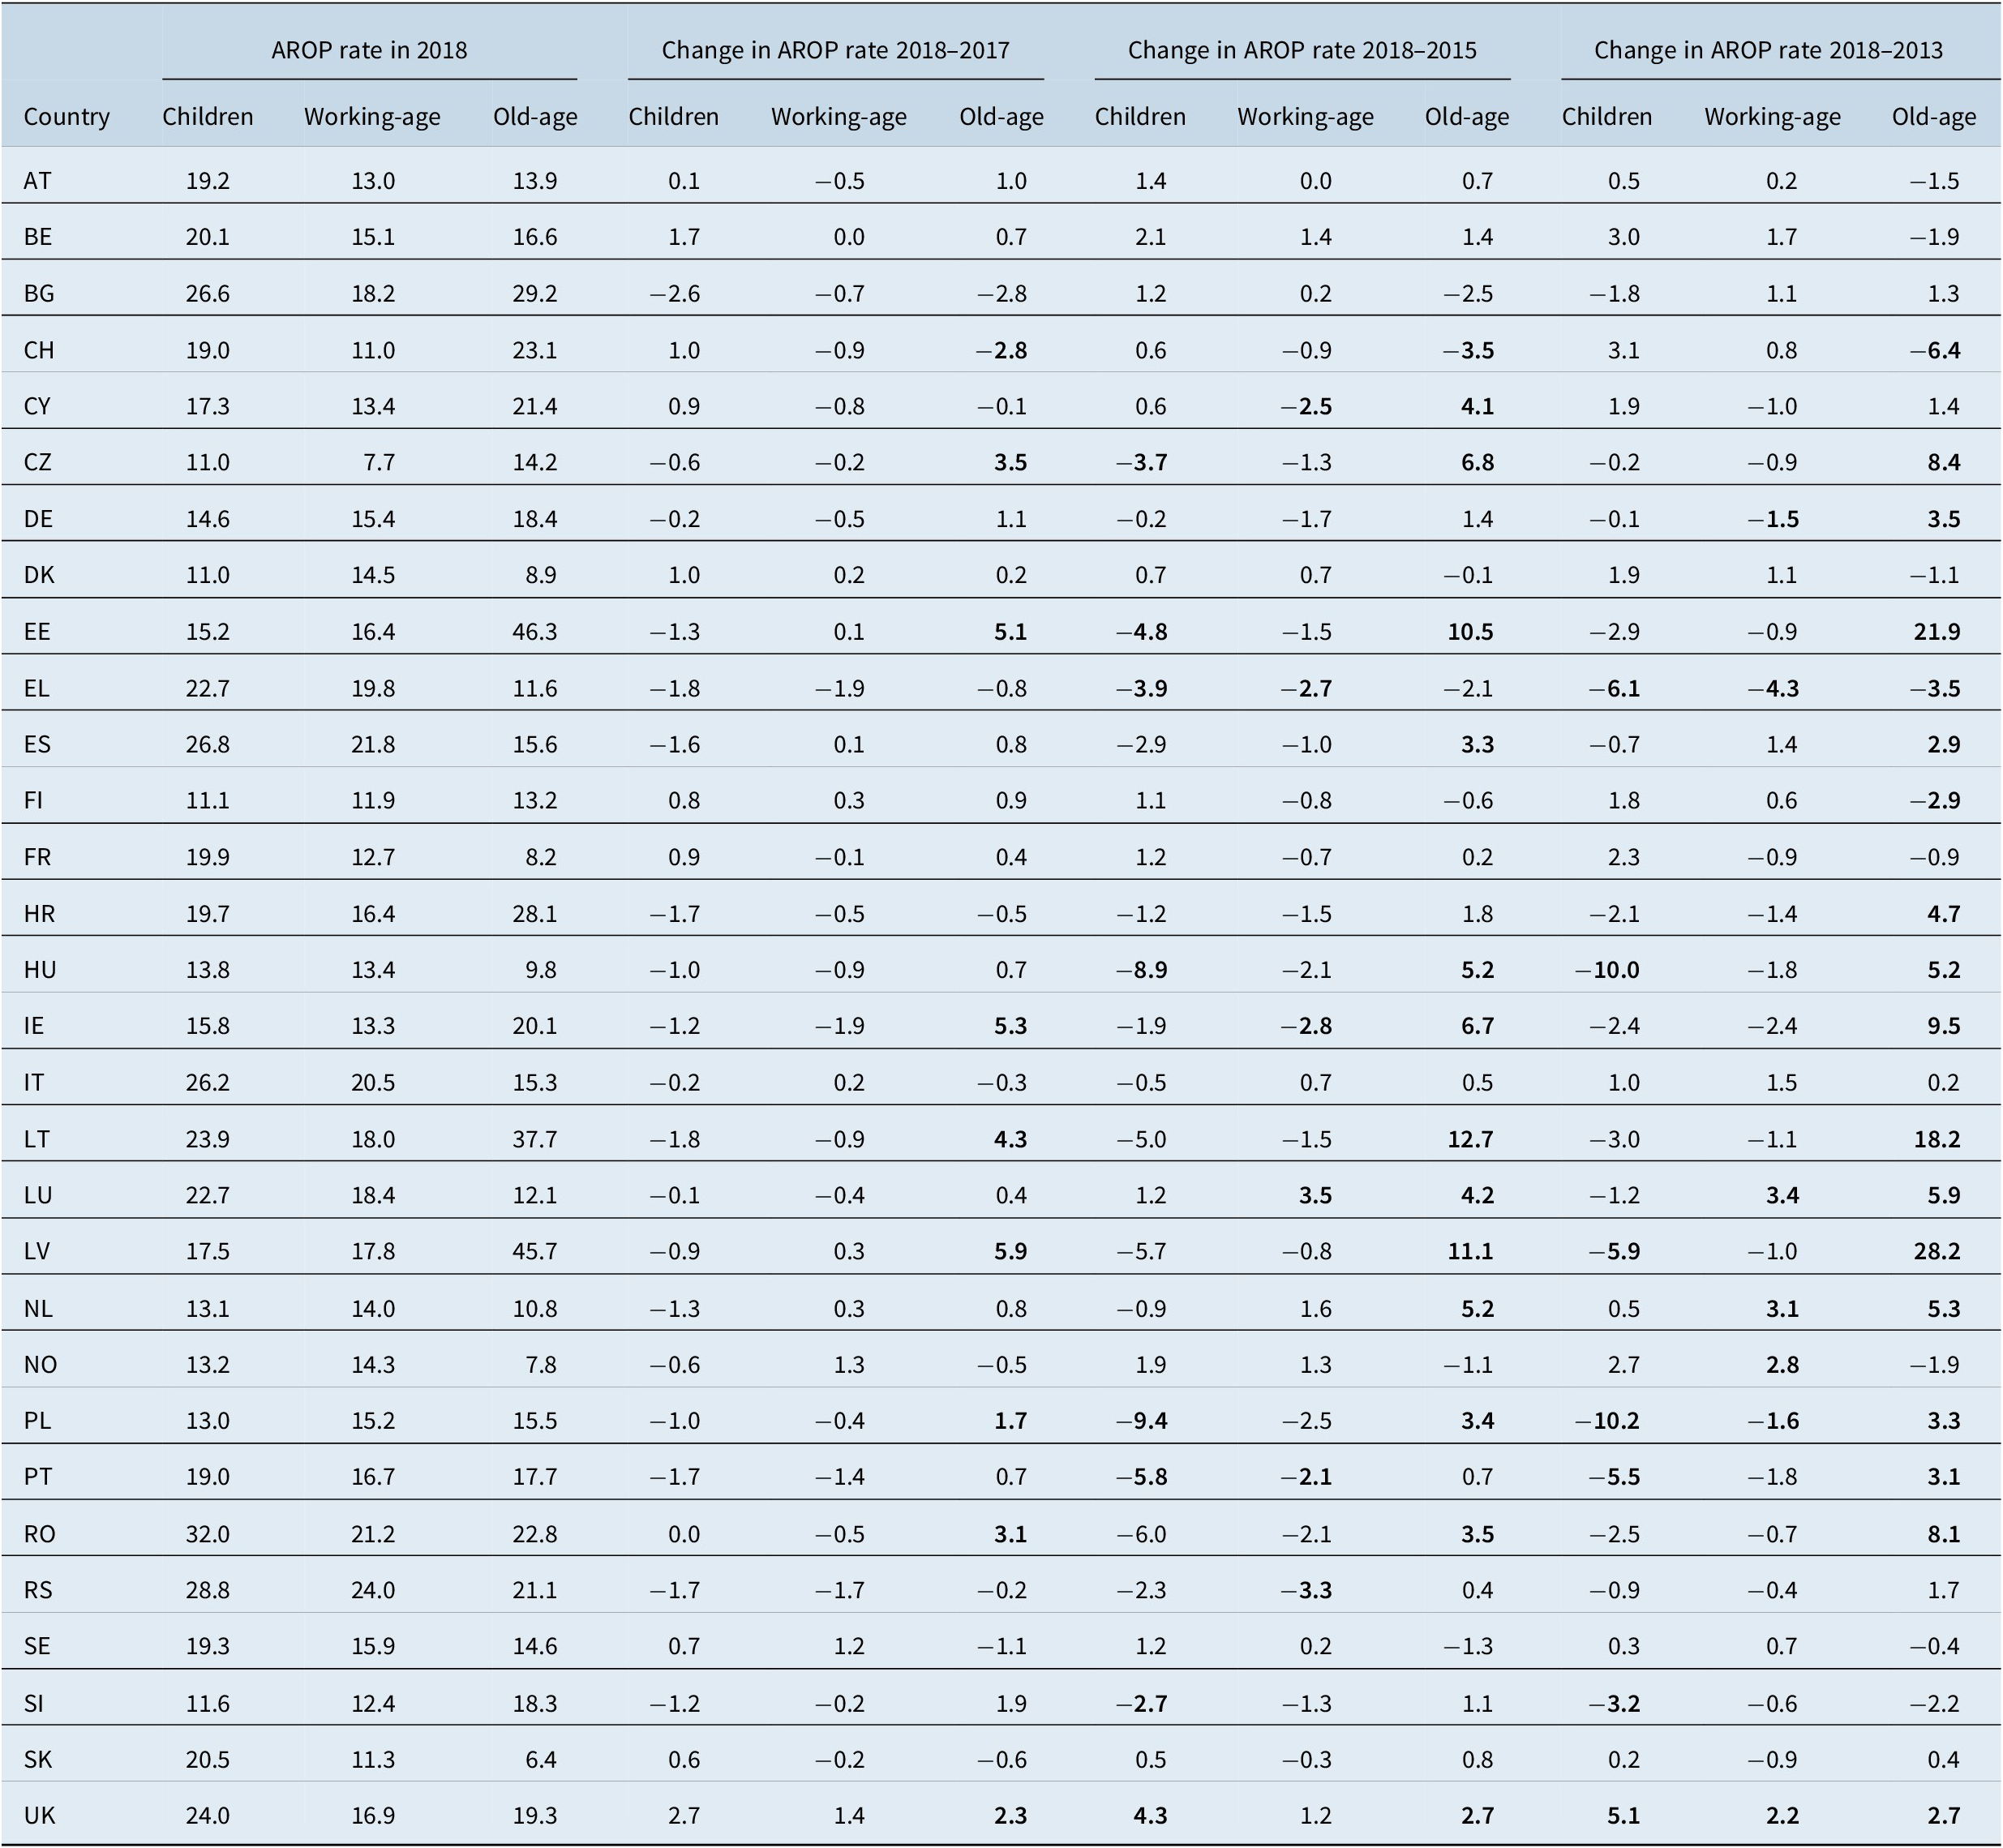
Note: The poverty threshold was set at 60% of national median disposable equivalent income. Bolded changes were statistically significant at the level of p < 0.05.
Source: EU-SILC.
Table 1 also illustrates the changes in AROP rates and their statistical significance (p < 0.05) for the periods 2017–2018, 2015–2018 and 2013–2018. The largest changes in AROP rates were clearly related to old-age poverty. This is somewhat paradoxical considering that average changes in income were typically smaller among older individuals (Figure 1). Between 2013 and 2018, the increase in old-age AROP rates was 18–28 percentage points in the Baltic countries. In the Czech Republic, Ireland and Romania, the increase was around 8–9 percentage points. With respect to child poverty, large changes were observed in Hungary and Poland where the AROP rate decreased by 10 percentage points.
The older population stands out also when the statistical significance of the changes is analysed. Between 2017 and 2018, statistically significant changes were only seen for old-age AROP rates (nine countries). In the periods 2015–2018 and 2013–2018, statistically significant changes were found for all age groups. However, there were again notably more statistically significant changes in old-age AROP rates. Between 2015 and 2018, there were 14 statistically significant changes regarding old-age poverty, 8 regarding child poverty and 6 regarding the working-age population. Between 2013 and 2018, there were 18 statistically significant changes regarding the older population and 7 regarding both children and working-age individuals.
Table 2 focusses on the magnitude of changes in poverty rates. Given that the interest here was solely with the size of changes and not with their direction, the analysis used absolute values. The first row illustrates the mean change in the AROP rate. In all three time periods, the old-age AROP rate showed, on average, greater changes than either the child or working-age poverty rates. The second largest changes were recorded for child AROP rates. Old-age AROP rates changed by an average of 1.7 percentage points between 2017 and 2018; by 3.3 percentage points between 2015 and 2018; and by 5.3 percentage points between 2013 and 2018. In other words, the longer the period, the greater the changes in old-age AROP rates. However, no increase was seen between the 3- and 5-year periods for either children or the working-age population. When the AROP rates were analysed in relative terms (per cent), changes in old-age poverty were again larger than changes in child or working-age poverty, which means that the pattern is not explained by the level of rates.
Table 2. Summary statistics of changes in poverty rates in 2017–2018, 2015–2018 and 2013–2018.

Note: The figures are based on analyses using absolute values of changes in poverty rates.
Source: EU-SILC.
Since the mean can be affected by outliers, it is useful to use other measures as well. The coefficient of variation – a measure of dispersion that takes into account the level – also indicates that there is indeed more variation in the changes in old-age AROP rates than in the child or working-age AROP rates. Yet, when the median of the change in rates was examined, the changes in old-age poverty were still higher but the differences between the groups became smaller. Additionally, the median of relative changes was the highest among older individuals in all three time periods. Though, the median of changes in the AROP rate was approximately at the same level among children and in the older population during the 2017–2018 period. All in all, it seems that the very large changes observed in the AROP rates for some countries (especially the Baltic countries) does affect the overall picture, but the consideration of outliers does not seem to remove the pattern of the older population being more prone to larger changes in AROP rates.
The use of a floating 50 per cent threshold gives information on the role of poverty thresholds. The threshold had some effect on the picture. The main results were that (1) the median change was the highest among children in 2017–2018 and 2015–2018, while in the 2013–2018 period the change for children was similar to that in the older population; (2) there was substantial variation as a result of some countries experiencing very large changes in old-age poverty rates; and (3) the median of relative change was the largest in the older population in the period 2013–2018, while the changes were at roughly the same level for children and the older population in the other two periods. These findings imply that the greater magnitude of the changes in old-age AROP rates is related to the level of the threshold. This is in line with older individuals more often having an income that is around 50–60 or 60–70 per cent of the national equivalised median income (Figure A1).
Previous analyses have focused on the magnitude of changes in AROP rates. Next, it is analysed whether patterns can be detected in the direction of changes in age-specific AROP rates. Figure 2 illustrates the contribution of changes in age groups’ AROP rates to the total population AROP rate for the two longest time-periods: 2015–2018 and 2013–2018. The estimates are based on a shift-share decomposition analysis and are presented in the appendix (Tables A1 and A2), including estimates for the contribution of the changes in population shares.

Figure 2. Contribution of changes in age groups’ at-risk-of-poverty rates to the total population at-risk-of-poverty rate in 2015–2018 and 2013–2018. Source: EU-SILC.
The most typical pattern is that an increase in working-age AROP rates is associated with a decrease in old-age AROP rates, and vice versa. Between 2015 and 2018, the directions of changes in working-age and old-age poverty were the same in only 5 countries out of 30. Additionally, there were two countries where the changes in old-age poverty did not affect the total population poverty rate. Between 2013 and 2018, the direction of changes in AROP rates was similar in 7 countries. Consequently, in both periods old-age and working-age AROP rates developed in opposite directions in over two-thirds of the countries. The opposite direction of these changes means that the magnitude of a change in the total population AROP rate is reduced. Changes in child AROP rates did not have a similar relationship compared to the development of AROP rates in other age groups.
The next analysis sheds more light on how the choice of threshold affects the direction of changes in poverty rates. Table 3 illustrates the pairwise correlations between changes in poverty rates based on fixed and floating poverty thresholds in each of the three age groups. The changes in poverty rates calculated using floating and fixed thresholds were positively and statistically significantly associated both among children and in the working-age population. This implies that the two measures give a rather uniform view about poverty trends. The correlation coefficients were highest when analysing the changes between 2015 and 2018: 0.87 for children and 0.74 for the working-age population. In the older population, the changes in poverty rates were either not associated or negatively associated. The correlation coefficient was −0.36 for changes between 2013 and 2018, indicating that the picture emerging of trends in old-age poverty (decrease or increase) can be rather different depending on the measure applied. The general conclusions were similar if the floating poverty threshold was set at 50 per cent of median rather than 60 per cent (Table A3). These findings highlight the importance of the choice of a poverty threshold when analysing changes in the risk of old-age poverty.
Table 3. Pairwise correlations between changes in poverty rates using floating and fixed poverty thresholds.

Source: EU-SILC.
*** p < 0.001.
** p < 0.01.
* p < 0.05.
Association between changes in employment and income and poverty rates
Lastly, it is examined how changes in the employment rate and income are associated with changes in poverty rates (Table 4). This analysis gives information on whether changes in AROP rates correspond with changes in economic trends and the standard of living. Both the floating AROP threshold and the fixed poverty threshold were used. Changes in income (median and 25th percentile) were calculated for both the total population and each age group. The findings were similar when the floating poverty threshold was set at 50 per cent of median (Table A4).
Table 4. Pairwise correlations between changes in employment and income and changes in poverty rates (floating at-risk-of-poverty (AROP) threshold and fixed threshold).
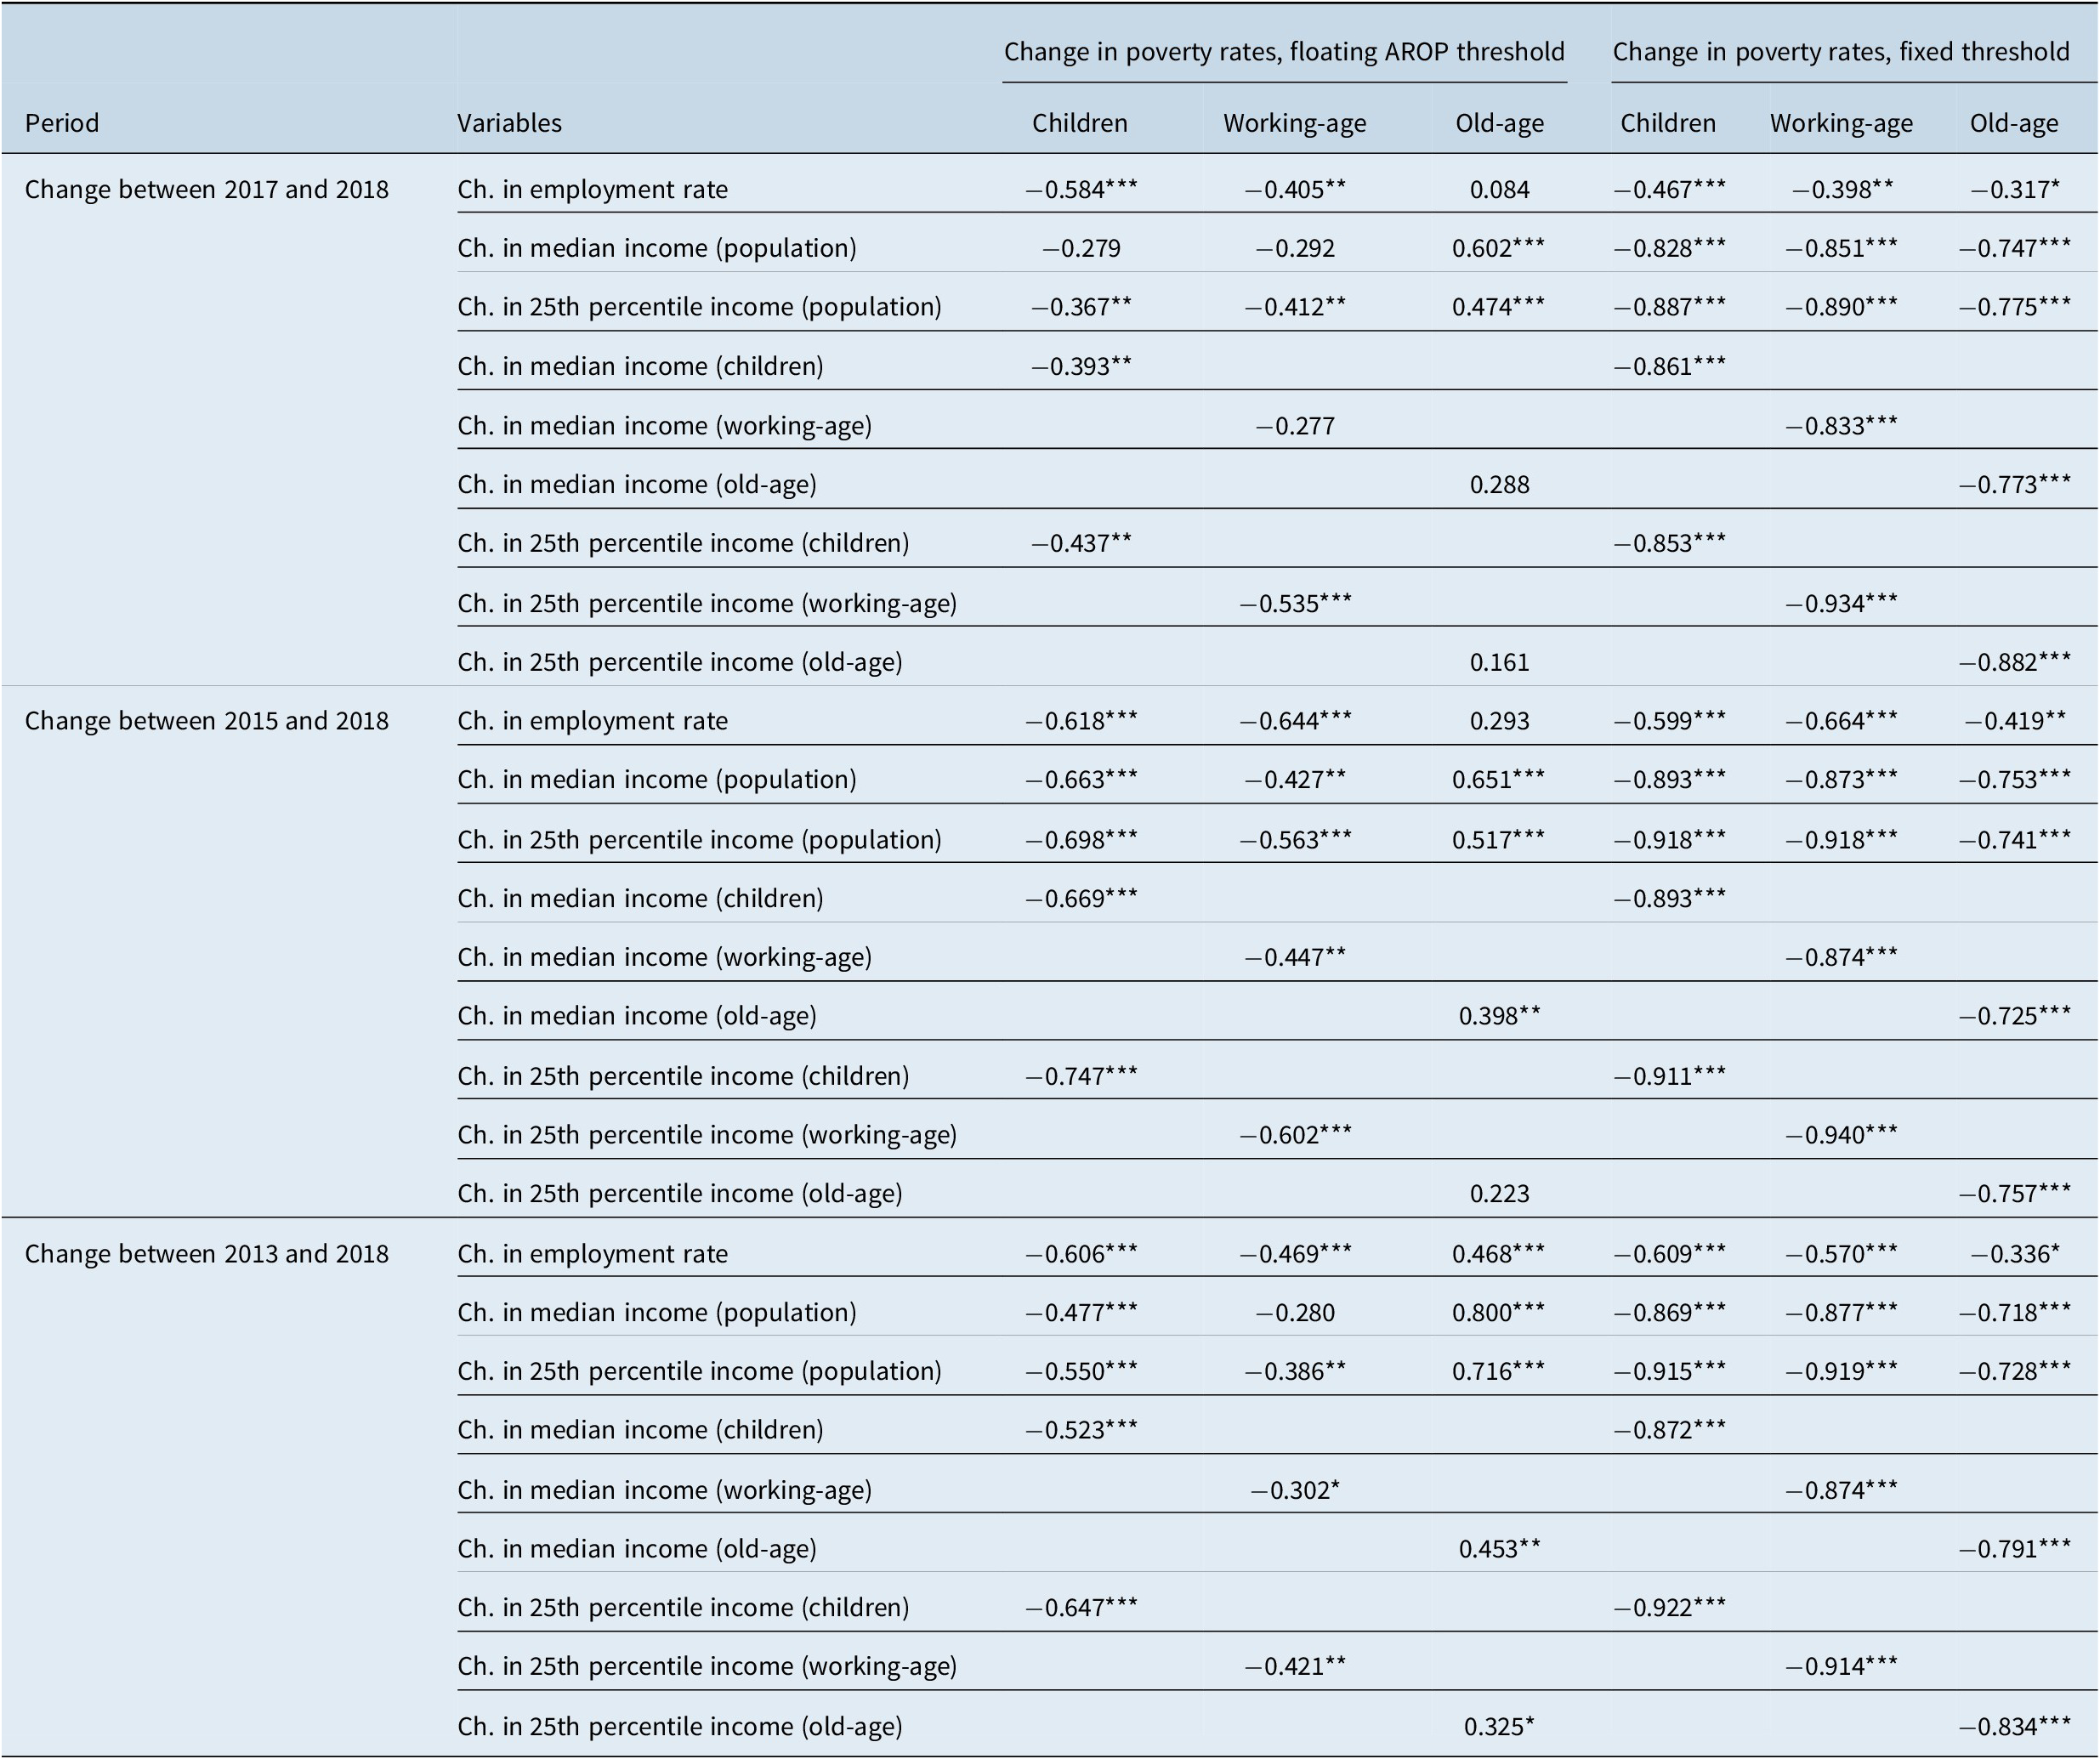
Source: EU-SILC.
*** p < 0.001.
** p < 0.01.
* p < 0.05.
Changes in the total population’s income (either median or 25th percentile income) were negatively associated with changes in child or working-age AROP rates. Though, the associations between changes in median income and changes in AROP rates for the working-age population in 2017–2018 and 2013–2018 and for children in 2017–2018 were not statistically significant. On the other hand, increases in income in the middle or bottom of the total population’s income distribution tend to be associated with increases in the AROP rate in the older population. This can be explained by an increase in median income making it more difficult particularly for older individuals to avoid poverty. Similarly, an increase in the employment rate was negatively associated with AROP rates among children and in the working-age population, while in the older population there was no association or a positive association (2013–2018 period).
When incomes increase among children or in the working-age population, there is a tendency for these groups’ AROP rate to decrease. However, unexpected positive associations were found between income development and the AROP rate in the older population. The associations between changes in older individuals’ median income and changes in their AROP rate were statistically significant for the periods 2015–2018 and 2013–2018, while the association between changes in older individuals’ 25th percentile income and changes in their AROP rate was statistically significant in the period 2013–2018. As for the older population, the associations were stronger between changes in median income and changes in the AROP rate than between changes in the 25th percentile income and changes in the AROP rate. Among children and in the working-age population, the associations between changes in the 25th percentile income and changes in the AROP rate were stronger.
Fixed poverty thresholds yielded a much more uniform picture of the associations between employment or income development and changes in poverty rates. Furthermore, all associations were statistically significant and stronger than when using a floating AROP threshold. The main finding was that all associations were negative: increases in the employment rate or income (either in the total population or a specific age group) tend to be associated with decreases in poverty rates. Additionally, changes in the age group’s 25th percentile income showed a stronger association with changes in the poverty rate than other income variables in all age groups.
Conclusions
The poverty threshold is commonly set at 60 per cent of national median disposable equivalent income. It can be expected that linking the threshold with changes in average income affects poverty rates for some population subgroups more than for others. This study analysed how the magnitude and direction of changes in poverty rates vary between age groups in European countries and how these changes are shaped by changes in poverty thresholds, income and employment. This study was exploratory with an aim to seek for general tendencies regarding changes in poverty rates among age groups. The analyses were conducted using EU-SILC survey data describing the development of poverty rates around the mid-2010s.
The results showed that on average, older individuals experienced greater changes in AROP rates than children or working-age individuals. This pattern was not fully explained by the level of poverty or outliers. In addition, changes in AROP rates were more often statistically significant in older individuals. The finding of greater changes of old-age AROP rates is somewhat paradoxical considering the result that the older population experienced on average smaller changes in income. Also, it was found that changes in old-age AROP rates typically move in the opposite direction to changes in working-age poverty.
While changes in poverty rates show a positive relationship among children and in the working-age population when calculated using fixed and floating thresholds, this does not hold for the older population. Furthermore, increases in the employment rate and income tend to be associated with decreases in child and working-age poverty. However, even an opposite pattern can be found for the older population. When a fixed poverty threshold was used, a negative association was found in all age groups between employment and income changes and changes in poverty rates. In other words, unless a fixed poverty threshold is used, the positive income (or employment) development does not necessarily correspond with the development of old-age poverty rates. An important contributing factor for the trends of old-age poverty is that older individuals have income more often just below or above the poverty threshold than other age groups.
There seem to be clear cross-national tendencies with respect to changes in age-specific AROP rates. Also, the opposite direction of changes in old-age and working-age AROP rates has the effect of suppressing the changes in total population AROP rates. Population ageing means that over time, the impact of the older population on the total population AROP rate is set to increase. The distinctive nature of changes in old-age poverty rates should be considered when AROP rates are used for policy evaluation. For instance, it has been argued that the AROP measure itself partially explains why European poverty rates did not decline during the 2000s (Jenkins, Reference Jenkins2020). Measures with a more absolute character showed a stronger association with national economic performance and greater cross-national heterogeneity (Jenkins, Reference Jenkins2020). The findings are in line with previous research which indicates that “poverty line effects” can be substantial even over relatively short periods of time (Goedemé, Collado, & Meeusen, Reference Goedemé, Collado and Meeusen2014).
This study has some limitations. The period under investigation was marked by economic growth. Especially when median income suddenly decreases due to economic downturns, AROP rates can develop unexpectedly across all age groups. It is likely that there are individual countries where the poverty trends seen during the time periods under study overlap with important policy changes. It is unlikely, however, that the general patterns found in this study can be fully explained by similar policies being adopted across Europe at the same time. Due to the exploratory nature of the study, only the general patterns of poverty trends were inspected. Nonetheless, future research should seek to consider the “poverty line effects” of various policies.
The results of this study have implications for future research. Since many older individuals’ have incomes close to the poverty threshold, it makes sense to consider the use of several floating thresholds – although this study showed that measures using a 50 or 60 per cent of median threshold have similar associations with economic trends. Additionally, fixed poverty thresholds should be used alongside floating ones. This would be useful particularly for gaining a more precise picture on changes in the economic situation of the older population. Yet, it is important to note that floating thresholds take into account the social and economic situation in the society in which individuals live and as such are essentially a relatively poverty measure. However, the threshold does not necessarily reflect what is considered a generally acceptable living standard (Goedemé & Rottiers, Reference Goedemé and Rottiers2011). Thus, there is a need for monetary poverty measures that are more closely aligned with definitions of poverty and that are more likely to follow countries’ economic performance, such as measures based on reference budgets (see Penne et al., Reference Penne, Parcerisas, Mäkinen, Storms and Goedemé2016).
Disclosure statement
The author declares that there is no conflict of interest.
Funding
This research was funded by the Academy of Finland Flagship Programme (decision number: 320162).
Notes on contributors
Ilari Ilmakunnas obtained a PhD from the University of Turku in 2019. Currently he is working as a senior researcher at the Finnish Centre for Pensions and is also a visiting researcher at the INVEST Research Flagship Center, University of Turku. His research focuses on poverty and its measurement, economic disadvantage, social assistance recipiency and social security.
Appendix

Figure A1. Share of individuals with equivalised disposable income 50–60 per cent and 60–70 per cent of the median of national equivalent disposable income in three age groups, 2018, %. Source: EU-SILC.
Table A1. Contribution of changes in population shares and at-risk-of-poverty (AROP) rates of three age groups to change in the total population poverty rate in 2018–2015, shift-share decomposition analysis, percentage points.

Source: EU-SILC.
Table A2. Contribution of changes in population shares and at-risk-of-poverty (AROP) rates of three age groups to change in the total population poverty rate in 2018–2013, shift-share decomposition analysis, percentage points.

Source: EU-SILC.
Table A3. Pairwise correlations between changes in poverty rates using floating (50% of median income) and fixed poverty thresholds.

Source: EU-SILC.
Table A4. Pairwise correlations between changes in employment and income and changes in poverty rates (floating 50% of median income threshold).

Source: EU-SILC.


