


Introduction
Poverty is a multidimensional and multi-causal problem that integrates several interconnected parameters and aspects of an individual’s life. Poverty is not only the lack of resources to satisfy necessities but also the effect that this lack has on the economic, social, and political spheres, which creates vulnerability and perpetuates the intergenerational transmission of poverty.
To help households break the vicious cycle of the transmission of poverty, countries have adopted Conditional Cash Transfer programs (CCTs) to foster investments in human capital and the development of capabilities for people in poverty. The CCTs provide monetary transfers to households that meet conditions of poverty or vulnerability, such as falling below an income limit or living within a specific geographic region (Martínez & Ramirez, Reference Martínez and Ramirez2015).
Although these programmes have provided minimal entitlements, they have covered people who may never have received any benefits from state policies (Martínez Franzoni & Sánchez-Ancochea, Reference Martínez Franzoni and Sánchez-Ancochea2014). Other relevant common traits in these programmes are (a) focused on certain regions in poverty; (b) conditions or requirements to receive the transfer; (c) sanctions for not meeting the conditions, (d) the amount received, which varies by family size (and the limits to how much a household can receive); and (e) person who receives the payment (usually women) (Lavinas, Reference Lavinas2013).
CCTs have a two-fold objective. In the short-term, they are focused on the immediate poverty reduction by injecting cash into low-income households. The purpose is to increase expenditure capacity (Gertler & Fernald, Reference Gertler and Fernald2005) because of the lack of income predisposes individuals to a poor life (Sen, Reference Sen2000). The cash transfer provides households the option to choose which goods to buy, and in the short term, this can be a solution to satisfy their most urgent needs and tackle the day-to-day problems derived from extreme poverty. In the long term, the objective of the programme is to break down the intergenerational transmission of poverty by increasing the human capital of the recipient children. The cash transfer is used as an incentive to accomplish with the co-responsibilities in health and (Parker & McGinnis, Reference Parker and McGinnis2007).
The CCTs have had different effects on decreasing poverty and inequality in different countries. In Argentina, Brazil, and Uruguay, they have had a strong impact; while in Bolivia, Mexico, and Peru, results have been modest (Lustig, Pessino, & Scott, Reference Lustig, Pessino and Scott2014; Levy & Schady, Reference Levy and Schady2013). In Chile, poverty, before and after the transfers, showed statistically significant reductions at the county level (Agostini, Brown, & Góngora, Reference Agostini, Brown and Góngora2010). Likewise, outcomes in food insecurity have been observed, such as in South Africa, where the transfer has significantly improved family income in the very poor and has created a minimum of social protection (Patel, Reference Patel2012).
Apparently, these different outcomes occur because resources can change household income levels in absolute terms and improve expenditure on essential needs, such as food and education (Escobar & González de la Rocha, Reference Escobar and González de la Rocha2004). Fernald, Gertler, and Neufeld (Reference Fernald, Gertler and Neufeld2008) argue that CCTs allow families to purchase more or higher-quality food or medicines or to invest the money in household materials or equipment to improve the lives of their members.
The Mexican CCT program, termed Inclusión Social PROSPERA (formerly Oportunidades Footnote 1), began in 1997 with the name Progresa in rural Mexico and was one of the first and largest CCT programs of its kind. The programme aims to reduce income fluctuations and allow families to plan their expenditures. It is also designed to improve health, nutrition, and education of children living within the household (Escobar & González de la Rocha, Reference Escobar and González de la Rocha2004).
The Oportunidades-PROSPERA Program (OpPr) has three components: education, health, and food. The education component includes three instruments: scholarships for elementary, secondary and high school education; help with school supplies, which for elementary school is divided into two allotments, and for middle and high school are provided once a year; and a support programme called Jóvenes con Oportunidades (Young with Opportunities), when beneficiaries at the high-school level complete their studies successfully (SEDESOL, 2010).
The health component covers three instruments: doctor visits; prevention of and attention to malnutrition in children and pregnant women; and community training workshops on personal healthcare. Finally, the food component includes four instruments: a monthly grant for food; a monthly delivery of food complements, supplements, or both, for children and pregnant and breastfeeding women; a monthly subsidy as compensation for the international price increase on food; and a monthly grant to support energy expenditure (electricity, gas, coal, wood, candles, and others).
The grants and scholarships are supplied in cash every two months to the mothers. There is a fixed maximum amount per component, per family, of USD 106.24 every month for families with beneficiaries in elementary school and USD 170.90 for families with children in secondary school (see the Appendix). This distribution represents 37% and 60% of the families’ average monthly income, respectively. This component includes the scholarships, the food grants, compensation for the international price increase on food, and compensation for energy expenditure. Meanwhile, amounts for school supplies are USD 20.40 and USD 25.40 per beneficiary in elementary and secondary school, respectively; and grants of USD 276.90 and USD 21.17 per beneficiary for young people with Oportunidades and older adults, respectively (SEDESOL, 2009).
The election of a household as a beneficiary of the programme requires different stages. In the first stage, the programme selects the localities, colonies, or blocks that live in extreme poverty and based on criteria such as the poverty gap index (CONEVAL, 2010), the poverty level determined by the Consejo Nacional de Población (National Population Council). In second stagestage, areas are selected from the larger universe that fit in the programme’s three components. In the third stage, in the areas geographic that meet the requirements of the third stage, socioeconomic, demographic, and household information is gathered. In the fourth stage, each household is graded according to a discriminant function, which categorises the households as susceptible to being incorporated into, reincorporated into, continuing in, or leaving the programme (SEDESOL, 2010).
Previous studies concerning the programme’s effectiveness in rural areas show that the transfers can reduce the percentage of poverty by 8.16%, from 0.52 to 0.47; intensity of poverty by 23.61%, from 0.15 to 0.11; and severity of poverty by 34.52%, from 0.05 to 0.03 (Skoufias, Behrman, Gertler, & Schultz, Reference Skoufias, Behrman, Gertler and Schultz2000). However, there are few estimates of the effect on poverty in urban areas, particularly in Nuevo León, Tamaulipas, and Coahuila, considered regions with low levels of income poverty (CONEVAL, 2011) and social deprivationFootnote 2 (CONEVAL, 2016).
The OpPr was initially designed for and implemented in rural areas because the prevalence of extreme poverty was higher in those locations (Levy, Reference Levy2004). Urban areas were incorporated later, but there is still an empirical gap about the effectiveness of the programme in these settings. We hypothesise that in the urban households that receive benefits from the programme there are positive effects on poverty levels but they remain below the poverty line.
To test the hypothesis, we use the poverty-lines methodology, which is found in most literature related to the poverty measurement. The poverty-lines method compares the current income of households and individuals against a specific poverty line. Individuals or families whose income is insufficient to afford a minimum consumption bundle can be identified as poor (Ravallion, Reference Ravallion1998).
For estimations, we use the Foster–Greer–Thorbecke Index, which reveals the proportion of homes in a situation of poverty and introduces a measurement of the intensity and severity of the poverty (Foster, Greer, & Thorbecke, Reference Foster, Greer and Thorbecke1984). This technique will help us to know if the incidence, intensity, and inequality of poverty in households benefitting from the programme in urban zones have been reduced because of the OpPr cash transfers, in comparison to households in the control group.
Literature review
Poverty is defined as a lack of wellbeing that is focused on an individual’s abilities to function in society (Burgos-Davila & Cando-Ortega, Reference Burgos-Davila and Cando-Ortega2016). It can be classified as (a) absolute poverty, which refers to a series of unfulfilled basic needs, usually linked to the concept of livelihood; (b) relative poverty, which is defined by comparison with the standard in a given society, setting thresholds based on some representative measure of the income distribution, or some indicator of living conditions (Siposné Nándori, Reference Siposné Nándori2011; Hernández-Pedreño, Reference Hernández-Pedreñ2010). These definitions have in common people living in poverty struggle with situations where almost all their capabilities are at a disadvantage, in comparison to people not living in poverty (Haughton & Khandker, Reference Haughton and Khandker2009).
People living in poverty take part in a complex network of socioeconomic, environmental, and cultural deficits (Ardiles, Reference Ardiles2008), which public policies and the free market have not been able to solve (Martínez & Ramirez, Reference Martínez and Ramirez2015). Therefore, public policy and interventions must establish a series of criteria beyond income (Martínez Martínez & Ramírez López, Reference Martínez Martínez, Ramírez López, Vargas, Hernández and Bolívar2018) to deal with the issue. One solution has been the CCTs, which cover aspects such as education, health, and food while offering a money transfer as a measure to break the intergenerational poverty cycle (Villatoro, Reference Villatoro2005) by providing the home with economic resources (Gertler & Fernald, Reference Gertler and Fernald2005).
CCTs have been used in several developing countries because they are a quick, efficient, and relatively inexpensive anti-poverty strategy (Hall, Reference Hall2014). There is evidence that CCTs and other public transfers represent, on average, approximately 10.3% of the per capita income of beneficiary households. Also, transfers can double the primary income for those in the first income deciles (Cecchini & Madariaga, Reference Cecchini and Madariaga2011). These facts imply that money transfers are very progressive in absolute terms, except where programmes are not focused on the poor (Lustig et al., Reference Lustig, Pessino and Scott2014).
Cambodia, the Republic of Congo, Portugal, Brazil, and the Ivory Coast, among other countries, have experienced poverty reduction from the cash transfers (Arcanjo, Bastos, Nunes, & Passos, Reference Arcanjo, Bastos, Nunes and Passos2013; Hodges, Notten, O’Brien, & Tiberti, Reference Hodges, Notten, O’Brien and Tiberti2013; Meng & Pfau, Reference Meng and Pfau2012). In Brazil, the Bolsa Familia programme results show that poverty and inequality were reduced (Sánchez-Ancochea & Mattei, Reference Sánchez-Ancochea and Mattei2011). Likewise, in Peru and Guatemala, there was a substantial reduction in the intensity of extreme poverty (Lavinas, Reference Lavinas2013). In Chile, although there were reductions in poverty levels at the country level, these results were concentrated mainly in rural areas. This evidences that efficiency of transfers to move people out of poverty is heterogeneous (Agostini et al., Reference Agostini, Brown and Góngora2010). Similar results have taken place in Bolivia, Mexico, and Peru (Lustig et al., Reference Lustig, Pessino and Scott2014).
Other evidence shows that CCTs have not reduced poverty rates but rather have moved families closer to the poverty line, scarcely helping them to rise above it (Velázquez Leyer, Reference Velázquez Leyer2018). This situation could be explained because, in some Latin American and Caribbean countries, CCTs are not broad enough to cover the poorest people. For example, in Guatemala, Belize, and Haiti, the population in beneficiary households represents less than 30% of people in extreme poverty (Cecchini & Atuesta, Reference Cecchini and Atuesta2017). Therefore, these programmes seem like suitable strategies but insufficient to deal with the problem of poverty (Martínez Franzoni & Sánchez-Ancochea, Reference Martínez Franzoni and Sánchez-Ancochea2014).
The evidence in the Mexican case indicates that PrOp transfer reduces poverty in the short term and increases consumption (Fiszbein, Schady, & Ferreira, Reference Fiszbein, Schady and Ferreira2009). Cortés, Banegas, and Solís (Reference Cortés, Banegas and Solís2007) found that PrOp reduced poverty, but at the national level, the impact was one percent on extreme poverty, whereas the most relevant impact was in the rural areas, between 2.1% and 2.9%.
Similarly, Skoufias, Davis, and Behrman (Reference Skoufias, Davis and Behrman1999) found that in rural areas, the programme reduced poverty intensity by 42%, and poverty severity by 58%, with the greatest impact on the poorest households. Another study in a rural area of Southeast Mexico found that a lack of cash transfers would follow to a 65.5% increase in poverty and that the percentage of households below the poverty line would increase to 91.5% (Espinosa Trujillo, Reyes de la Cruz, Torres Sombra, & Pérez Vera, Reference Espinosa Trujillo, Reyes de la Cruz, Torres Sombra and Pérez Vera2015).
Besides, it has been demonstrated that in urban areas the transfers do not have a significant effect in all the states and some states, the impact is minimal (Manzanares Rivera, Reference Manzanares Rivera2013). Martínez and Ramirez (Reference Martínez and Ramirez2015) report the same result for urban zones, particularly in one-parent households, and found the most significant effect on extreme poverty, as it does the study by Bracamontes and Huesca (Reference Bracamontes, Huesca, Huesca, Camberos and Calderón2011), regarding the limited effects on poverty reduction.
A key point concerning the effects of the transfers lies in the household characteristics. For instance, sociodemographic aspects of households have a significant impact on poverty (Campos-Vázquez, Chiapa, Huffman, & Alma, Reference Campos-Vázquez, Chiapa, Huffman and Alma2013). The householder type is also particularly significant because when a woman heads a beneficiary household, poverty is not reduced proportionately, in comparison to households headed by the man (Martínez & Ramirez, Reference Martínez and Ramirez2015).
Materials and methods
Data
Results are based on a cross-sectional study carried out in urban areas, in the states of Nuevo León, Tamaulipas, and Coahuila. A two-stage, random-sampling method was used to select the neighbourhood in each state to apply the survey, taking as the sampling frame all the neighbourhoods where the OpPr was implemented. Sixteen neighbourhoods were selected in the municipalities of Monterrey, Apodaca, General Escobedo, Guadalupe, Juárez, and San Nicolás de los Garza (at Nuevo León); five in Tamaulipas, in the towns of Tampico and Madero; and five in Coahuila, in the municipalities of Saltillo and Torreón.
The sample size was calculated based on the universe of beneficiary households for urban zones in each state. In total, interviews were conducted in 1,430 households; from these, 1,130 homes were beneficiaries of the programme. Concerning the distribution in states, 412 interviews were conducted in Nuevo León, 368 in Tamaulipas, and 350 in Coahuila. A randomised method was used to select the households, based on the list of beneficiaries in each neighbourhood.
Due to the available resources, the control group was selected through convenience sampling. The survey was applied to 300 households, 100 for each state, in the same chosen neighbourhoods for the intervention group. Despite this limitation, the intervention and control groups were similar in socio-demographic terms. Also, there was a low level of bias in the sample, as it is shown in the characteristics of both groups (see the next section).
Statistics of households surveyed
In this section, we present the results of household characteristics. In all cases, the first percentage refers to the intervention group and the second one indicates results in the control group.
Concerning the householder, there were no significant differences between the intervention and the control group (P > 0.05) because the father represents the highest percentage (79.5% y 78.3%) in both sets; 18.4% and 18.3% are single-mother households; 1.8% and 2.1% have grandfather heads of households; and in 0.3% and 1.3%, someone else is the householder, such as aunts or uncles, brothers or sisters-in-law, or another resident.
Concerning personal traits, the average age of the householder was 38.50 and 39.20 years, which was not significant (p > 0.05). Contrary, there was a significant difference in their levels of education (p < 0.01), which can be explained by the fact that 30% of the heads of household in the intervention group reported having no basic education.
No significant differences were found in the employment of the householder (p > 0.05). In both groups, most are construction workers (34.1% and 32.3%); 30.7% and 28.3% work in services, primarily as store or small local business employees; 12.1% and 14.3% work in industry; 9.5% and 13% sell street food; and 10.5% and 9.7% were unemployed. The rest (3.1 and 2.4 percent) were retired or were women (especially grandmothers) who reported housework as their main activity.
Concerning the mothers’ activities, there were no significant differences between them. Although most of them were housewives (80.4% and 78.3%), both groups reported similar percentages (15.1% and 15.4%) of women working outside the home; 1.5 and 3.1% were unemployed; 3% and 3.2% sold products (perfumes and home appliances), washed clothes, or cleaned homes.
In the group of beneficiaries, the average number of children was 2.39, 51% boys and 49% girls; in the control group, the average number was 1.97 children per household, 48.9% boys and 51.1% girls. There was no significant difference in the number and sex of the children by house (p > 0.05). The average age of the children was 10.27 and 9.77, which shows that both groups have school-age children.
Finally, the average monthly income for intervention household is USD 277.86 and, for non-recipient households USD 294.83 (p > 0.05). The average cash transfer was USD 41.67. When adding the transfer to the income of recipient homes, income increased to USD 319.53, which was significant (p < 0.05) compared to the control group.
Measuring the incidence, intensity, and inequality of poverty
Estimates were based on the Foster et al. (Reference Foster, Greer and Thorbecke1984), which introduces a weighting α as a factor for evaluating the poverty level. If the parameter α = 0, the index FGT 0 represents the proportion of households in a situation of poverty in the total population (incidence); if α = 1, the index FGT 1 represents the average intensity of poverty in terms of the average distance of households from the defined poverty line. Finally, if the parameter α = 2, the index FGT 2 shows inequality between poor households. The calculation was done with the following model:
 $$FGT_\alpha \lpar {y\semicolon \; {\cal L}} \rpar = \displaystyle{1 \over N}\mathop \sum \limits_{i = 1}^j \left({\displaystyle{{{\cal L}-y_i} \over {\cal L}}} \right)^\alpha$$
where:
N indicates the cardinality of the sample
 ${\cal L} \gt 0$
is a predefined poverty line
${\cal L} \gt 0$
is a predefined poverty linej are the elements of the sample that are below
${\cal L}$
-
$y = \lpar {y_1\comma \; \ldots \comma \; \; y_N} \rpar$
is a vector of monthly income by household (with or without transfers), where
$y_1 \ge y_2 \ge \ldots \ge y_N$
-
${\cal L}-y_i$
is the household’s monthly income gap i,
$\forall \; i\; \in \lcub {1\comma \; \ldots \comma \; N} \rcub$
-
$\alpha \in \lcub {0\comma \; 1\comma \; 2\comma \; \ldots } \rcub$
is the poverty aversion coefficient. The higher the coefficient is the greater the weighting given to the poorest. If α = 0, the weighting is the same for everyone.


Therefore, it can be determined that:
-
$FGT_0\lpar {y\semicolon \; {\cal L}} \rpar$
measures the incidence of poverty; in other words, the proportion of households in which income is below the poverty line
${\cal L}$
.
-
$FGT_1\lpar {y\semicolon \; {\cal L}} \rpar$
Z measures the intensity of poverty; in other words, the average gap of household incomes and the poverty line to which they belong.
-
$FGT_2\lpar {y\semicolon \; {\cal L}} \rpar$
Z measures the inequality of income between poor households.


CONEVAL (2010) defined the poverty lines used in the study for urban zones, as Follows:
(1). Food poverty: Inability to obtain a basic food basket, even if using all the household’s available income. It costs USD 307.70Footnote 3 per month.
(2). Capability poverty: Insufficient available income for necessary expenditure on health and education, even when considering the entire household income. It costs USD 377.40 per month.
(3). Patrimonial poverty: Insufficient available income to meet needs for clothing, housing, and transport, even when the household’s entire income is spent on these items. It costs USD 617.30 per month.
The Ministry of Social Development (SEDESOL, 2002) methodology was used to estimate the household’s entire income; this variable is constructed with the household’s entire current income, both cash (including transfers from the programme) and non-cash, and subtraction of the handouts provided during a specific period. To observe the effect of OpPr cash transfers on the three poverty estimators other variables were created, applying the same methodology but excluding its amount on the beneficiary households.
Three variables of the total household income were produced. The first variable was created for the control group (C), the second one for the intervention group where the transfer was included (I&T), and the third one also for the intervention group (I) but without including transfers as part of the total amount. The statistical analysis and calculations reported in the study were made using STATA (v.12).
Results
The effects of the OpPr cash transfers are listed below.
Food poverty
Table 1 includes the estimates for incidence (FGT 0), intensity (FGT 1), and inequality (FGT 2) of food poverty. It distinguish between the intervention groups (I), intervention with the cash transfers of the OpPr program (I&T), and the control group (C), as well as the respective confidence intervals; Table 2 shows the absolute and relative differences of the estimators.
Table 1. Food poverty: Incidence, intensity and inequality.

Source: Authors, based on the estimation results.
Table 2. Food Poverty: Absolute and relative differences.

Source: Authors, based on the estimation results.
Results show no statistically significant evidence at the 95% confidence interval that the incidence of food poverty in the non-transfer intervention group (0.6830) is different from the control group (0.06367), because the confidence intervals overlap. Contrary, there is statistically significant evidence that the incidence of food poverty in the intervention group which receives transfers (0.5083) is lower than the non-transfer intervention group (0.6830) and the control group (0.6367), 0.1747 and 0.1284 percentage points, respectively. It means, on average, there are fewer households in food poverty with the programme transfers than without them.
Results also show no statistically relevant evidence at the 95% confidence interval because the intensity of food poverty in the non-transfer intervention group (0.2494) is different from the control group (0.2558). The main reason is the overlapping confidence intervals. Meanwhile, there is statistically significant evidence that the intensity food poverty in the intervention group that receives transfers (0.1723) is lesser than in the non-transfer intervention group (0.2492) and the control group (0.2558); 0.0771 and 0.0835 percentage points, respectively. Therefore, on average, households with transfers show a smaller income gap in food poverty and the poverty line than households without them.
Finally, results show no statistically significant evidence at the 95% confidence interval: estimator of income inequality in those with food poverty from the non-transfer intervention group (0.1501) is different regarding the control group (0.1674) because the confidence intervals overlap. Contrary, there is statistically significant evidence that the income inequality estimator of those with food poverty from the intervention groups who receive transfers (0.0955) is lesser than the non-transfer intervention group (0.1501) and control group (0.1674); 0.0546 and 0.0719 percentage points, respectively. Thus, on average, with transfers from the programme, income inequality is lower among people in food poverty who receive transfers than those who do not.
Capability poverty
Results of the three estimators are displayed in the following tables. The first one shows the values of the FGT α Index and the second one shows the absolute and relative difference in each of the estimators (Tables 3 and 4).
Table 3. Capability poverty: Incidence, intensity and inequality.
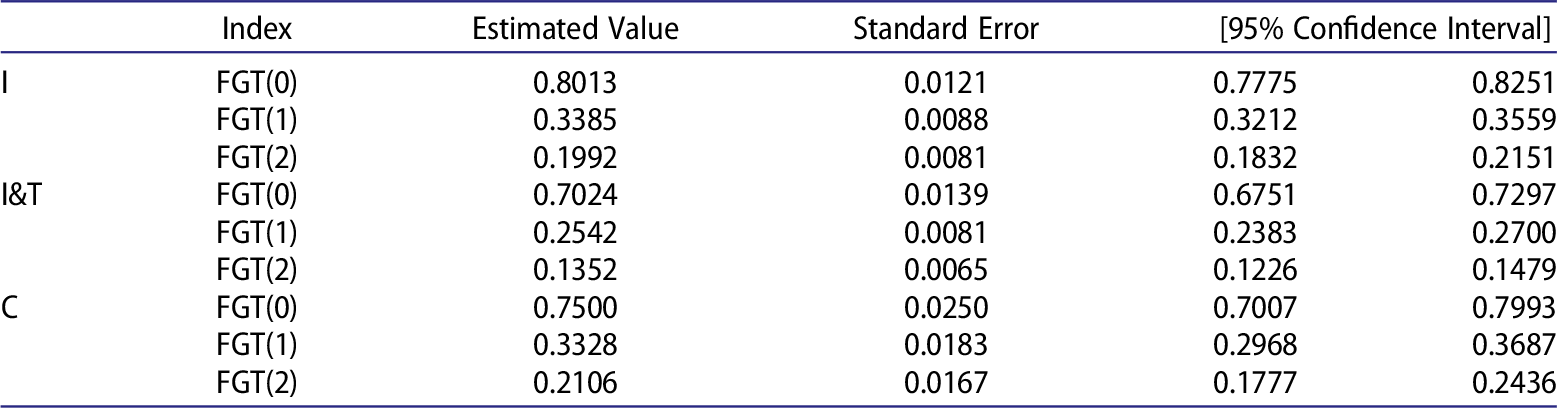
Source: Authors, based on the estimation results.
Table 4. Capability poverty: Absolute and relative differences.

Source: Authors, based on the estimation results.
At the 95% confidence interval, results show no statistically relevant evidence that the incidence of capability poverty in the non-transfer intervention group (0.8013) is different than in the control group (0.75) because of the overlapping confidence intervals. There is also no statistically significant evidence that the incidence of capability poverty in the intervention group that receives transfers (0.7024) is different than the control group (0.75) because the confidence intervals also overlap. Meanwhile, there is statistically significant evidence that capability poverty in the intervention group that receives transfers (0.7024) is lower than in the non-transfer intervention group (0.8013), at 0.0989 percentage points.
Similarly, at the 95% confidence, results present no statistically relevant evidence level that the intensity of capability poverty in the non-transfer intervention group (0.3385) is different from the control group (0.3328) because the confidence intervals overlap. Contrarily, there is statistically relevant evidence that the intensity of capability poverty in the intervention group that receives transfers (0.2542) is lesser than for the non-transfer intervention group (0.3385) and the control group (0.3328); 0.0843 and 0.0786 percentage points, respectively. On average, there is a smaller income gap in capability poverty households and the specific poverty line when there are transfers, in comparison when there are not.
Finally, results indicate no statistically relevant evidence (at the 95% confidence interval) that income inequality between those with capability poverty in the non-transfer intervention group (0.1992) is different from the control group (0.2106) because their confidence intervals overlap. On the contrary, there is statistically significant evidence that income inequality of people with capacity poverty in the intervention group who receive transfers (0.1352) is lower than the non-transfer intervention group (0.1992) and the control group (0.2106); .0640 and 0.0754 percentage points, respectively. Therefore, on average, income inequality is lesser between those who have capability poverty and receive transfers from the programme than those who do not.
Patrimonial poverty
Tables 5 and 6 indicate the FGT α values and the absolute and relative differences for incidence, intensity, and inequality.
Table 5. Patrimonial poverty: Absolute and relative differences.

Source: Authors, based on the estimation results.
Table 6. Patrimonial poverty: absolute and relative differences.

Source: Authors, based on the estimation results.
At the 95% confidence interval, results show no statistically significant evidence that patrimonial poverty in the non-transfer intervention group (0.9547) is different than the control group (0.9333) or even in the intervention group that receives transfers (0.9372) because the confidence intervals overlap. Therefore, we can conclude that transfers from the programme do not help to reduce the number of households in patrimonial poverty.
Besides, at the 95% confidence interval, results indicate no statistically relevant evidence that the intensity of patrimonial poverty in the non-transfer intervention group (0.5527) is different than in the control group (0.5369) because the confidence intervals overlap. On the other hand, there is statistically significant evidence that the intensity of patrimonial poverty in the intervention group that receives transfers (0.4872) is lesser than in the non-transfer intervention group (0.5527) and the control group (0.5369); at 0.0655 and 0.0491 percentage points, respectively. Therefore, on average, there is a smaller income gap in patrimonial poverty and its poverty line in households that receive transfers in comparison to those that do not receive them.
Finally, results show no statistically significant evidence, at the 95% confidence interval, that income inequality among households with patrimonial poverty in the non-transfer intervention group (0.3658) is different than in the control group (0.3621) because of the overlapping confidence intervals. Despite this, there is statistically significant evidence that income inequality in households with patrimonial poverty in the intervention group that receives transfers (0.2949) is lower than in the non-transfer intervention group (0.3658) and in the control group (0.3621); at 0.0709 and 0.0672 percentage points, respectively. Therefore, on average, income inequality is lower in households with patrimonial poverty that receive transfers in comparison to those that do not receive them.
Discussion
Findings support that the OpPr transfers create differentiated effects that depend on the poverty level of the household. Analysis of the food poverty line presents statistically significant evidence that the Oportunidades programme reduced its incidence, intensity, and inequality. However, there is no conclusive evidence of the programme’s effects on capability poverty. In incidence, the only statistically significant evidence of a difference in estimators is observable through the comparison between the intervention transfers group and the non-transfer group, but not the control group. Therefore, both the intensity and inequality of poverty of capabilities were affected.
Likewise, in patrimonial poverty, findings support that the programme had no effect on incidence, but it affects intensity and inequality. Although the programme focuses on increasing the human capital of people in poverty, no significant effect was found on lowering capability poverty or on reducing patrimonial poverty; the low effect on these two types of poverty could lead adolescents to leave school due to the lack of income in the home, and join work at early ages (Martínez, Reference Martínez2012), allowing poverty being transmitted from one generation to another, which inhibits the purpose of the programme.
Besides, although the reduction in the intensity of poverty occurred in the three types of poverty, effects are strongest in reducing food poverty (33%), followed by capability poverty (24%), and finally, patrimonial poverty (9%). The relative effects are higher in terms of reducing the intensity rather than the incidence of poverty, which shows that the programme makes beneficiaries less poor but does not remove them from poverty. The most relevant effects can be seen in the reduction of inequality, in income distribution, between households dealing with poverty. It means that the programme has helped to homogenise poverty but has not changed the position of the poor, concerning different levels of poverty.
These results are similar to those found in studies in other countries, as well as in some studies in Mexico (Agostini et al., Reference Agostini, Brown and Góngora2010; Bracamontes & Huesca, Reference Bracamontes, Huesca, Huesca, Camberos and Calderón2011; Manzanares Rivera, Reference Manzanares Rivera2013), which found that cash transfers had minimal effects in getting recipients out of poverty in urban areas, and most effects were on households in extreme poverty. Even though we cannot confirm these results for rural areas, evidence shows a low impact in the urban areas in the study, demonstrating that these types of programmes are not useful to help beneficiaries to get out the poverty threshold. Besides, findings support that not having the programme means higher levels of poverty at the individual and household level.
In our study, this last result is potentially explained, first, by the amount that households receive from the OpPr transfers. Transfers are composed mainly of scholarships for children who are studying; however, the sum received for them is lesser than the minimum wage they could earn if they decide to leave school and join to the market job, particularly for young people. Additionally, the scholarships are not paid during vacations because it is believed that young people have no expenses during that time.
Second, the household characteristics, such as the type of householder and his/her education level, presence of an unemployed family member, number of people in the household, and number of school-aged children, influence transfers results on poverty (Campos-Vázquez et al., Reference Campos-Vázquez, Chiapa, Huffman and Alma2013; Martínez & Ramirez, Reference Martínez and Ramirez2015). Also, there is the loss of the real value of the minimum wage, because it was not higher than the poverty line during the time we carried out this study.
The low minimum wage is one of the reasons that women who worked at home tried to combine their household responsibilities (attending health workshops, making sure their children go to school, among others) with making money during their free time. They sell products from catalogs, clean houses, or sell food, besides their household chores and family care. Literature (Adato & Roopnaraine, Reference Adato, Roopnaraine, Adato and Hoddinott2010; Molyneux, Reference Molyneux2007; Nagels, Reference Nagels2016) reports two-fold work turns, but our results show that women in beneficiary households work even three-fold turns so their household can stay in the programme.
Despite the cash transfers did not raise the recipients out of poverty, they did increase their income. Without transfers, there would probably be higher rates of incidence, intensity, and inequality among the beneficiaries. It is important to consider that most of the socioeconomic traits of the control group households were similar to those in the intervention group; what makes the difference was whether they received the monetary transfer from the programme. This finding shows that the conditions of poverty in this group are almost equal to those of the beneficiaries, which might expose the programme’s failures regarding inclusion and exclusion. Even though the OpPr covers the population in extreme poverty, it does not cover the population in poverty (Cecchini & Atuesta, Reference Cecchini and Atuesta2017) such as those in the control group. That occurs because some individuals do not accurately declare their income due to affectations on their self-esteem or stigma within the community for calling themselves poor (Sen, Reference Sen2000). Therefore, they provide false information about their situation, which allows them to participate in the programme. Meanwhile, others report a lesser income, which permits them to be included among the needy when they are not. Thus, it is central to rethink how resources are allocated. Perhaps, the use of universalisation or a combined model (selecting the most impoverished contexts at the municipal level and granting universality all the people in that place) can be convenient, so all families living in the extreme poverty areas can benefit from the programme without experience exclusion and discrimination (Martínez, Reference Martínez and Cotler2014).
Conclusions
CCTs have been used as a mean for providing income and basic capabilities to people in a situation of poverty because it is assumed that higher income levels will get them out of income poverty. In that sense, the transfers play a priority role by injecting economic resources into households. However, our findings support that these transfers have not had significant effects on raising households above the poverty line. The impact of the transfer can be summarised as some households moving from one line to another, with results being more pronounced among the poorest households.
In line with the programme purpose (i.e. capabilities generation) the expectation for transfers is to be used for food and education expenditure that would help to increase human capital. However, considering poverty in households, the distribution of resources does not always follow the rationale, since resources are allocated based on priority criteria. Families usually spend cash transfers on fulfilling their most urgent needs, such as paying outstanding utility bills (water, electricity, and others) or on other expenditures that have no direct impact on improving capabilities (e.g. payment of debts, repairs to the house, among other).
Despite the study was performed in states with a low prevalence of poverty and little social deprivation (CONEVAL, 2016), results were contradictory: we expected greater impacts on poverty reduction. Even though positive effects were found in terms of intensity and inequality, people stayed in poverty, except in the most extreme cases. For that reason, Campos-Vázquez et al. (Reference Campos-Vázquez, Chiapa, Huffman and Alma2013) find that the effects of cash transfers are observed in comparative studies between the poorest and the less-poor households. Our results indicate a similar trend: the strongest effect of the three estimators is located among the extremely poor. Also, they are consistent with studies (Cortés et al., Reference Cortés, Banegas and Solís2007; Velázquez Leyer, Reference Velázquez Leyer2018) where the cash transfers of the OpPr that have the highest impact among the poorest households are not enough to get them out of poverty.
Results highlight a problem that cannot be solved through cash transfers. Although transfers help to improve conditions in households as a mean of preventing people from falling into more extreme poverty in the short and medium term, the core reason for the transfers is to provide an incentive for families to secure children assistance to school and illnesses prevention. Thus, in the future, they can join the workforce under better conditions and break from the intergenerational poverty cycle (Levy, Reference Levy2004).
It should be noted that this result depends clearly on the economic growth that enables the creation of high-quality jobs with clear benefits. Therefore, the Mexican government should take more definitive actions. Full-time employment is less in quantity and feasibility, which is why programmes that help to maintain minimum levels of wellbeing and of household income fluidity are important to fulfil household members needs. These resources must be enough to maintain a standard of living because it is easy to fall into the money transfer trap (Martínez, Reference Martínez2013) where everyone is provided with economic resources but in a very low amount that they do not allow people to escape from the poverty line.
Disclosure statement
No potential conflict of interest was reported by the authors.
Funding
This work was supported by the Research Institute for Development with Equity (EQUIDE) and Iberoamericana University Research Department (grant number F111025 SNI).
Notes on contributors
Oscar A. Martínez-Martínez, a professor of statistical sociology, writes on both social welfare and on evaluation public policy. Among his recent papers are Incorporating Public Insecurity Indicators: A New Approach to Measuring Social Welfare in Mexico (Social Indicators Research 2018) and Validation of a Multidimensional Social-Cohesion Scale (Sociological Methods & Research 2018).
Mauricio Coronado-García is the Director of Public Policies Evaluation in the Government of the State of Nuevo León. Among his recent papers ‘Challenges in the quantification of the potential population of public policies by demand that pursue efficiency’ (Universidad Autónoma Metropolitana, 2017) and ‘Rethinking the construction of welfare in Mexico: Going beyond the economic measures’ (Journal of Social Welfare, 2016).
Dania Orta-Aleman is a Ph.D. candidate in International Health and a fellow at the Johns Hopkins Center for a Livable Future. Her work focuses on the design and evaluation of policy and environmental public health interventions for chronic disease prevention.
ORCID
Oscar A. Martínez-Martínez http://orcid.org/0000-0003-4103-674X
Appendix
Bi-monthly grant amounts in dollars (USD)

*Grants are by beneficiary, young person, or older adult.
*An amount of $330 is for elementary and secondary school beneficiaries.
Source: SEDESOL, 2009.


