1. Introduction
The role of noneconomic variables in economic performance has received immense interest in the past decade. Adelman and Morris (Reference Adelman and Morris1967, Reference Adelman and Morris1968) were among the leading scholars in development economics to empirically investigate this relationship. However, there was a dearth in development literature regarding this relationship for a number of decades until North (Reference North1994) suggested in his acceptance speech of the Nobel Prize in Economics that the lack of significant progress in economic development in the last 50 years was due to the erroneous idea that noneconomic variables did not matter. This led to a renewed interest among development economists in the role of noneconomic and institutional factors in economic performance.
An important aspect of this discourse has focused on the influence of ethnic diversity on economic development and growth, which has occasioned a substantial number of scholarly attention, particularly in economics and political economics literature. In the latter, Mauro (Reference Mauro1995) was the first to introduce the concept of ethnic diversity and empirically examine its effect on economic growth. Employing the diversity index, the Ethno-Linguistic Fractionalization (ELF) Index, he concluded that ethno-linguistic fractionalization leads to a greater probability of political instability and impedes economic development.Footnote 1 The concept of the ELF was developed in 1964 by Soviet social scientists in an attempt to determine the number of ethno-linguistic groups in the world population. Subsequently, Taylor and Hudson (Reference Taylor and Hudson1976) used the Soviet data to compute an ELF Index that has since been the most widely used measure of ethnic diversity by social scientists. Mauro's study opened a new area of focused inquiry on the consequences of ethnic fragmentation on economic performance in ethnically fragmented societies particularly in sub-Saharan Africa (hereafter SSA). In a seminal paper by Easterly and Levine (Reference Easterly and Levine1997) titled ‘Africa's Growth Tragedy’, the authors attribute Africa's poor economic performance to its high level of ethnic diversity and conclude that such diversity has contributed to poor development policies on the continent, including low provision of public goods.
Studies have revealed both the direct and indirect effects of ethnic fragmentation on economic performance and quality of institutions. For instance, Alesina and Drazen (Reference Alesina and Drazen1991), Alesina and Rodrick (Reference Alesina and Rodrik1994), Alesina and Tabellini (Reference Alesina and Tabelleni1989), Alesina and Spoloare (Reference Alesina and Spoloare1997), Collier (Reference Collier2000), Shleifer and Vishny (Reference Shleifer and Vishny1993) show that in heterogeneous societies there is a greater likelihood for competition among interest (ethnic) groups for the provision of public goods, leading to poor public policy decisions. Annett (Reference Annett1999) shows that ethnic fractionalization leads to higher levels of government consumption and thus diverts resources away from macroeconomic variables needed to promote and sustain economic development. Easterly and Levine (Reference Easterly and Levine1997) show that ethnic diversity affects economic performance by working indirectly through public policies, political instability, and other economic factors.
Several authors have reinforced conclusions by Easterly and Levine (Reference Easterly and Levine1997) and substantiated the observation that an omitted relevant variable in growth regressions is the effect of social dynamics on long-term growth. La Porta et al. (Reference La Porta, Lopez-de-Silanes and Vishny1999), for example, suggest that ethnic diversity is an important factor that influences the quality of government; Barro (Reference Barro1999) suggests that ethnic diversity makes it difficult to sustain a democracy due to competition for control over limited resources. Alesina et al. (Reference Alesina, Devleeschauwer, Easterly, Kurlat and Wacziarg2003) conclude that ethnic and linguistic fractionalization variables are important determinants of economic success. Finally, Montalvo and Reynal-Querol (Reference Montalvo and Reynal-Querol2005) confirm that ethno-linguistic fractionalization has direct negative effects on growth. In general, it is well established in economics literature that ethnic fragmentation has significant effects on long-term economic performance. The challenge remains, however, how to measure the existence and extent of ethnic difference. Most empirical cross-national studies have relied on the ELF index as the measure of ethnic fragmentation. But, recently, various authors have proposed a hybrid of measures of ethnic fragmentation to more accurately assess the effect of fragmentation on economic performance.Footnote 2 Computationally, these indices of fragmentation are modifications of the ELF index.
In this paper, I examine empirically the effects of fragmentation on economic growth based on an alternative composite index of ethnic fragmentation called the Social Diversity Index or SDI.Footnote 3 The SDI measures social fragmentation and represents an attempt to combine multiple and overlapping characteristics of ethnic identity in a single index in order to more accurately capture the breadth and depth of social fragmentation and its importance for growth potential. Section 2 of this paper identifies methodological problems in measuring ethnic fragmentation. Section 3 discusses the data and the empirical strategy. Section 4 presents the results from the empirical analysis. Section 5 provides concluding remarks.
2. Ethnic identification: problems of methodology
The most widely used measure of ethnic fragmentation, the ELF index, is based solely on linguistic groupings. Despite its instrumental value, language like other forms of differentiation such as race, religion, and culture often masks fundamental distinctions in plural societies. Further, ethnic and singular cultural indices of diversity pose the additional complication of overlap. Ethnic identity has multiple cross-cutting features that combine linguistic, racial, religious, and cultural elements, each distinguishable and manifested in the political economy of heterogeneous societies. Thus, distilling true ethnic identity is further obscured by cross-cutting cleavages. The inadequacy of the ELF index as a robust measure of ethnic diversity has been previously discussed in the literature (Posner, Reference Posner2004; Okediji, Reference Okediji2005). Scholars have sought to determine which single index of ethnic diversity − whether linguistic, religious, racial, or any other cultural ascription – best captures the effect of fragmentation on growth. Although ethnic groups or categories are well defined in anthropological literature, these demarcations do not necessarily exist or operate as isolated characteristics implied by the cultural/ethnic ascriptions. In other words, these identity boundaries are not rigid (Enloe, Reference Enloe, Hutchinson and Smith1996). Consequently, measuring ethnic diversity per country can be complex due to overlapping boundaries of ethnic attributes.
Enumerated in the subsequent discussion in a survey of a sample of countries are reasons for proposing a composite index of ethnic diversity, such as the SDI. Computationally, the SDI captures these multiple overlapping dimensions of ethnic identity in a single index in an attempt to recognize the multifaceted nature of ethnic identification. The SDI is an alternative to the singular indices that fail to portray the significant overlapping features of cultural expression that nevertheless represent significant and material dimensions of ethnic identification.
The fluid nature of ethnic identity is prevalent in SSA. This is especially the case in Nigeria. Nigeria has more than 250 ethnic groups marked geographically by a North–South dichotomy. Dominant ethnic groups (Yoruba, Hausa, Ibo, Ijaw, and Kanuri) also represent the major language groups. Another dimension of the ethnographic landscape embedded in the North–South cleavage is religion, with Christianity generally dominating the South and Islam the North. Thus, ethnic identity in Nigeria typically includes distinct but overlapping traits of language, dialect, religion, custom, and geographic location. While the situation in Nigeria is particularly complex, SSA is well known for deep ethnic divisions erupting along several lines that range from linguistic to religious but that regularly overlap in the political and economic structure of governance whether dictatorial or democratic (Bardhan, Reference Bardhan1997; Horowitz, Reference Horowitz1985, Reference Horowitz, Diamond and Plattner1994).
South Africa, for example, presents yet another case in point. It is one of the most ethnically and racially diverse countries in the world. Embedded in the four broad racial categories, ‘Asian’, ‘Black’, ‘Coloureds’, and ‘White’, are ethnic groupings among black South Africans. These ethnic distinctions are primarily based on linguistic distinctions and a number of dialects. Thus, ethnic diversity in South Africa is a complex combination of ethno racial characteristics. As is well known historically, the country has been most clearly demarcated along racial lines, while ethnicity and race have served primarily instrumental and symbolic purposes (Adam, Reference Adam1995).
In Brazil, centuries of miscegenation among races, Europeans, Indians, and Black Africans, has created an ethno racial or multiracial society. Ethnic diversity is perceived along a color continuum, whereby the apex is white and the bottom is black (Skidmore, Reference Skidmore1974, Reference Skidmore1999; Hasenbalg, Reference Hasenbalg1984; Burns, Reference Burns1993). The ELF index does not accurately depict the extent of fragmentation in Brazilian society, especially given the fact that majority of Brazilians speak Portuguese. The ELF value for Brazil is 0.06, which infers an almost ethnically homogeneous society, while the SDI value is 0.6571, which to the contrary suggests that Brazil is an ethnically diverse society.
Similar to Brazil, India is a fascinating example of the complex and multifaceted nature of ethnic identity. An individual's identity is based on a combination of language, caste, tribe, regional background, and religion. For example, language and region tend to be intertwined; someone from West Begali would speak Bengali or Bangala, but his/her language does not necessarily reveal an ethnic identity. That individual could be Buddhist, Christian, Hindu, Muslim, Sikh, or belong to any other religion.
The heterogeneous complex of attributes associated with ethnic identity is not limited to developing economies. Member countries of the Organization of Export Cooperation and Development (OECD) also reflect this phenomenon. Canada, for example, is often described as an ‘ethnic mosaic’. According to the 2006 Canadian Census, there are more than 200 ethnic groups in the country, with the pluralistic character of the society further expressed in terms of language.Footnote 4 Ethnic identity is quite complex and often represents a combination of multiple ethnic identities, such as Canadian–Italian–Irish or Japanese–Polish, or say, Korean–Scottish–Canadian. Diversity can also be expressed along religious lines; although Christianity is the most dominant religion, Islam, Hinduism, and the Sikh religion are expected to rise dramatically.Footnote 5
Similarly, Switzerland is one of the most ethnically and culturally diverse countries in Europe. There are four official languages, French, German, Italian, and Romansh as well as a number of other non-official languages, including English, Turkish, and Bosnian (Maclaren, Reference Maclaren2007). Buehler et al. (Reference Buehler, Kaiser and Jaeger2009) show that there is an overlap between the linguistic regions and the 26 cantons which comprise the country. Additionally, the country is religiously diverse, with a large number of Catholic adherents (42%); Evangelical Reformed Church (33%); and a fast-growing Islamic population (4%) (Buehler et al., Reference Buehler, Kaiser and Jaeger2009; Maclaren, Reference Maclaren2007). Studies have shown a demonstrated overlap between linguistic region and religious affiliation (Buehler et al., Reference Buehler, Kaiser and Jaeger2009).
Even though the SDI is a composite index, a uniquely beneficial feature of the measure is that it allows for various sources of ethnicity or captures the dominant expression of such identity. Despite the marked improvement of the SDI over the ELF index, there are some potential criticisms that may be leveled against the SDI. First, population totals are pooled in order to calculate the SDI and do not account for inter-group variation, such as the variation between a linguistic and a religious group. The prevailing index also suffers from this identical shortcoming. In spite of this, the SDI is a stronger measure because it accounts for multiple overlapping forms of cultural expression and introduces less equivocal line-drawing in an effort to determine indices of ethnic identification.
A complex aspect of ethnic fragmentation that is beyond the scope of this paper is the problem of endogeneity. Specifically, it relates to the fact that ethnic compositions may change over time, perhaps due to an endogenous factor, such as political manipulation of ethnic groups that leads to ethnic conflict and ultimately civil wars (Alesina et al., Reference Alesina, Devleeschauwer, Easterly, Kurlat and Wacziarg2003; Alesina and La Ferrara, Reference Alesina and La Ferrara2005). To date, there are minimal efforts in the literature to develop a theoretical basis explaining how and why ethnic compositions change overtime and possible endogeneity aspects of ethnic diversity. One obvious reason for changes in ethnic composition over time is migration flows (Sowell, Reference Sowell1996). These can be prompted by labor mobility, by civil wars, or by changes in fertility rates or mortality rates. There is no shortage of examples of ethnographic changes caused by ‘ethnic cleansing’, such as in the case of Bosnians in former Yugoslavia or the Hutus and the Tutsi's in Rwanda (Gagnon, Reference Gagnon, Diamond and Plattner1994). Of course, the forced disruption and migration occasioned by such conflict also lead to dramatic shifts in ethnic composition particularly over generations.
Changes in ethnic compositions as a result of migration flows and fertility/mortality rates are time trends. To investigate the effect of potential changes in ethnic compositions on the SDI, diversity values were computed for 1970, 1980, 1990, and 2000 for the countries in the current study; they were almost identical to the SDI values reported in Table A3.Footnote 6 The inability to observe potential time trends in diversity values limits the current study to a static effect of ethnic diversity on growth. Significant data constraints also limited the inquiry to ten-year intervals. Section 4 of this paper partially explores the indirect effects of fragmentation on growth using a two-stage least-squares estimation.
Data sources for measuring ethnic fragmentation
Major sources of data for identifying ethnic groupings include the Encyclopedia Britannica (EB), the Library of Congress Country Study (LCCS), the World Christian Encyclopedia (WCE) (Barrett et al., Reference Barrett, Kurian and Johnson2001), the CIA World Factbook, and the Handbook of Political Indicators. The EB has an extensive compilation of linguistic groups for about 220 countries. The EB also provides data on religious affiliation, but it relies on the data from the WCE. The LCCS provides information on the share of population that belongs to different religious and ethnic groups, but, in general, the data provided are rather limited. The CIA World Factbook lists the official linguistic and religious affiliations, though not as comprehensive as other sources; it lacks, for example, a detailed account of the proportions of a population that practice non-traditional or indigenous religions. The primary data source for computing the SDI was the WCE (Barrett et al., Reference Barrett, Kurian and Johnson2001) and secondary sources included the CIA World Factbook (1999) and The World Handbook of Political and Social Indicators (1972).
The second edition of the WCE (Barrett et al., Reference Barrett, Kurian and Johnson2001) presents the most extensive coverage of the proportions of a population that belongs to linguistic, religious, ethnic, and racial groups for 238 countries; it is a remarkable improvement over the first edition published in 1982. For example, under the category of religious affiliation, Christians are divided into Roman Catholics, Protestants, Independents, Anglicans, and Methodists, with the corresponding share of the population that belongs to each group. The WCE also indicates the share of the population that belongs to other religions, such as Hinduism, Judaism, Baha'i, Buddhism, and Confucianism. In the non-religious category, it lists the proportion of a population that is Spiritist, Atheist, and Ethnoreligious. For the religious category ‘Islam’, WCE lists the share of a population that belongs to Sunni and Shiite sects, which is followed by a discussion of the dominant expression of each sect practiced, such as Wahhabi Sunni, and the share of the population that belong to such group. The The World Handbook of Political and Social Indicators (1972) contains the ELF index based on data from Atlas Narodov Mira (1964) and fractionalization indices from (Roberts, Reference Roberts and Rice1962; Muller, Reference Muller1964).
3. Data and empirical strategy
To empirically determine the effect of the SDI on long-term growth, we employ the seemingly unrelated regressions (SUR) for a sample of 132 countries from 1960 to 2000. This specification has been employed in recent studies analyzing this relationship, for example see Alesina et al. (Reference Alesina, Devleeschauwer, Easterly, Kurlat and Wacziarg2003), Alesina and La Ferrara (Reference Alesina and La Ferrara2005), Barro (Reference Barro1991), Easterly and Levine (Reference Easterly and Levine1997), Montalvo and Reynal-Querol (Reference Montalvo and Reynal-Querol2005).Footnote 7 The specification is of the following form:
where GDPGY is the growth rate of GDP per capita from 1960 to 2000. A separate regression is run for each ten-year period. The right-hand variables include a set of I-variables, investment variables, or fiscal policy variables. Since the regression analysis focuses on long-run growth across countries, to capture the convergence effect that real per capita GDP grows faster in poor countries than in rich ones as demonstrated by Barro and Sala-i-Martin (Reference Barro and Sala-i-Martin1992), we include the logarithm of GDP per capita (Log INC) or initial income at the beginning of each decade, and the square of initial income (Log INCSQ) at the beginning of the decade. The convergence effect has been shown to be nonlinear initially rising and then declining with per capita income (Easterly, Reference Easterly1994). To control for this we include both variables.
To account for human capital, the percentage of the population that attained secondary school level (SCHOOLING) from (Barro and Lee, Reference Barro and Lee2000), also measured at the beginning of each decade, is included. Fiscal policy variables include average general final government consumption expenditure (less spending on education and defense) as a ratio of real GDP for the period (FISCAL SURPLUS), the average ratio of real foreign domestic investment to real GDP for the period (NFDI), and trade openness (OPEN) from Sachs and Warner (Reference Sachs and Warner1997). The openness indicator takes on a value of one or zero representing whether the country is open to trade. Finally, we include a political stability variable, the average political rights index, as a proxy for democracy (POLR) gathered from the Freedom House. The political rights index is measured on a scale of one to seven, with one representing the highest degree of freedom and seven the lowest. The criteria included for a rating of one include (1) free and fair elections, (2) competitive political parties, (3) no discrimination among the polity, and (4) the ability of minority groups to participate in the governing process. A rating of two to seven requires various degrees of constriction of the above criteria with a rating of seven implying the worst degree of freedom – oppression involving a warlord dominating political power and a country embroiled in civil war.
For measures of social fragmentation, we include the SDI and ELF. To examine the relationship between democracy, fragmentation, and growth, a variable CWar – civil wars that resulted in at least 1,000 deaths – is also included in the regressions. Civil wars are catastrophic episodes that have lingering effects on economic performance (Collier and Sambanis, Reference Collier and Sambanis2002; Hoeffler, Reference Hoeffler2008). The variable CWar serves as an indicator of political instability and can also assess the extent or persistence of violent conflicts in a country (Djankov and Reynal-Querol, Reference Djankov and Reynal-Querol2007). The data for CWar were gathered from several sources, including Fearon (Reference Fearon2003) and Sambanis (Reference Sambanis2000), Centre for Study of Civil Wars, and Correlates of War (COW), University of Michigan. Sambanis (Reference Sambanis2000) defines a civil war as one that resulted in more than 1,000 deaths, occurred within the boundary of a country/state, challenged the sovereignty of an internationally recognized state, involved a state as a principal combatant, included rebels who had the capacity to organize armed opposition to a state, and in which the parties engaged in armed conflict were concerned with the prospects of living together in the same political unit after the war. This variable CWar takes on a value of one if there was a civil war during the period and zero otherwise. In the pooled regression model, decade dummies or time dummies are included for each decade.Footnote 8 We also partially explore the indirect effects of fragmentation on growth through democracy in a two-stage least-squares specification in which we employ a variable MUSLIM as an instrument. The variable MUSLIM is a dummy variable for countries with majority Muslim populations as proposed by Mobarak (Reference Mobarak2005).
4. Empirical results
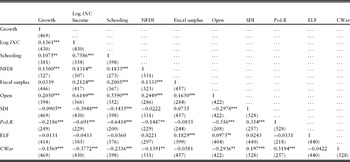
Table 1 presents summary statistics for our sample from 1960 to 2000. The mean of the per capita growth rate is 1.36% and ranges from –0.01% for Jamaica to 8.9% for China. The mean of the SDI is 77.5% and ranges from 14% for Hong Kong to 99.84% for Myanmar. The mean of the ELF index is 41.9% and ranges from 0% for Korea to 93% for Tanzania. Table 2 shows the correlation between measures of social fragmentation and several determinants of economic growth. Both the SDI and the ELF index are negatively correlated with per capita GDP growth. Both measures of fragmentation are also correlated with other macroeconomic variables, such as initial income, schooling, and foreign investment, and have the expected sign, with the exception of the correlation between the ELF index and foreign investment, which turns out positive.
Table 1. Summary statistics

Table 2. Pairwise correlations between social fragmentation and determinants of growth

Notes: Number of observations in parentheses; *significant at 10%, **significant at 5%, ***significant at 1%.
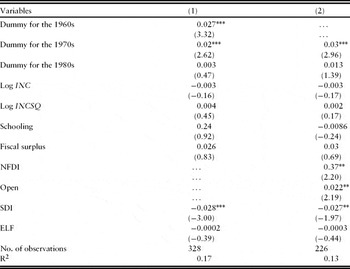
Table 3 presents comparisons of the SDI and the ELF index on growth, educational attainment, initial income, and initial income squared, columns (1) and (3); the intercept terms for each decade are also reported. Statistically speaking, the specification with the SDI suggests that ethnic fragmentation is negatively correlated with growth, while the specification with the ELF index shows that ethnic fragmentation is not correlated with long-term growth. Controlling for fiscal surplus, columns (2) and (4), the statistical significance of the SDI on growth increases moderately, but there is no evidence of a statistical correlation between the ELF index and long-term growth. In terms of impact on long-term growth, the economic effect of moving from a purely homogenous society (SDI of 0) to a highly heterogeneous society (SDI of 1) implies a reduction in the annual growth by 2.4 percentage points. On the basis of the SDI values, we can infer that the difference in annual growth rate of about 2.06 percentage points between Burma and Hong Kong can be attributed to overlapping combinations of social fragmentation. Again, the coefficient of the ELF index is statistically insignificant.
Table 3. Social fragmentation and economic growth (dependent variable is the average growth of per capita GDP)

Notes: Equations estimated using seemingly unrelated regressions for ten-year periods. T-statistics in parentheses; *significant at 10%, **significant at 5%, ***significant at 1%.
In Table 4, the inclusion of additional macroeconomic variables, net foreign investment and trade openness, results in a moderate decline in the effect of social diversity on economic growth, while the specification with the ELF index suggests that fragmentation is not correlated with growth.Footnote 9 However, both specifications suggest that foreign investment and trade openness are strongly positively correlated with growth. Nevertheless, the results of the relationship between foreign investment and growth should be carefully weighed due to the ambiguity in the relationship, that is whether foreign investment leads to more growth or vice-versa. Empirical studies on this relationship remain rather indecisive as to the concise direction of the link between the two variables (Noormamode, Reference Noormamode2008; Wu and Chih-Chiang, Reference Wu and Hsu2008).Footnote 10 To address the endogeneity issue, we instrument foreign investment by using a variable, logarithm of total population. The results are presented in Table 5. Columns (1) and (2) give the first stage regressions separately for both measures of fragmentation; the variable, logarithm of total population, is highly statistically significant. However, in the second stage regressions (2SLS), the statistical significance of foreign investment on growth diminishes when it is instrumented. But the effect of trade openness on growth is statistically significant, which is consistent with the results from Table 4. These results partly confirm the ambiguity in the relationship between foreign investment and growth in economics literature.Footnote 11 Indirect effects represent another aspect of the relationship between macroeconomic variables and measures of fragmentation, and the effect on long-term growth; that is, the macroeconomic variables may serve as channels through which fragmentation affects growth.Footnote 12Table 6 presents a simple bivariate regression analysis in which the SDI and the ELF index are determinants of macroeconomic variables. The SDI is strongly inversely correlated with schooling and trade openness, but not strongly correlated with fiscal surplus. On the other hand, the ELF index is strongly correlated with fiscal surplus and trade openness. These results suggest indirect effects of fragmentation on growth functioning through macroeconomic variables.
Table 4. Social fragmentation and economic growth (dependent variable is average growth of per capita GDP)

Notes: Equations estimated using seemingly unrelated regressions for ten-year periods. T-statistics in parentheses; *significant at 10%, **significant at 5%, ***significant at 1%.
Table 5. Social fragmentation and economic growth (dependent variable is average growth of per capita GDP)

Table 6. Social fragmentation as determinants of macroeconomic variables

Notes: Equations estimated using seemingly unrelated regressions (SUR) for ten-year periods T-statistics in parentheses; significant at 10%, **significant at 5%, ***significant at 1%.
In Table 7, both measures of fragmentation are entered simultaneously in the SUR specifications. Again, statistically, in both specifications the coefficient of the SDI suggests that ethnic fragmentation is strongly negatively correlated with economic growth. On the other hand, however, the coefficient of the ELF index suggests otherwise, that is ethnic fragmentation is not correlated with growth and, in fact, its absolute value is almost zero. In the second specification, the macroeconomic variables, foreign investment and trade openness, are highly positively correlated with growth and the SDI is negatively correlated with growth.Footnote 13
Table 7. Social fragmentation and economic growth (dependent variable is average growth of per capita GDP)
Note: Equations estimated using Seemingly Unrelated Regressions for 10-year periods T statistics in parentheses; significant at 10%, **significant at 5%, ***significant at 1%.
Table 8 shows the relationship between democracy, social diversity, and linguistic fractionalization on growth. Included in each specification is the variable CWar. The average value of political rights for each decade starting from 1977 (gathered from the Freedom House data) serves as a proxy for democracy. Independently, both measures of fragmentation lose their statistical significance on growth, although democracy is correlated with growth. The coefficient is negative due to the scale of measurement. The index decreases with higher levels of political rights. In both specifications, the coefficient of democracy is statistically significant. This initial result may suggest that perhaps the effect of ethnic fractionalization on growth tends to diminish as democratic institutions become more firmly entrenched in the cultural fabric of society. Collier (Reference Collier2000) and Easterly (Reference Easterly2001) show that in advanced democracies countries that have high political rights tend to have ‘good institutions’ or at least adequate institutional mechanisms to mitigate potential problems that may stem from ethnic/racial and other social tensions.Footnote 14 When the interaction of the PoLR and the measures of fragmentation as shown in Table 9 are included, the results do not provide statistical evidence to support the premise that the effect of fragmentation on growth declines with higher levels of political rights, even though the coefficients yield the expected sign. However, these results of the analysis comparing the relationship between democracy, fragmentation, and growth must be carefully weighed due to the problem of simultaneity in the relationship between democracy and growth (Brunetti, Reference Brunetti1997; Barro, Reference Barro1999; Mobarak, Reference Mobarak2005).
Table 8. Social fragmentation, democracy and economic growth (dependent variable is average growth of per capita GDP)

Notes: Equations estimated using seemingly unrelated regressions for ten-year periods. T-statistics in parentheses; *significant at 10%, **significant at 5%, ***significant at 1%.
Table 9. Social fragmentation, democracy and economic growth (dependent variable is average growth of per capita GDP)

Notes: Equations estimated using Seemingly Unrelated Regressions for 10-year periods T-statistics in parentheses; *significant at 10%, **significant at 5%, ***significant at 1%.
The issue of simultaneity is relevant to the relationship between ethnic fragmentation, democracy, and growth. Specifically, ethnic fragmentation can influence growth indirectly through democracy. Most studies in the literature have focused on the democracy–growth link by using democracy as the right-hand variable and growth as the left-hand variable. There is no consensus in the literature about the effects of democracy on growth, and simultaneity concerns in the relationship are yet to be fully addressed (Brunetti, Reference Brunetti1997; Barro, Reference Barro1999; Mobarak, Reference Mobarak2005; Tavares and Wacziarg, Reference Tavares and Wacziarg2001).
To explore possible indirect effects of fragmentation on growth, we instrument democracy using a two-stage least-squares specification. We employ the variable MUSLIM for countries with a majority Islamic population as proposed by Mobarak (Reference Mobarak2005). According to Mobarak (Reference Mobarak2005), the conceptual links between Muslim countries and lower levels of democracy relate to the fact that the majority of the Islamic countries are former European colonies located in the Middle-East and gained their independence after World War II and hence are newer nation states. It is a known fact that established democracies take long periods of time to evolve. It is not surprising, therefore, that newer nation states will tend to reflect more shallow democratic norms. Huntington (Reference Huntington1991) posits that Islam may not be compatible with democracy due its lack of delineation between the religious and political community.Footnote 15 Since a significant number of Islamic counties are members of the Organization of Petroleum Exporting Countries (OPEC), a dummy variable for oil exporters is included to capture variations in growth.Footnote 16 Additionally, as in Mobarak (Reference Mobarak2005), a dummy variable is included to control for countries who gained independence after 1945.
Table 10 presents both the first-stage regressions and second-stage regressions, using the variable MUSLIM as an instrument for democracy. In the first-stage regressions results, in both specifications the Muslim dummy is highly statistically significant even after controlling for oil exporters and for countries that gained their independence after 1945. However, in the second-stage equation results, when democracy is instrumented in both specifications, its statistical effects on growth becomes insignificant. This result suggests that the hypothesis of an indirect effect of fragmentation on growth through democracy fails to hold up empirically. Additionally, it also confirms the apparent ambiguity in the democracy–growth link in economics literature; that is, democracy may cause growth, but not vice versa. In summary, the empirical analysis suggests that static exogenous ethnic fragmentation is negatively correlated with economic growth, but this relationship is not robust. This finding is consistent with recent work in the literature (Alesina et al., Reference Alesina, Devleeschauwer, Easterly, Kurlat and Wacziarg2003; Alesina and La Ferrara, Reference Alesina and La Ferrara2005; Posner Reference Posner2004).
Table 10. Social fragmentation, democracy, and economic growth (dependent variable is average growth of per capita GDP)

5. Conclusion
Most studies that have examined the relationship between ethnic fragmentation and growth have focused on identifying which expression of ethnic identity, linguistic, religious, or race/ethnic, has the most significant effect on long-term economic performance. In this study, we use a Social Diversity Index that incorporates multiple expressions of ethnic identity rather than a singular dimension. The empirical analysis suggests that the SDI is a better measure than the prevailing index, ELF, in capturing the effect of social fragmentation on long-term growth. The expected sign of fragmentation on growth is validated. With the inclusion of additional macroeconomic variables, there is a moderate decline in the statistical effect of the SDI on growth. This finding is consistent with recent results in the economics literature that exogenous static fragmentation is not dynamically correlated with economic growth.
The analysis confirms that attempts to delimit ethnic fragmentation to a singular measure will not capture multiple, overlapping dimensions of ethnic identity and its relationship to long-term economic performance. The paper also partially explores potential indirect effects of fragmentation on growth using a 2SLS model in which democracy is instrumented. The results fail to support the hypothesis of an indirect effect of fragmentation on growth through democracy. Further studies will explore the endogeneity aspects of ethnic fragmentation and long-term economic performance.
Appendix A
Table A1. Variables and sources

Table A2. Ethnolinguistic fractionalization index by region and rank

Source: Taylor and Hudson (Reference Taylor and Hudson1972).
Table A3. Social Diversity Index by region and rank

Source: Author's calculations.
Appendix B
Derivation of SDI

where n represents the number of people in the ith, jth, and kth groups, N is the total population, and L, R, and S are the number of linguistic, racial, and religious groups in the country.

We let ![]() , and
, and ![]() respectively be the fraction or proportion of people in each religious, racial, and linguistic group, where N is the population and n is the number of individuals in each group. If we sum over each of the groups:
respectively be the fraction or proportion of people in each religious, racial, and linguistic group, where N is the population and n is the number of individuals in each group. If we sum over each of the groups:

Since racial (x), religious (y), and linguistic (z) groups are independent, their joint probability can be determined:
Applying the Herfindahl formula for ethnic concentration, which is ELF = 1 − ∑i = 1nPi 2 where Pi is the proportion of each group i(i = 1 . . .n) gives:
This index allows social identity to be expressed as a combination of more than one identity variable. For example, an individual can be Caucasian, Christian (either Protestant or Catholic, or Orthodox), and speak English. However, an individual cannot be Caucasian, Christian, and Buddhist and be bilingual, that is speak both English and French. In other words, an individual cannot possess multiple characteristics within each particular category of race, religion, and ethno-linguistic group. Although overlap within each group is common among world populations, there has to be a primary marker of ethnic identity. That is, either race, ‘ethnic’ or religious affiliation. Because, the WCE provides information on the proportion of the population that is double-affiliated in the religious category, it is possible to determine the proportion of the overlap and appropriately adjust the index. Where applicable, each sect of a religious group is treated as an independent variable. For example, in the case of Christianity, Roman Catholics and Protestants are considered as separate and independent religious groups. For Islam, Sunnis and Shiites are also considered independent religious groups. The respective distinctions within the religions are treated as independent variables because of differences in theological interpretations of the Bible and the Koran. These differences in interpretations incline adherents to conflict and violence in the struggle for recognition and political space within their countries and in the competition for the provision of public goods and economic resources. If any of the ethnic, religious, or racial groups constituted less than 1% of the population, it was omitted from the computation of the SDI. For example, in Saudi Arabia, 93.7% of the population is Muslim, almost all of the Muslims being Sunni, 2.9% of the population is Roman Catholic, 0.4% Protestant, 0.2% Orthodox Christian, 0.2% Independent Christian, 1.1% Hindu, 0.6% Nonreligious, 0.3% Buddhist, 0.2% Sikh, 0.2% Ethno religious, 0.1% Chinese Folk Religionist, and 0.1% New Religionist. For the purposes of SDI computation, Saudi Arabia is not considered as a religiously diverse country. Given the SDI formula, values below 1% are mathematically insignificant. Another example is Brazil, where 91.4% of the population are Christians, of which 90.1% are Roman Catholics, 4.9% are Spiritists, 2.4% Nonreligious, 0.3% New Religionists, 0.3% Buddhists, 0.2% Jews, 0.1% Ethno religionists, and 0.1% Muslims. There are also ‘double-affiliated’ Christians, 17.8% Protestants, and 15% Independents. The double-affiliated Christians are individuals who are members of the Catholic Church and another denomination such as Protestant, Independent, or Anglican. It might be rather ambiguous to refer to Brazil as a religiously diverse country, especially given the strong affiliation to the Catholic Church. The data presented in the above discussion were derived exclusively from the 2001 edition of the WCE.