


Introduction
Echinococcosis is a zoonotic disease of animals and humans, caused by infection with dog tapeworm Echinococcus granulosus sensu lato (s.l.) and its metacestode stage, hydatid cyst (Menekşe et al., Reference Menekşe, Özsoy, Dağlioğlu, Güzel, Güzel and Belen2012). Echinococcus granulosus is cosmopolitan in distribution, but concentrated in the major livestock keeping or rearing areas, especially of South America, the Mediterranean, East Africa, Russia, Central Asia, China and Australia (Grosso et al., Reference Grosso, Gruttadauria, Biondi, Marventano and Mistretta2012; Fallahizadeh et al., Reference Fallahizadeh, Arjmand, Jelowdarjelowdar, Rafiei and Kazemi2019; Nungari et al., Reference Nungari, Mbae and Gikunju2019; Ramos-Sarmiento & Chiluisa-Utreras, Reference Ramos-Sarmiento and Chiluisa-Utreras2020). In Saudi Arabia (KSA), several studies have indicated that hydatid disease is endemic where dogs are one of the major factors that distribute the disease, as well as the direct sources of human infection represented in home slaughtering of camel and sheep (Abu-Eshy, Reference Abu-Eshy1998; Al-Mofleh et al., Reference Al-Mofleh, Al-Rashed, Ayoola, Al-Faleh, Al-Amri, Al-Rikabi, Al-Sohaibani and Reyes2000; Adewunmi & Basilingappa, Reference Adewunmi and Basilingappa2004; Rashed et al., Reference Rashed, Omer, Fouad and Al-Shareef2004; Al-Malki & Degheidy, Reference Al-Malki and Degheidy2013; Toulah et al., Reference Toulah, El Shafi, Alsolami and Wakid2017). The different intermediate hosts harbour different species of E. granulosus, which cause different symptoms. These extensive intraspecific variations in E. granulosus are associated with changes in lifecycle patterns, host specificity, geographical distribution, transmission dynamics, infectivity to human, antigenicity and sensitivity to chemotherapeutic agents (Adewunmi & Basilingappa, Reference Adewunmi and Basilingappa2004; Eslami et al., Reference Eslami, Meshgi, Jalousian, Rahmani and Salari2016).
A number of well-characterized strains of E. granulosus are now recognized, all of which appear to be adapted to particular lifecycle patterns and host assemblages (Thompson & McManus, Reference Thompson, McManus, Eckert, Gemmell, Meslin and Pawlowski2001; McManus, Reference McManus2002; Karimi & Dianatpour, Reference Karimi and Dianatpour2008; Rojas et al., Reference Rojas, Ebi and Paredes2017; Yan et al., Reference Yan, Liu, Wu, Zhao, Yuan, Wang and Wang2018). Currently, E. granulosus s.l. consists of at least five species (E. granulosus sensu stricto (s.s.), E. equinus, E. ortleppi, E. canadensis (G6–G10) and E. felidis), and one Gomo genotype of E. granulosus complex has been identified in Africa (Wassermann et al., Reference Wassermann, Woldeyes and Gerbi2016; Romig et al., Reference Romig, Deplazes, Jenkins, Giraudoux, Massolo, Craig, Wassermann, Takahashi and de la Rue2017). Transmission cycle involving camels and dogs is responsible for human infection (Eckert et al., Reference Eckert, Thompson, Michael, Kumaratilake and El-Sawah1989). Studying the genetic diversity of E. granulosus allows a clearer understanding to design more effective protocols for the management of this disease in endemic areas, especially in the field of progressive DNA vaccination using recombinant DNA technology, in addition to studies on vaccination resistance (Lodish et al., Reference Lodish, Berk, Zipursky, Matsudaira, Baltimore, Lodish, Berk, Zipursky, Matsudaira, Baltimore and Darnell2000; Amini-Bavil-Olyaee et al., Reference Amini-Bavil-Olyaee, Alavian, Adeli, Sarrami-Forooshani and Sabahi2006).
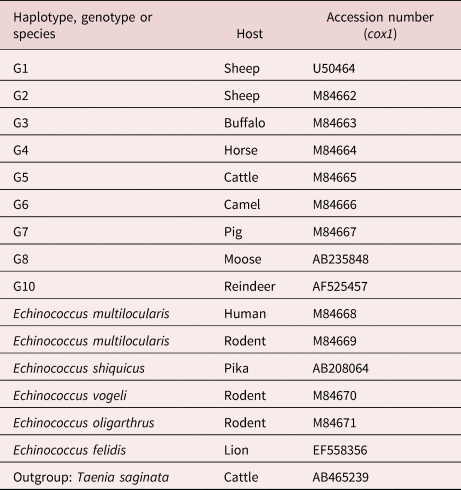
Few epidemiological studies have been published about E. granulosus s.l. in KSA, most of which focus on the seasonal prevalence and fertility degree of hydatid cysts collected from livestock (Ibrahim, Reference Ibrahim2010; Fdaladdin et al., Reference Fdaladdin, Alsaggaf and Wakid2013; Hayajneh et al., Reference Hayajneh, Althomali and Nasr2014; Almalki et al., Reference Almalki, Al-Quarishy and Abdel-Baki2017; Amer et al., Reference Amer, Haouas, Al-Hathal, El-Shikh and Ashankyty2018; Toulah & Albalawi, Reference Toulah and Albalawi2019a, Reference Toulah and Albalawib). Few studies have been conducted on the genetic diversity of E. granulosus in KSA (Al-Olayan et al., Reference Al-Olayan, Metwally, Fouad, Omer and Helmi2014; Metwally et al., Reference Metwally, Qassim, Al-Turaiki, Almeer and El-Khadragy2018; Abdel-Baki et al., Reference Abdel-Baki, Almalki and Al-Quarishy2018). The present study focuses on the genetic variation of hydatid cysts harboured by camels and sheep as intermediate hosts in Al-Madinah, KSA, by using random amplified polymorphic DNA polymerase chain reaction (RAPD-PCR) and single-stranded conformation polymorphism (SSCP) assays, along with sequencing the mitochondrial DNA cytochrome c oxidase I (cox1) gene for the collected specimens and assessing their phylogenetic positions using some global published sequence data of cox1 genes (table 1).
Table 1. Echinococcus granulosus haplotypes and reference sequences used for phylogenetic analysis of partial cox1 sequences.
Material and methods
Morphometric studies
The individual cyst was handled and processed as E. granulosus isolate (from camels and sheep). Cysts were dissected under sterile conditions. The clean, transparent hydatid fluids were aspirated and microscopically examined (Leica DME Binocular Microscope, Model 13595XXX, Leica Microsystems, Wetzlar (Germany)) for the presence of protoscoleces. From each isolate, ten protoscoleces were squeezed onto a microscope slide in polyvinyl lactophenol and examined for the averages of both measurements (three large and three small hooks per protoscolex) and numbers of rostellar hooks (all hooks of protoscolex were counted).
DNA extraction
Before DNA extraction, the hydatid fluids containing the protoscoleces were precipitated and then washed with PBS 1X. Genomic DNA was extracted by cetyltrimethylammonium bromide (CTAB) precipitation based on Yap & Thompson (Reference Yap and Thompson1987) and Mostafa et al. (Reference Mostafa, Taha and Ramadan2003) methods, with some modifications. Briefly, tissues were homogenized individually in 1.5 ml of lysis buffer (8% Triton X-100, 0.25 M sucrose, 50 mM Tris-hydrogen chloride (HCl), 50 mM ethylenediaminetetraacetic acid (EDTA), pH 7.5). Then, freshly prepared proteinase K (1 mg/ml) was added and the homogenate was incubated at 65°C in a water bath for 2 h. To precipitate the genomic DNA, 1 ml of a sterile 2% CTAB solution was added to the homogenate and centrifuged at 1500 g. The supernatant was discarded and the precipitate was dissolved in 0.5 ml of 2.5 M sodium chloride, 10 mM EDTA, pH 7.7 and diluted with 1 ml of 40 mM Tris-HCl, 2 mM EDTA, pH 7.7. Two volumes of chloroform were added to the mixture, mixed gently and centrifuged at 12,000g for 10 min; subsequently, the DNA was precipitated in absolute ethanol, incubated at −20 °C overnight and centrifuged at 12,000g for 10 min. The DNA pellet was washed with 70% ethanol and dissolved in 30 μl of TE buffer (10 mM Tris, 1 mM EDTA, pH 8.0). The DNA was stored at −20 °C until used for amplification.
RAPD-PCR
PCR amplifications were performed by the protocol reported by Williams et al. (Reference Williams, Kubelik, Livak, Rafalski and Tingey1990), using five arbitrary primers (table 2). The 25 μl mixture contained about 25 ng of DNA template, 1.5 unit of Taq polymerase, 10 mM deoxyribonucleotide triphosphatesdeoxyribonucleotide triphosphates, 10 pM primer and 2.5 μl of 10× PCR buffer. Amplifications were performed in a T-personal thermal cycler (Biometra, Göttingen, Germany), programmed for 45 cycles at 94°C for 1 min, 35°C for 1 min and 72 °C for 1 min. An initial denaturation step (3 min at 94 °C) and final extension holding (10 min at 72 °C) were included in the first and last cycles, respectively. Reaction products (10 μl) were resolved by 1.5% agarose gel electrophoresis at 90 V in 1× TAE buffer. The gel was stained with ethidium bromide and photographed with a digital camera (Sony, Cyper-shot, Tokyo, Japan) under an ultraviolet transilluminator. In an initial experiment, 20 decimer oligonucleotide primers were tested to determine those primers that produced reproducible RAPD patterns. Each primer was tested three times. Good and distinct patterns were produced only using five arbitrary decimers (table 2).
Table 2. The nucleotide sequences of primers used in this study and their (GC) contents.
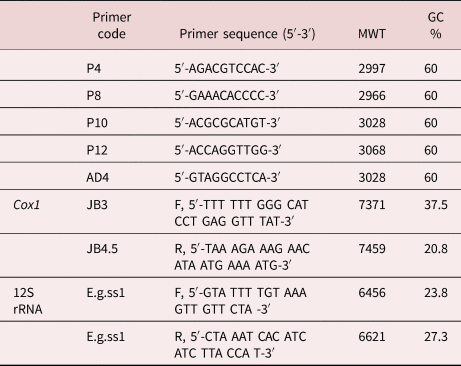
MWT, Molecular weight; GC% Guanosine and Cytosine percentage.
PCR assay for specific primers
Two pairs of primers specific for cox1 and 12S ribosomal ribonucleic acid (12S rRNA) genes were used for PCR assay (table 2). The PCR condition of cox1 gene amplification was carried out according to Bowles et al. (Reference Bowles, Blair and McManus1992), while that of the mitochondrial 12S rRNA gene was performed according to Stefanić et al. (Reference Stefanić, Shaikenov, Deplazes, Dinkel, Torgerson and Mathis2004). PCR products were visualized by agarose gel electrophoresis.
SSCP technique
The SSCP method was used, as described by Zhu & Gasser (Reference Zhu and Gasser1998). First, 8 μl of PCR samples of cox1 and 12S rRNA genes were added to 20 μl of loading dye (6X), then mixed well. After denaturation at 94 °C for 10 min and subsequent snap cooling on a frozen block (−20 °C), 8 μl of each sample was subjected to electrophoresis at 200 V for 3 h at 18 °C in a 0.4-mm-thick mutation detection enhancement gel matrix (Amersham Biosciences, New York, NY, USA). After the electrophoresis, the gel was removed and stained, then visualized over the transilluminator plate with ordinary light, and photographed using a digital camera.
Data analysis
All observed individual bands of RAPD-PCR were scored as present or absent (1 or 0) for each isolate. The similarity coefficient (SC) was calculated according to Nei & Li (Reference Nei and Li1979) and Lynch (Reference Lynch1990) as follows: S = 2 Nxy/Nx + Ny. Nxy refers to the number of bands shared between two isolates (x and y) and Nx and Ny are the number of bands amplified only by isolates x and y, respectively. Besides, the discriminatory power of each primer was calculated according to the following equation: discriminating power = the number of polymorphic bands to each primer / total number of polymorphic band of all primer X.
Sequencing and phylogenetic analysis
Cox1 genes of two isolates were directly sequenced from purified PCR products that were amplified using primers JB3 and JB4.5. The PCR products were purified using an ultra-clean DNA purification kit (Qiagen, Hilden, (Germany)) according to the manufacturer's protocol. Sequencing reactions were carried out with the Big Dye 3.3 terminator cycle sequencing kit (Applied Biosystems, Foster City, CA, USA) using the PCR conditions recommended by the manufacturer. Samples were then analysed on 6% polyacrylamide gel using an Applied Biosystems model 3100 Automated DNA Sequencing System. Sequences of cox1 genes of camel and sheep isolates were separately aligned and compared with published sequences of E. granulosus s.s. genotypes in Basic Local Alignment Search Tool of the National Library of Medicine (NCBI BLAST) (http://blast.ncbi.nlm.nih.gov/Blast) to explore the genetic strain of E. granulosus. Furthermore, sequences of cox1 genes of KSA isolates were aligned together to determine the extent of the genetic variation using BLAST® online software. The phylogenetic tree was constructed, using MEGA software version X, Pennsylvania State University, Pennsylvania, United States (https://www.megasoftware.net/), from the trimmed sequences of cox1 genes obtained by this study, in addition to standard sequences (table 1); Taenia saginata was used as outgroup. The phylogenetic tree was based on the maximum-likelihood method with the Tamura-Nei model and bootstrap method for resampling, with the number of replicates set to 1000. The genetic distance matrix among cox1 gene sequences of the camel and sheep isolates with some related published genotypes G1 (M84664), G2 (M84662) and G3 (M84663) was achieved (using MEGA software version X, Pennsylvania State University, Pennsylvania, United States (https://www.megasoftware.net/)) based on maximum composite likelihood.
Results
Morphological characters
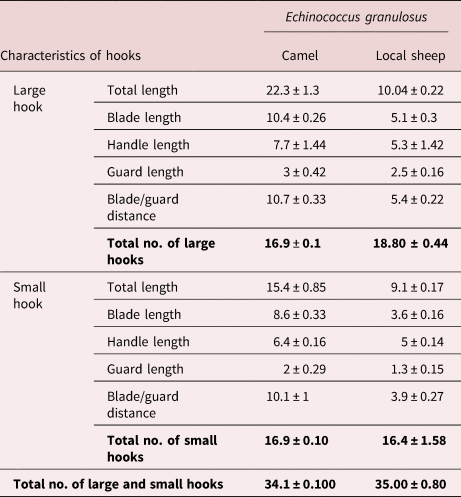
The morphological criteria of protoscoleces recovered from the two isolates under study were more or less similar. There were no apparent differences between protoscoleces recovered from the two isolates by stereoscope examination (low magnification). By compound microscope examination, it showed that each single large or small hook consists of three parts: the blade, guard and handle regions. Comparatively, the rostellar large and small hooks of camel and local sheep isolates show remarkable variability in their dimensions, where the total length, blade length and blade/guard distance of camel isolates were twice as many as the sheep (table 3). Non-significant variations were observed in the handle length and guard length of both the large and small hooks, as well as the total number of hooks (NH) of protoscoleces for two parasitic isolates (table 3).
Table 3. The number and hooks measurements (μm) of protoscoleces of Echinococcus granulosus s.s. from the camel and local sheep isolates (mean of ten protoscoleces).
RAPD-PCR
All shared bands recorded between the control host tissues and hydatid cysts of each isolate were cancelled from calculations of total bands generated with five primers.
As shown in fig. 1, AD4 primer-generated bands ranged from 150 bp to 770 bp. Three DNA fragments of 700, 280 and 150 bp were only present in camel isolates, while one DNA fragment (770 bp) was present in sheep isolate. Five DNA segments of 690, 550, 450, 350 and 240 bp were common between two isolates. The primer P4 produced DNA fragments in the range from 250 to 800 bp (fig. 2). The fragments of 650, 520, 480 and 350 bp were prominent in both isolates, while the fragments of 750 and 720 bp were prominent in local sheep only. The DNA fragments of 800, 710 and 250 bp were apparent in camels, but absent in local sheep (table 4).
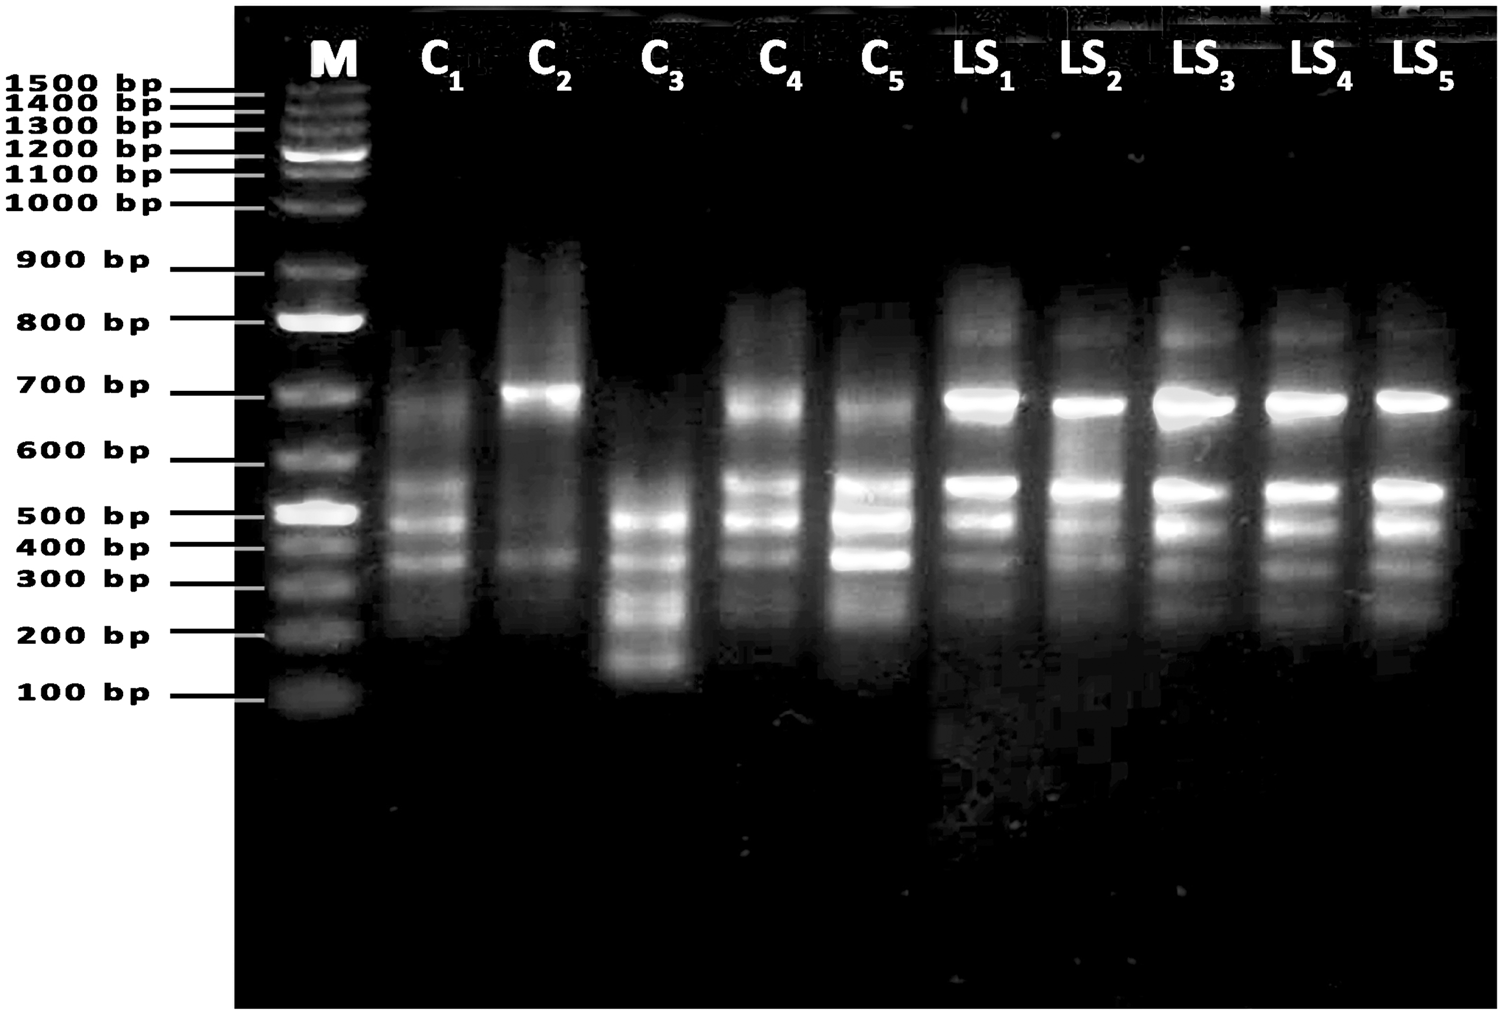
Fig. 1. PCR result of AD4 primer used with parasites isolated from samples of camel (C1–C5) and local sheep (LS1–LS5).

Fig. 2. PCR result of P4 primer used with parasites isolated from samples of camel (C1–C5) and local sheep (LS1–LS5).
Table 4. Number of total bands, polymorphic, monomorphic bands and discrimination power of RAPD primers used for Echinococcus granulosus diversity analysis.

Primer P8 amplified bands from 180 to 690 bp. There were no generated monomorphic bands between the camel and local sheep isolates. On the other hand, each isolate produced five polymorphic bands of 690, 620, 540, 340 and 200 bp in the camel isolate and 650, 600, 500, 300 and 180 bp in the local sheep isolate (fig. 3 and table 4).

Fig. 3. PCR result of P8 primer used with parasites isolated from samples of camel (C1–C5) and local sheep (LS1–LS5).
Arbitrary primer P10 amplified DNA segments ranged from 290 to 790 bp, and included five monomorphic bands of 690, 580, 530,400 and 290 bp in both camel and local sheep isolates, three bands of 770, 720 and 630 bp characteristic to camel isolate and double DNA bands of 790 bp and 710 bp characteristic to local sheep isolate (fig. 4). P12 primer-generated fragments ranged from 290 to 800 bp. Six DNA bands of 800, 720, 690, 540, 400 and 330 bp were monomorphic in two isolates; on the other hand, camel and local sheep isolates were characterized by a single band for each – 290 and 480 bp, respectively (fig. 5 and table 4).

Fig. 4. PCR result of P10 primer used with parasites isolated from samples of camel (C1–C5) and local sheep (LS1–LS5).

Fig. 5. PCR result of P12 primer used with parasites isolated from samples of camel (C1–C5) and local sheep (LS1–LS5).
Generally, the primer P8 is more clearly differentiating between the camel and local sheep isolates of E. granulosus (discriminating power 0.38), in contrast to the P12 primer, which generated approximately the same bands between the camel and local sheep isolates (table 5). In total, 20 monomorphic fragments were encountered in all primers (except P8). The lowest molecular-sized band was produced in camel and local sheep isolates (150 and 180 bp) by primers AD4 and P8, respectively (table 4).
Table 5. Average number of shared bands, similarity coefficient and genetic difference within individuals from the same/two isolates.

Concerning the SCs, the highest SC was among individuals of local sheep isolate (mean SC = 84.77%). On the other hand, the mean range of SCs between the camel and local sheep isolates was 47.2% (table 5).
PCR assay and SSCP of cox1 and mitochondrial 12S rRNA genes
Cox1 and mitochondrial 12S rRNA genes were subjected to PCR analysis on camel and local sheep isolates (two samples for each). In both host isolates, amplification of 12S rRNA genes produced a fragment of approximately 250 bp. The amplification of cox1 genes, by contrast, showed 450–500 fragments. Although there was no variation in the size among the PCR products of mitochondrial 12S rRNA genes on agarose gel in both present isolates, SSCP analysis revealed distinct profiles for this gene between the two different E. granulosus isolates (fig. 6). For individual samples, 2–4 single-strand bands were resolved per lane. Multiple bands were observed because of the secondary tertiary conformation. In the camel and local sheep isolates, the most polymorphic loci were observed in the 12S rRNA gene with four alleles. This indicates an intraspecific variation in E. granulosus of the camels and local sheep. In the cox1 gene, one allele was observed (fig. 7) in both the camel and local sheep isolates.

Fig. 6. Representative PCR-SSCP assay of mitochondrial 12S rRNA genes PCR amplified. Each PCR product was denatured and loaded in a different lane of a polyacrylamide gel. Abbreviations: SS, single-strand DNA; DS, double-strand DNA. C1, C2 and LS2 heterozygote, while LS1 homozygote.

Fig. 7. PCR-SSCP assay of cox1 PCR amplified. Each PCR product was denatured and loaded in a different lane of a polyacrylamide gel. Abbreviations: SS, single-strand DNA; DS, double-strand DNA.
Sequence polymorphism in cox1 gene
The cox1 sequences showed 100% identity to published sequences of the G1–G3 complex derived from human hosts. The alignment of the cox1 gene sequence of local sheep isolates showed the highest similarity with E. granulosus isolate IR.HM40 (cox1) gene (KF612376.1) collected from humans in Iran (direct submission), while the sequence of the cox1 gene in the camel isolates revealed the highest similarity with the EDR1 (cox1) gene (HQ717148.1) collected from humans in Turkey (Eryildiz & Sakru, Reference Eryildiz and Sakru2012).
Alignment between the examined cox1 gene sequences of the local sheep and camel by Blast® software showed six sites of nucleotide variations: two deletion sites in the cox1 gene of local sheep at positions 411 and 416, and four nucleotide substitutions (n = 2, A-T; A-G and T-C) at positions 380, 408, 409 and 70, respectively.
Camel isolates
The multiple sequence alignment of camel samples with those of the referenced genotypes G1, G2 and G3 is shown in fig. 8. The camel isolates show two nucleotide substitutions (C to T and T to A at positions 70 and 380, respectively) corresponding to the G1 genotype, two nucleotide substitutions (T to C and C to T at positions 80 and 271, respectively) corresponding to the G2 genotype and three nucleotide substitutions (n = 2; C to T and T to C at positions 70, 271 and 80, respectively) corresponding to the G3 genotype.

Fig. 8. Multiple alignment of partial cox1 gene sequence of Echinococcus granulosus from camel with reference G1–G3 genotypes.
Local sheep isolates
The multiple sequence alignment of sheep samples with reference genotypes G1, G2 and G3 is shown in fig. 9. Sheep isolates show one nucleotide deletion at position 28 corresponding to genotypes G1, G2 and G3, as well as three nucleotide substitutions (n = 2; T to C and C to T at positions 67, 77 and 268, respectively) corresponding to the G2 genotype and two nucleotide substitutions (T to C and C to T at positions 77 and 268, respectively) corresponding to the G3 genotype. The results of the phylogenetic tree revealed that the camel and local sheep isolates were grouped in a clade with the cryptic species E. granulosus s.s., with bootstrap support of 100% (fig. 10). Table 6 shows the lowest genetic distance between the sheep isolate and G3 genotype, while the camel isolate was genetically the nearest to the G2 genotype. Unique nucleotide sequences produced in this study were deposited in GenBank under accession numbers MN720281 and MN720282 for the cox1 gene sequences of camel and sheep isolates, respectively.

Fig. 9. Multiple alignment of partial cox1 gene sequence of Echinococcus granulosus from local sheep with reference G1–G3 genotypes.

Fig. 10. Phylogenetic tree inferred from cox1 genes of camel, local sheep isolates and reference sequences obtained from GenBank (based on the maximum-likelihood method).
Table 6. Genetic distance matrix among the camel, sheep isolates and some published genotypes G1, G2 and G3, based on maximum composite likelihood.

Discussion
Rostellar hook morphology is still considered to be a valid criterion for differentiating E. granulosus isolates/strains (Gordo & Bandera, Reference Gordo and Bandera1997; Harandi et al., Reference Harandi, Hobbs, Adams, Mobedi, Morgan-Ryan and Thompson2002; Tashani et al., Reference Tashani, Zhang, Boufana, Jegi and McManus2002; Ahmadi, Reference Ahmadi2004; Ahmadi et al., Reference Ahmadi, Dalimi and Ahmadi2006; Thompson et al., Reference Thompson, Boxell, Ralston, Constantine, Hobbs, Shury and Olson2006, Almeida et al., Reference Almeida, Rodrigues-Silva and Neves2007), although its usefulness for this purpose has been questioned (Sweatman & Williams, Reference Sweatman and Williams1963; Hobbs et al., Reference Hobbs, Lymbery and Thompson1990; Turcekova et al., Reference Turcekova, Snabel, D'Amelio, Busi and Dubinsky2003; Ahmadi, Reference Ahmadi2004; Tang et al., Reference Tang, Quian, Kang, Cui, Lu, Shu, Wang and Tang2004; Hussain et al., Reference Hussain, Maqbool, Tanveer and Anees2005; Yildiz & Gurcan, Reference Yildiz and Gurcan2009). In this study, although the number of hooks in E. granulosus of the camel isolate was approximately similar to that of the local sheep isolate, the total length, blade and blade/guard lengths were the most variable characters. These morphometric variations could be attributed to the difference in host specificity (Lubinsky, Reference Lubinsky1962; Sweatman & Williams, Reference Sweatman and Williams1963, Hobbs et al., Reference Hobbs, Lymbery and Thompson1990). The validity of rostellar morphometric analysis for strain differentiation of E. granulosus can be accepted if supported by other molecular data (Mariaux, Reference Mariaux1996). Many authors reported the importance of the different molecular techniques (Isozymes, protein analysis and DNA sequencing) as useful tools in differentiation among different strains of E. granulosus (Thompson, Reference Thompson, Thompson and Lymbery1995; Harandi et al., Reference Harandi, Hobbs, Adams, Mobedi, Morgan-Ryan and Thompson2002).
Previously, molecular techniques were used to confirm the presence and reveal the host preferences of sheep (G1 genotype) and camel (G6 genotype) strains (Zhang et al., Reference Zhang, Eslami, Hosseini and McManus1998; Harandi et al., Reference Harandi, Hobbs, Adams, Mobedi, Morgan-Ryan and Thompson2002; Ahmadi et al., Reference Ahmadi, Dalimi and Ahmadi2006; Rahimi et al., Reference Rahimi, Kia, Mirhendi, Talebi, Fasihi-Harandi, Jalali-zand and Rokni2007); therefore, RAPD-PCR analysis has been used in the present study to genetically discriminate among ten samples of E. granulosus recovered from camels and local sheep (five from each) using five arbitrary primers. Heterogeneity was investigated between two isolates from different host species.
Genetic variations have been demonstrated among different hydatid cysts of the same host species (Lymbery & Thompson, Reference Lymbery and Thompson1989; Irshadullah & Nizami, Reference Irshadullah and Nizami1997; Ahmad et al., Reference Ahmad, Nizami and Saifullah2001; Gholami et al., Reference Gholami, Irshadullah and Khan2009). In the present study, five arbitrary primers indicated more intraspecific variability among individuals of E. granulosus s.s. in the camel isolates (less SC) if compared with that of the individuals in the local sheep isolates. This finding agrees with an Egyptian study (Taha, Reference Taha2012), with a SC 92% and 87.5% in sheep and camel isolates, respectively; likewise, the SC between camel/sheep isolates in the Egyptian study was approximately equal to that of the present study: 33–45% and 47.2%, respectively.
The differences in the specific amplification of DNA fragments within camel or sheep isolates ensures the presence of heterogeneity in the examined genotype (E. granulosus s.s.).
In the RAPD-PCR results, primer P8 yielded band patterns that revealed a high degree of divergence between the camel and local sheep isolates. In other studies (Bhattacharya et al., Reference Bhattacharya, Bera, Bera, Pan and Das2008), primers OPI-01 and OPI-15 were suitable for differentiating Indian sheep, cattle and buffalo isolates (Taha, Reference Taha2012), and primers P1, P3 and OPH04 for differentiating sheep, camel, pig and donkey isolates.
Haag et al. (Reference Haag, Araujo, Gottstein, Siles-Lucas, Thompson and Zaha1999) demonstrated that PCR-linked SSCP provides a method to display variation between E. granulosus s.l. In this study, the heterogeneity within E. granulosus isolated from camels and local sheep was evaluated by SSCP results for PCR assay of both the 12S rRNA and cox1 genes, which indicate intraspecific variations in the 12S rRNA gene only. Simsek et al. (Reference Simsek, Balkaya, Ciftci and Utuk2011) estimated the 12S rRNA gene as a tool to differentiate between the genotypes of E. granulosus identified based on the characteristic of SSCP profiles; furthermore, they showed that PCR-SSCP of the cox1 gene failed in identifying the G1–G3 complex in sheep and cattle isolates and likewise, Zhang et al. (Reference Zhang, Gasser, Zhu and McManus1990) and Oudni-M'rad et al. (Reference Oudni-M'rad, Cabaret and M'rad2006). Moreover, in our findings, the 12S rRNA gene seems to show various PCR-SSCP patterns (intraspecific variation) within each isolate in both camel and local sheep. These findings support the fact that SSCP can distinguish PCR-amplified ribosomal DNA fragments, which differ by a single nucleotide (Zhu et al., Reference Zhu, Jacobs, Chilton, Sani, Cheng and Gasser1998).
Another study (Gasser et al., Reference Gasser, Zhu and McManus1998) indicates that about 75% to 100% of point mutations can be detected by PCR-SSCP over sequence lengths of 100–200 bp, but the mutation detection rate may decrease for sequences longer than 200 bp. Consequently, the heterogeneity between the present cox1 gene sequences of the local sheep and camels (450–500 bp) cannot be detected by PCR-SSCP (although the alignment in between showed six sites of nucleotides variations). It may be possible that using more long fragments of the cox1 gene with more genetic variation yields obvious differential patterns of PCR-SSCP.
Currently, E. granulosus s.l. form five valid species (E. granulosus s.s., E. felidis, E. equinus, E. ortleppi and E. canadensis) (Nakao et al., Reference Nakao, McManus, Schantz, Craig and Ito2007, Reference Nakao, Lavikainen, Yanagida and Ito2013). The present phylogenetic tree constructed using the cox1 sequence data of KSA isolates with reference sequences showed that the local sheep and camels isolates (Al-Madinah livestock) identified as E. granulosus s.s. (G1–G3 complex), which comprise a deeply related complex that is distinct from other genotypes (G4–G10), as previously described by other studies (Nakao et al., Reference Nakao, Lavikainen, Yanagida and Ito2013).
This result agrees with a Saudi study (Metwally et al., Reference Metwally, Qassim, Al-Turaiki, Almeer and El-Khadragy2018), which reported that the sequencing of the cox1 gene revealed the presence of cryptic species (G1–G3) in 16 of 17 sheep cysts and two of 27 camel cysts in Riyadh, KSA. Accordingly, the G1–G3 cryptic species are the most prevalent among animal isolates in KSA. This finding is similar to those of studies carried out in Iran, suggesting that G1–G3 remain the most prevalent E. granulosus genotypes in livestock (Nejad et al. Reference Nejad, Taghipour, Nochi, Mojarad, Mohebbi and Harandi2012; Pezeshki et al., Reference Pezeshki, Akhlaghi, Sharbatkhori, Razmjou, Oormazdi and Mohebali2013; Nikmanesh et al., Reference Nikmanesh, Mirhendi, Ghalavand, Alebouyeh and Sharbatkhori2014).
Conclusion
The present study enforces the relentless attempts to establish the exact haplotypes/genotypes of E. granulosus s.l. present in KSA livestock. Consequently, additional isolates from other hosts, such as humans, cattle, goats and stray canines, and other geographic areas may be necessary to increase our understanding of the epidemiological distribution of cystic echinococcosis in KSA especially, where thousands of sheep and camels are slaughtered during the Hajj season and festival events. Moreover, for a more precise identification of E. granulosus s.s., applying sequential, different molecular protocols that depend somewhat on one or more long-sequenced genes in the nuclear genome rather than the short-sequenced parts of genes in the mitochondrial genome has been recommended, alongside additional information concerning biological characteristics (host affinities, morphology).
Financial support
This research received no specific grant from any funding agencies in the public, commercial or not-for-profit sectors.
Conflicts of interest
None.
Ethical standards
This study was approved by the Institutional Committee of the Post-Graduate Studies and Research at Taibah University, KSA. Cystic samples were obtained from slaughtered camels and sheep, during post-mortem inspection by veterinary officers at Al-Madinah Abattoir, KSA. Formal agreement and permission for study usage of hydatid cysts were obtained from both the university and abattoir veterinarians. No experiment was conducted on live animals.
Author contributions
N.M. AL-Mutairi: data curation, investigation, methodology, validation, writing (original draft). H.A. Taha: conceptualization, formal analysis, methodology, project administration, supervision, validation, writing (review and editing). A.H. Nigm: data curation, formal analysis, investigation, software, validation, writing (original draft), writing (review and editing).


