Introduction
The spatio-temporal distribution of parasites among hosts is a fundamental and dynamic aspect of host–parasite interactions (Shaw & Dobson, Reference Shaw and Dobson1995; Poulin, Reference Poulin2007a; Morand & Krasnov, Reference Morand and Krasnov2008; Poulin et al., Reference Poulin, Krasnov and Mouillot2011). Heterogeneity in parasite distribution within and among host species commonly expresses as over-dispersion (or aggregation), a pattern reported in a diversity of host–parasite systems (Shaw & Dobson, Reference Shaw and Dobson1995; Wilson et al., Reference Wilson, Bjørnstad, Dobson, Merler, Poglayen, Randolph, Read, Skorping, Hudson, Rizzoli, Grenfell, Heesterbeek and Dobson2002; Morand & Krasnov, Reference Morand and Krasnov2008). Aggregated parasite distribution mainly arises by chance, due to random variations associated with parasite encounter and successful establishment (Poulin, Reference Poulin2013; Gourbière et al., Reference Gourbière, Morand and Waxman2015). The level of intra- and interspecific parasite aggregation among hosts is also expected to fluctuate with non-random variation in exposure rate and infection success (i.e. the probability of encounter and host–parasite compatibility) (Anderson & Gordon, Reference Anderson and Gordon1982; Shaw & Dobson, Reference Shaw and Dobson1995; Wilson et al., Reference Wilson, Bjørnstad, Dobson, Merler, Poglayen, Randolph, Read, Skorping, Hudson, Rizzoli, Grenfell, Heesterbeek and Dobson2002; Poulin, Reference Poulin2007a, Reference Poulinb; Pérez-del-Olmo et al., Reference Pérez-del-Olmo, Morand, Raga and Kostadinova2011; Poulin, Reference Poulin2013; Gourbière et al., Reference Gourbière, Morand and Waxman2015; Johnson & Wilber, Reference Johnson and Wilber2017). Such heterogeneity is associated with host and parasite specific features, from individual to species level. For instance, variation in encounter probability may arise from spatio-temporal differences in foraging strategies or habitat preferences among hosts, or from differences in parasite-induced alterations of host behaviour that modulate transmission success. Variations in the rate of infection success may arise from differences in host physiological defence systems, and in parasite exploitation or evasion strategies. Parasite species-specific features, such as life cycle (direct or complex) and transmission mode (e.g. passive, active or trophic; Shaw & Dobson Reference Shaw and Dobson1995; Wilson et al., Reference Wilson, Bjørnstad, Dobson, Merler, Poglayen, Randolph, Read, Skorping, Hudson, Rizzoli, Grenfell, Heesterbeek and Dobson2002; Poulin, Reference Poulin2007a), also determine parasite distribution among hosts.
Parasites with complex (i.e. heteroxenous) life cycles and trophic transmission rely on the consumption of infected intermediate or paratenic hosts by suitable definitive hosts, to complete their life cycle. They are expected to accumulate in definitive hosts, especially those occupying higher trophic levels, as these hosts are likely to consume large numbers of infected intermediate host prey (Shaw & Dobson, Reference Shaw and Dobson1995; Pérez-del-Olmo et al., Reference Pérez-del-Olmo, Morand, Raga and Kostadinova2011; Lester & McVinish, Reference Lester and McVinish2016). At the intraspecific level, they may also accumulate with predator size and age, as prey uptake increases with predator body size. This should be especially true for parasites with a prolonged use of their host for growth and reproduction, unless intensity-dependent regulation occurs.
In this context, acanthocephalan parasites offer interesting features to test these predictions (Kennedy, Reference Kennedy2006). They have a two-host life cycle involving arthropods as intermediate hosts and vertebrates as definitive hosts, occasionally incorporating paratenic hosts (Crompton & Nickol, Reference Crompton and Nickol1985; Kennedy, Reference Kennedy2006; Médoc et al., Reference Médoc, Rigaud, Motreuil, Perrot-Minnot and Bollache2011). Arthropods become infected when accidentally consuming eggs. In the intermediate host, the parasite grows and then enters its last developmental stage (cystacanth), waiting for trophic transmission to the definitive host. Upon predation of the intermediate host by the appropriate vertebrate definitive host, further growth, sexual maturation and reproduction take place, and eggs are released with host faeces (Crompton & Nickol, Reference Crompton and Nickol1985). Acanthocephalans have a prolonged use of their vertebrate hosts for growth, sexual maturation and continuous reproduction (Crompton & Nickol, Reference Crompton and Nickol1985). Accumulation of intestinal parasites is thus expected to occur over time, although intensity-dependent regulation of parasite infra-population within individual hosts may limit parasite accumulation. In addition to heterogeneity in spatial distribution, abundance of adult acanthocephalans may also show marked seasonal variations (Crompton & Nickol, Reference Crompton and Nickol1985; Dudiňák and Špakulová, Reference Dudiňák and Špakulová2003; Kennedy, Reference Kennedy2006).
The goal of this study was precisely to address the distribution of the acanthocephalan parasite of freshwater fish, Pomphorhynchus laevis sensu lato (s.l.) (sensu Amin et al., Reference Amin, Abdullah and Mhaisen2003), within local fish communities. Previous records of P. laevis s.l. suggest a broad range of fresh and brackish water fish species as definitive hosts and amphipods as intermediate hosts across the Western Palaearctic area (Kennedy, Reference Kennedy2006; Špakulová et al., Reference Špakulová, Perrot-Minnot and Neuhaus2011; Vardić Smrzlić et al., Reference Vardić Smrzlić, Valić, Kapetanović, Filipović Marijić, Gjurčević and Teskeredžić2015; Perrot-Minnot et al., Reference Perrot-Minnot, Špakulová, Wattier, Kotlík, Düşen, Aydoğdu and Tougard2018), but also at local scales (Perrot-Minnot et al., Reference Perrot-Minnot, Guyonnet, Bollache and Lagrue2019). Instead of comparing distribution patterns among host–parasite systems (Morand & Krasnov, Reference Morand and Krasnov2008) or among populations within a given host–parasite system (Rodríguez & Valdivia, Reference Rodríguez and Valdivia2017), we focused on inter-host heterogeneity in parasite distribution at a local scale. We considered the assemblage of local fish species as resource patches structuring the parasite population into infra-populations. Specifically, we assessed parasite distribution across a local range of fish species, and its consequence on fish health. We aimed at answering the following questions. (1) Are the patterns of mean abundance and aggregation of P. laevis s.l. within local fish host community assemblages consistent with some general macroecological laws? We predicted that mean parasite abundance should be positively correlated to prevalence (Morand & Krasnov, Reference Morand and Krasnov2008), that parasite abundance should vary with fish age (Anderson & Gordon, Reference Anderson and Gordon1982), approximated by fish size, and that heterogeneity in Pomphorhynchus distribution within fish host species should be consistent with the general pattern of parasite aggregation (Shaw & Dobson, Reference Shaw and Dobson1995; Wilson et al., Reference Wilson, Bjørnstad, Dobson, Merler, Poglayen, Randolph, Read, Skorping, Hudson, Rizzoli, Grenfell, Heesterbeek and Dobson2002; Morand & Krasnov, Reference Morand and Krasnov2008). (2) Is variation in mean parasite abundance among fish species related to local fish biomass density, or density (Arneberg et al., Reference Arneberg, Skorping, Grenfell and Read1998, Arneberg, Reference Arneberg2001; Poulin, Reference Poulin2007a; Buck & Lutterschmidt, Reference Buck and Lutterschmidt2017)? This prediction holds if the encounter rate of infected intermediate host prey with a given predator species increases with predator density, with little effect of other fish-specific features such as differences in diet or compatibility towards P. laevis s.l. (3) Is variation in aggregation levels among fish species related to fish density? We expect a positive association between parasite aggregation levels and fish density or biomass density across fish species, as suggested in previous studies, but also across host populations for a given host–parasite system (Johnson & Wilber, Reference Johnson and Wilber2017; Rodríguez & Valdivia, Reference Rodríguez and Valdivia2017). (4) Is there evidence for negative effects of infection on fish condition?
We documented the pattern of host use by P. laevis s.l. in two rivers, using standard infection parameters (Shaw & Dobson, Reference Shaw and Dobson1995; Morand & Krasnov, Reference Morand and Krasnov2008). We conducted standard analysis of abundance and distribution of P. laevis s.l. within the fish host network, using abundance–prevalence and abundance–variance relationships (Morand & Krasnov, Reference Morand and Krasnov2008). The abundance–occupancy relationship is a general pattern in free-living species (Gaston et al., Reference Gaston, Blackburn, Greenwood, Gregory, Quinn and Lawton2000) and in parasites (Morand & Krasnov, Reference Morand and Krasnov2008). At the intraspecific level, abundance–occupancy relationship is expected to be driven by temporal variations in resource availability (Gaston et al., Reference Gaston, Blackburn, Greenwood, Gregory, Quinn and Lawton2000). For a given parasite species, variations in resource availability may arise within the community of host species (Morand & Krasnov, Reference Morand and Krasnov2008), driven by relative host density or biomass density. We estimated P. laevis s.l. aggregation among fish host species using the abundance–variance relationship, known as Taylor's power law (Anderson & Gordon, Reference Anderson and Gordon1982; Shaw & Dobson, Reference Shaw and Dobson1995; Kilpatrick & Ives, Reference Kilpatrick and Ives2003; Morand & Krasnov, Reference Morand and Krasnov2008; Johnson & Hoverman, Reference Johnson and Hoverman2014). Finally, we assessed the potential effects of P. laevis s.l. infection on fish health, by estimating three standard body-condition metrics: body condition index (BCI), hepatosomatic index (HSI, related to energy storage) and gonadosomatic index (GSI, reflecting reproductive investment) (Chellappa et al., Reference Chellappa, Huntingford, Strang and Thomson1995). These metrics are commonly used to assess the impact of pollutants (Dragun et al., Reference Dragun, Filipović Marijić and Kapetanović2013), infection (Tierney et al., Reference Tierney, Huntingford and Crompton1996; Masson et al., Reference Masson, Vanacker, Fox and Beisel2015; Kalogianni et al., Reference Kalogianni, Kmentová, Harris, Zimmerman, Giakoumi, Chatzinikolaou and Vanhove2017) and habitat quality (Nagrodski et al., Reference Nagrodski, Suski and Cooke2013) in fish.
Material and methods
Localities, fish community composition and sampling
One locality on the River Ouche (47°17′54.56″N, 5°2′21.97″E) and one locality on the River Vingeanne (47°20′51.66″N, 5°27′8.76″E) were sampled in 2003 and 2005, and in 2004 and 2005, respectively. To avoid incorporating seasonal variation in prevalence and abundance to the analysis of P. laevis s.l. distribution, we collected samples at the same time of year (late spring/early summer). We retrieved information on the composition of local fish communities in these two localities from the ONEMA database (http://www.naiades.eaufrance.fr/acces-donnees#/hydrobiologie), based on the regular monitoring of fish species richness and abundance between 2001 and 2006. The database provides a full record of density and biomass density of each fish species locally present. Thirty fish species were identified, of which 14 were present in both localities (supplementary fig. S1 in Perrot-Minnot et al., Reference Perrot-Minnot, Guyonnet, Bollache and Lagrue2019).
Fish were captured by electric fishing or netting, killed immediately, identified, measured (fork length) and weighed. Upon fish dissection, we removed, opened and screened intestines to collect adult P. laevis s.l. Since the occurrence of paratenic hosts or dead-end hosts has been previously reported for P. laevis s.l. (Crompton & Nickol, Reference Crompton and Nickol1985), we also inspected fish body cavity and viscera for extra-intestinal infection with P. laevis s.l. cystacanths. We included in the analyses only fish species for which at least five individuals were dissected. We measured gonad and liver weights on a subset of fish to estimate GSI and HSI.
We did not distinguish Pomphorhynchus tereticollis and P. laevis in the present study, despite the recent taxonomic revision of P. laevis s.l. (sensu Amin et al. Reference Amin, Abdullah and Mhaisen2003) and the erection of P. tereticollis as a true species (Špakulová et al., Reference Špakulová, Perrot-Minnot and Neuhaus2011). Both species are present in the two localities sampled here, but they share the same amphipod intermediate hosts and fish definitive host species. Although they seem to exhibit some specificity towards fish final hosts in terms of relative abundance rather than presence/absence (Perrot-Minnot et al., Reference Perrot-Minnot, Guyonnet, Bollache and Lagrue2019), a preliminary analysis suggested that both Pomphorhynchus species exhibited comparable levels of aggregation among fish host. This subset of 815 Pomphorhynchus spp. required genotyping for identification, and was not large enough to quantify reliably parasite distribution pattern among all fish species for each Pomphorhynchus species. In fact, 2005 Pomphorhynchus that were not genotyped, and 268 additional individual fish (including non-infected ones), were added to the dataset used to run the present analysis.
Infection pattern of P. laevis s.l.: prevalence, abundance and aggregation across fish host species
We used multiple descriptors to characterize P. laevis s.l. infection patterns in each fish species (Bush et al., Reference Bush, Lootvoet, Lotz and Shostak1997): prevalence (i.e. proportion of individual hosts infected), abundance (i.e. mean number of parasites per host) and intensity (i.e. mean number of parasites per infected host). We estimated P. laevis s.l. prevalence and intensity for two non-exclusive categories of individual host: fish infected with intestinal adult P. laevis s.l. and fish harbouring cystacanths in the body cavity and in viscera. We performed the analysis of P. laevis s.l. abundance and aggregation only on intestinal adult parasites, since we considered the distribution pattern of parasites among hosts in relation to population stability. Indeed, the contribution of extra-intestinal parasites to the parasite life cycle and population dynamics is unclear, as it may depend on the host species considered (i.e. some may act as paratenic hosts, given their inclusion into the diet of piscivorous fish, while others are dead-end hosts, such as minnow and catfish, respectively) (Médoc et al., Reference Médoc, Rigaud, Motreuil, Perrot-Minnot and Bollache2011; Perrot-Minnot et al., Reference Perrot-Minnot, Guyonnet, Bollache and Lagrue2019).
We computed the distribution of P. laevis abundance for each fish species within each river, to illustrate its distribution pattern among individual fish for each fish species. We tested the relationship between P. laevis s.l. abundance (log10 + 1 transformation) and individual body size using linear regression.
We estimated the degree of aggregation of intestinal adult P. laevis s.l. within fish species using the slope of the regression of variance in parasite abundance to mean parasite abundance (both log10-tranformed), known as Taylor's power law, among fish species. To get close to the sample size recommended (>30; Shaw & Dobson, Reference Shaw and Dobson1995; Poulin, Reference Poulin2013), we removed fish species for which less than 25 individuals were sampled, and ran the analysis on data from the River Ouche only (N = 9 species of fish). Departure from random distribution of parasites towards aggregation among fish hosts would be evidenced by a slope greater than one (Morand & Krasnov, Reference Morand and Krasnov2008; Johnson & Hoverman, Reference Johnson and Hoverman2014).
The variance-to-mean ratio was then used as a measure of aggregation level, in preference to the other commonly used parameter k (Morand & Krasnov, Reference Morand and Krasnov2008), because we compared parasite distribution patterns among fish species differing in P. laevis s.l. prevalence (and for some of them, with a large number of uninfected hosts) (Wilson et al., Reference Wilson, Bjørnstad, Dobson, Merler, Poglayen, Randolph, Read, Skorping, Hudson, Rizzoli, Grenfell, Heesterbeek and Dobson2002). We used the variance-to-mean ratio to test for a relationship between aggregation level and fish biomass, across the range of fish species.
Fish condition in relationship to P. laevis s.l. abundance
Variations in fish (BCI, HSI and GSI) were analysed in relation to intestinal P. laevis s.l. abundance, fish species and sex. Only fish species and sex for which at least 12 individuals were screened and two infected were included in the analyses. Some individual fish could not be sexed and were included as ‘juveniles’. We measured fish BCI as the residuals of the regression of log10-transformed whole-body mass on log10-transformed body size (fork length) (Chellappa et al., Reference Chellappa, Huntingford, Strang and Thomson1995). Since the relationship was significantly different among fish species, the residuals were estimated for each fish species separately. Hepatosomatic and gonadosomatic indices were calculated as the ratio of liver weight and gonad weight on body mass, respectively (Chellappa et al., Reference Chellappa, Huntingford, Strang and Thomson1995)
Data analysis
All statistical analyses were performed using R software v. 3.5.1. and v. 3.6.1. (R Core team, 2018). Within each fish species, the relationship between P. laevis s.l. abundance (log10 + 1 transformation) and individual body size was tested using linear regression. We also computed the 95% confidence intervals (CIs) around prevalence using PropCIs package v. 0.3.0 (Scherer, Reference Scherer2018).
We ran linear and generalized linear models (GLM) to analyse prevalence and abundance, and performed model comparison to estimate the contribution of each predictor variable to variation in the dependant variable. The approach is based on deviance comparison between models fitted to the same data – the full model and the model without one predictor variable (maximum likelihood ratio test) using R package ‘lmtest’ v. 0.9–36 (Zeileis & Hothorn, Reference Zeileis and Hothorn2002). We used the associated Chi-square value and probability to assess the significance of each predictor variable. We also reported the coefficient of determination R 2, as an estimate of how well variation in the dependant variable is explained by predictor ones. As we included locality as a random factor; we computed both the marginal R 2m and the conditional R 2c, which represents the part of the variance explained by fixed effects and by the entire model respectively, using R package ‘MuMIn’ v. 1.42.1 (Barton, Reference Barton2018). We analysed differences in prevalence and abundance according to fish species using GLM with binomial distribution, and GLM with negative binomial link function, respectively, adding locality as a random factor (package Lme4 v. 1.1.19, Bates et al., Reference Bates, Maechler, Bolker and Walker2015; and package MASS v. 7.3.51, Venables & Ripley, Reference Venables and Ripley2002, respectively). We compared parasite intensity among fish species within each locality using a Kruskal–Wallis test and post-hoc paired comparisons (Dunn test, Benjamini–Yekutieli B–Y method of correction for multiple tests; package ‘Dunn.test’, Dinno, Reference Dinno2015) as the distribution of intensity could not be normalized.
We analysed the relationship between prevalence and mean abundance across the range of fish species using Spearman's rank correlation test. We tested the relationship between mean P. laevis s.l. abundance and fish density or biomass density across the range of fish species using linear regression after log–log transformation (log10), adding locality as a random factor.
We analysed the aggregation of P. laevis s.l. across the nine fish species from the River Ouche for which more than 25 individuals were sampled. We regressed the log10-transformed variance of abundance on the log10-transformed mean abundance, applying a simple linear model. Given the low sample size (nine fish species), we used an ordinal nonparametric bootstrap procedure (1000 replicates) to get the bootstrapped value of the regression slope and its 95% CI (package ‘boot’ v. 1.3–23, Canty & Ripley, Reference Canty and Ripley2019). We then tested for an effect of fish biomass density on the variance-to-mean abundance ratio, using the Spearman rank correlation test.
All three condition parameters – BCI, HSI and GSI – were used as the dependent factor in the linear model (BCI) or GLM with gamma-distribution (HSI, GSI), including parasite abundance (log10-transformed), sex and their interaction, as fixed effects. Fish species and their interaction with parasite abundance were included in the full model for HSI and GSI, while separate analyses of BCI were done for each fish species.
Results
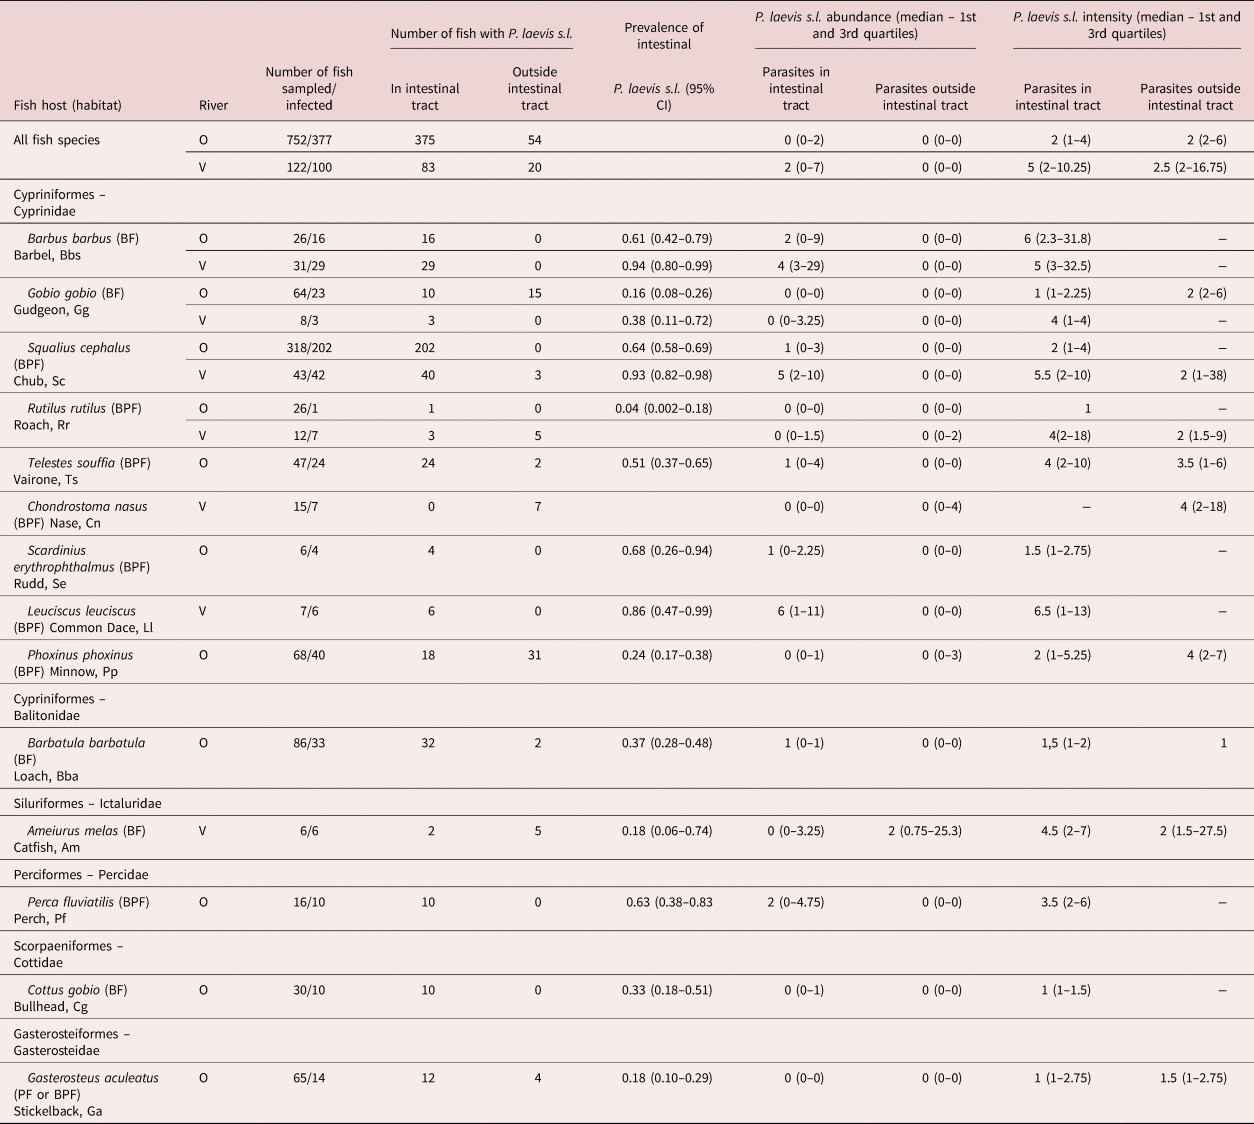
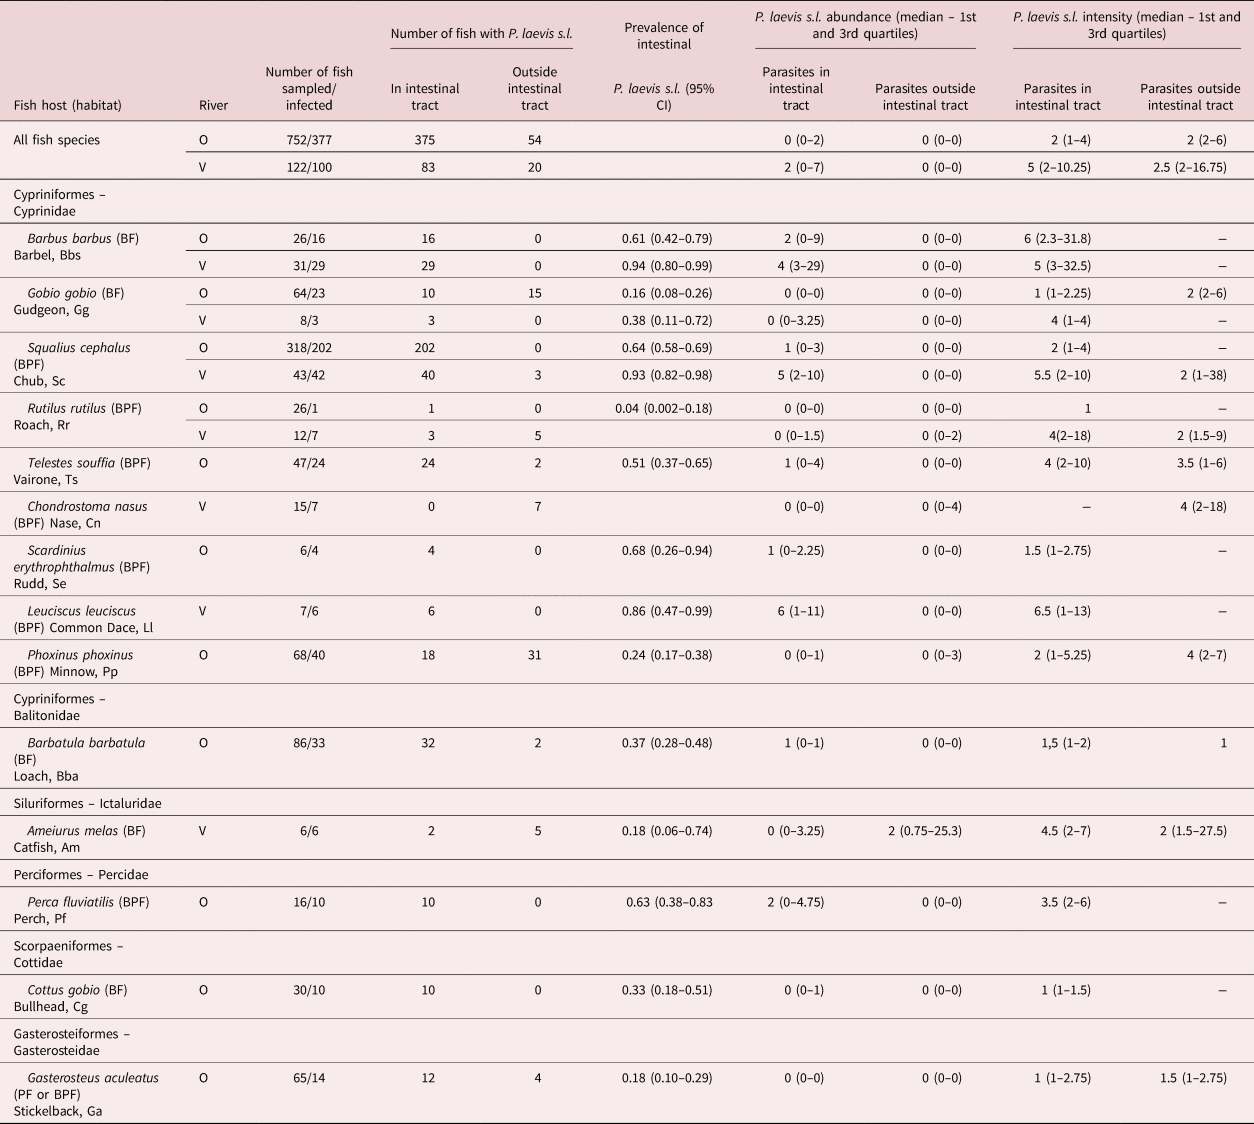
Pomphorhynchus laevis s.l. samples were collected from 14 species of fish, mainly cyprinids, among which four species were collected in both localities (table 1). A total of 881 fish were dissected; 752 from 11 fish species sampled in the River Ouche and 129 from nine fish species sampled in the River Vingeanne. The sampling of each fish species was representative of the local fish community, irrespective of whether the fish species hosted P. laevis s.l. or not (see supplementary table S1 in Perrot-Minnot et al., Reference Perrot-Minnot, Guyonnet, Bollache and Lagrue2019).
Table 1. Abundance and intensity of Pomphorhynchus laevis s.l. parasites in the rivers Ouche (O; years 2003, 2005) and Vingeanne (V; years 2004 and 2005), in fish species for which at least five individuals were sampled (loach excluded for the River Vingeanne). Abundance and intensity were estimated separately for adult parasites in the intestinal track and for immature parasites (cystacanths) found outside of the intestinal track, in viscera or in the body cavity. BF, benthic fish, bottom feeder; BPF, bentho-pelagic fish.
Prevalence and abundance of P. laevis s.l.
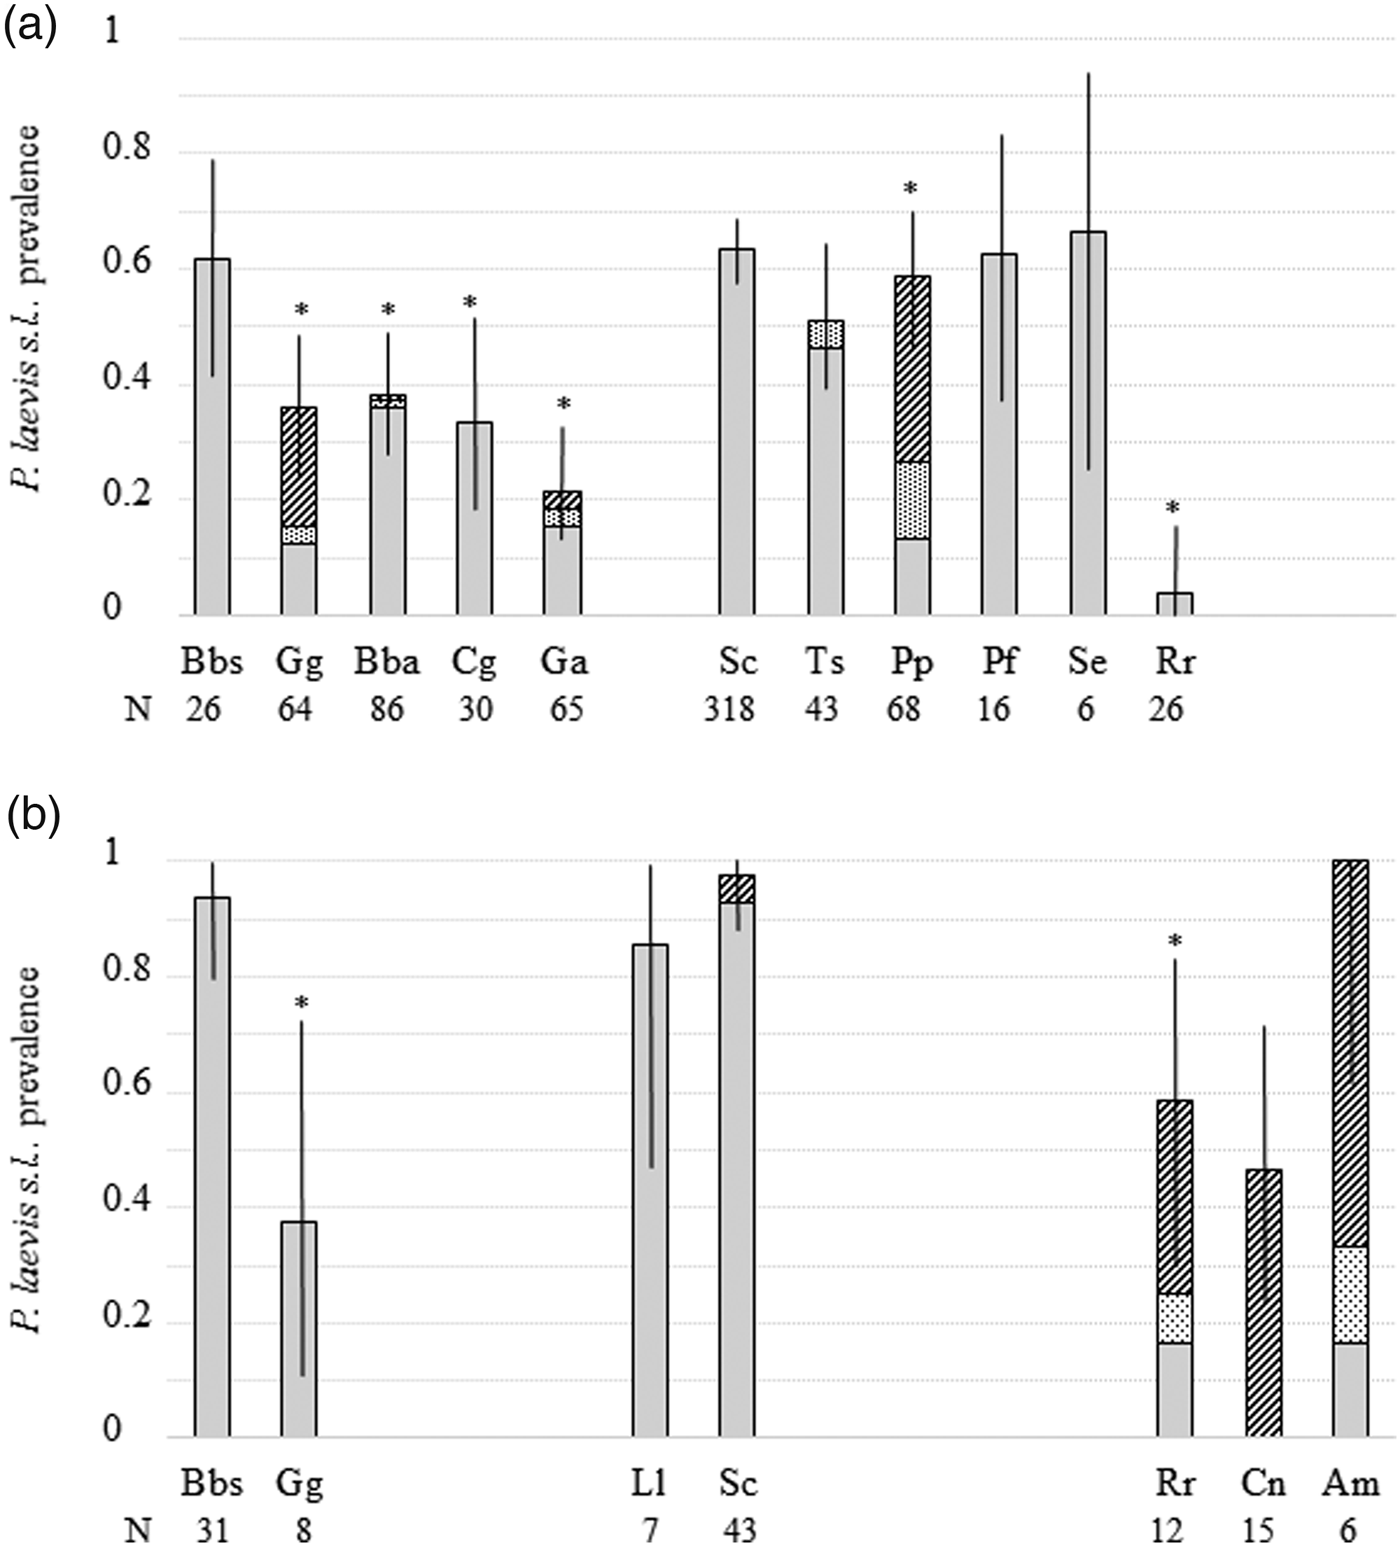
Intestinal P. laevis s.l. were collected from all of the eleven fish species sampled in the River Ouche and from six out of the seven fish species in the River Vingeanne (table 1 and fig. 1). Extra-intestinal P. laevis s.l. cystacanths were found in several species of fish; all but one (Chondrostoma nasus) also harboured intestinal adults (table 1 and fig. 1). Extra-intestinal parasites were either embedded as cystacanths or attached as evaginated cystacanths on the liver and gonad surface or in adipose tissues.

Fig. 1. Prevalence of Pomphorhynchus laevis s.l. in 14 fish species from two rivers. Individual fish were harbouring adult parasites in the intestine exclusively (plain bars); both adult parasites in the intestine and immature parasites (cystacanths) in body cavity or viscera (dotted bars); or exclusively immature parasites (cystacanths) in body cavity or viscera (dashed bars). Total prevalence is represented with its 95% confidence interval. (a) River Ouche; (b) River Vingeanne. N, number of fish sampled. *Significantly lower prevalence of intestinal parasites compared to the other groups of fish species. See table 1 for abbreviations of fish species.
Parasite distribution within each fish species was clearly over-dispersed (supplementary fig. S1). At the intra-host level, P. laevis s.l. abundance (log-transformed) increased significantly with individual fish size in most fish species in both localities, but with a low to medium coefficient of determination (0.07–0.62) (supplementary fig. S2). There was no evidence for a decrease in mean and variance of abundance in the upper-size category, but, rather, a log-linear trend for parasite load to increase with body size (supplementary fig. S2).
Prevalence of intestinal P. laevis s.l. differed among fish species (Chi2 = 171.3, df = 12, P < 0.0001, R 2m = 0.21, R 2c = 0.37), as well as both intestinal and extra-intestinal P. laevis s.l. (Chi2 = 117.9, df = 13, P < 0.0001, R 2m = 0.34, R 2c = 0.49). Half of fish species harboured prevalence above 50% (fig. 1). Infection intensity of intestinal P. laevis s.l. differed among fish species in the River Ouche (Kruskal–Wallis chi-squared = 43.1724, df = 10, P < 0.0001) but not in the River Vingeanne (chi-squared = 2.44, df = 5, P = 0.79) (supplementary fig. S3). There was no effect of sampling effort (number of individual fish sampled per fish species) on prevalence or intensity (Spearman correlation test, samples from both rivers pooled: N = 18; S = 1254, P = 0.24, Rho = −0.29; and S = 11.66, P = 0.15, Rho = 0.66, respectively). The abundance of intestinal P. laevis s.l. differed among fish species (Chi2 = 436.4, df = 12, P < 0.0001, R 2m = 0.38, R 2c = 0.54). Abundance and prevalence were significantly correlated across fish species and localities (Spearman correlation test: N = 17, S = 167.6, P = 0.0001, Rho = 0.79; fig. 2).
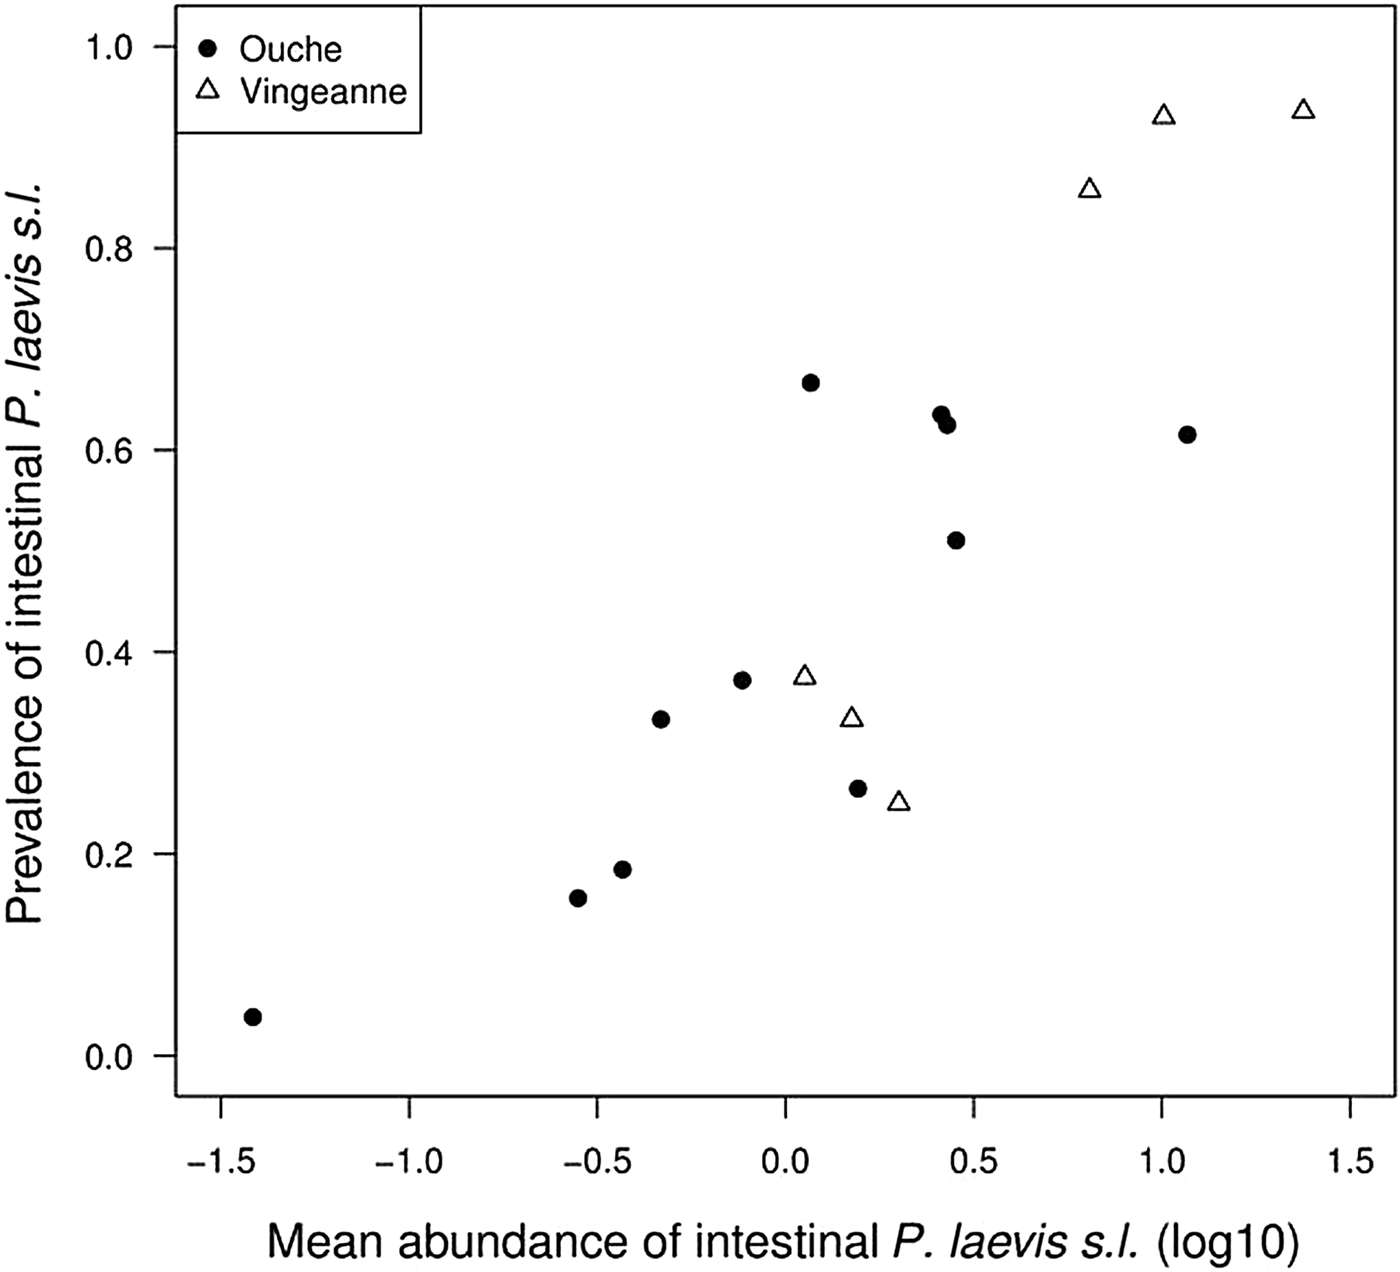
Fig. 2. Relationship between mean abundance and prevalence of intestinal Pomphorhynchus laevis s.l. across fish host species in the Ouche and Vingeanne rivers. This relationship corresponds to the ‘abundance–occupancy’ rule for free-living species.
Are differences in mean abundance among fish hosts explained by local fish biomass?
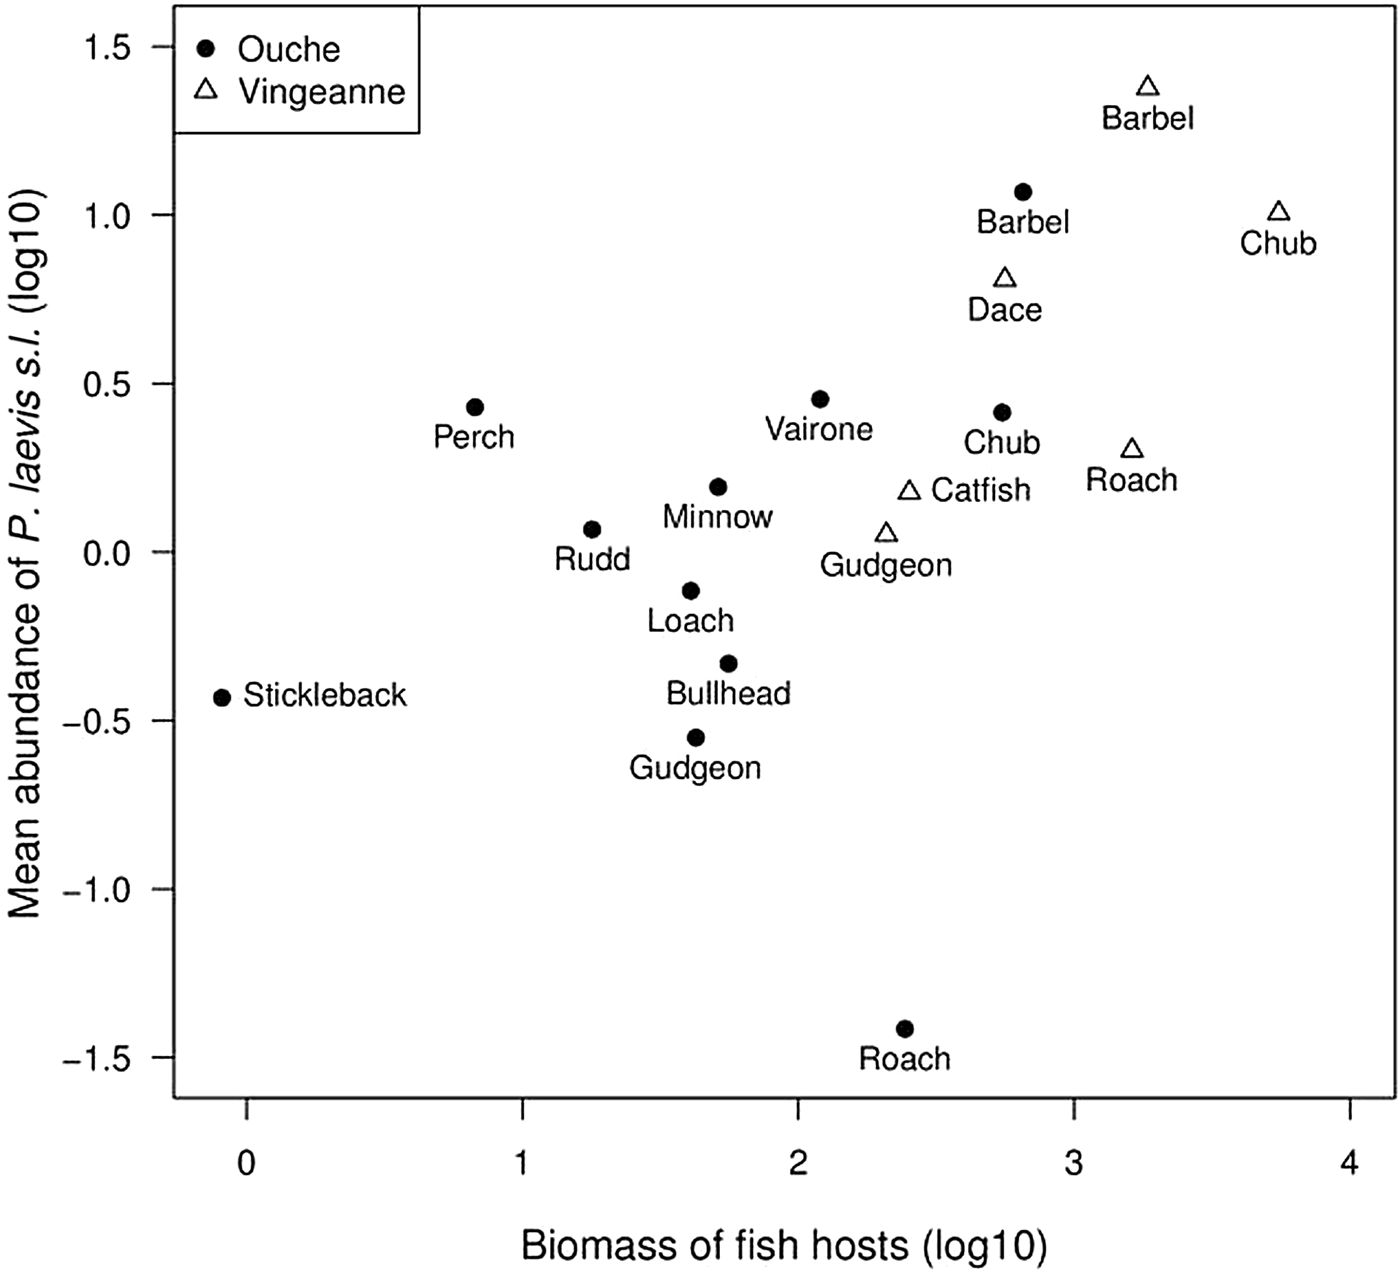
We tested the hypothesis that mean parasite abundance per fish species could be determined by host species abundance. The mean abundance of P. laevis s.l. in fish species was positively correlated with local fish biomass (N = 17; Chi2 = 4.76, df = 1, P = 0.03; R 2m = R 2c = 0.25) (fig. 3), but not with local fish density (Chi2 = 1.53, df = 1, P = 0.22) (supplementary fig. S4). The roach Rutilus rutilus stood as an outlier in the River Ouche but not the River Vingeanne, with a lower mean abundance than expected from its biomass (fig. 3).

Fig. 3. Relationship between local fish biomass (g/100 m−2) and mean abundance of intestinal Pomphorhynchus laevis s.l. per fish species, across fish species and localities (Ouche and Vingeanne rivers).
Aggregation of intestinal P. laevis s.l. across fish species
The level of aggregation of intestinal P. laevis s.l. among fish species was estimated using the relationship between variance in parasite abundance and mean abundance (log 10-transformed) among nine fish species from the River Ouche. Variance in abundance of intestinal parasites among fish species was strongly related to mean abundance, with a slope significantly different from unity, indicative of aggregation relative to random distribution (table 2 and fig. 4). The mean abundance of intestinal P. laevis s.l. explained more than 95% of the variance in abundance.

Fig. 4. Relationship between variance in abundance and mean abundance of intestinal Pomphorhynchus laevis s.l. across fish host species in the River Ouche, on a log scale. Regression analysis was performed using log-transformation. A slope higher than one indicates aggregation.
Table 2. Parameters of a power function (Taylor's power law) fitting the relationship between the logarithms of variance in abundance and mean abundance, across fish species hosts of Pomphorhynchus laevis s.l. from two populations.

Abundance was recorded for adult intestinal parasites. The parameters a and b are from the function Var(A) = a.M(A)b, with the variance in parasite abundance and mean abundance estimated for nine fish species for which at least 25 individuals were collected. The parameter b represents an index of spatial heterogeneity (or aggregation) of parasite distribution across fish species. Goodness of fit is given by the coefficient of determination R 2, and the P-value. The slope (b) is significantly different from unity (F 1, 6 = 24.9, P = 0.002). Bootstrapped values for the slope b and R 2 and their 95% intervals were calculated based on 1000 bootstrap replicates.
The variance-to-mean abundance ratio tended to increase with biomass density, although not significantly (bootstrapped estimate of Spearman rank correlation and its 95% CI: N = 9, Rho = 0.68 (−0.34–0.97)) (supplementary fig. S5).
Effect of infection on fish condition indices
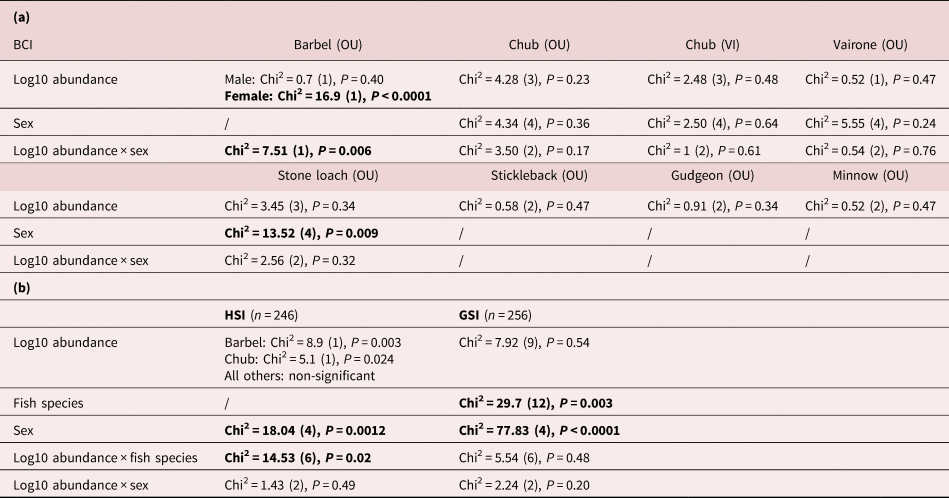
Variations in BCI were not explained by the full model, including parasite abundance, host sex and their interaction as predictors in any of the fish species, except in barbel from the River Ouche (table 3a), where body condition decreased with parasite load in females (supplementary fig. S6).
Table 3. Body condition metrics of fish infected with intestinal Pomphorhynchus laevis s.l. (a) Body condition index (BCI) according to parasite load (log10 abundance), fish sex and their interaction, in the Ouche (OU) and Vingeanne (VI) rivers (see supplementary fig. S6). (b) Hepathosomatic index (HSI) and gonadosomatic index (GSI), according to parasite load (log10 abundance), fish species (barbel and chub) and sex. Statistically significant effects are represented in bold.
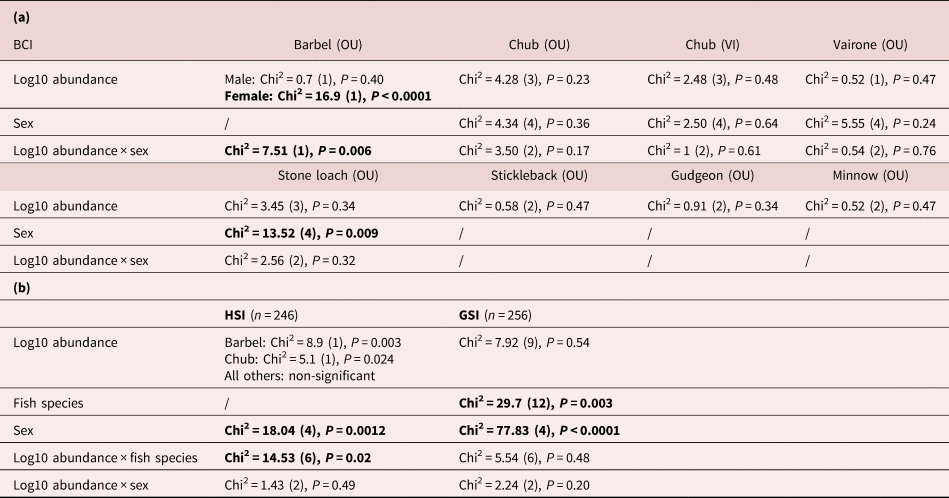
The relationship between HSI and parasite load differed among fish species (table 3b). Interestingly, HSI increased significantly with parasite load in barbel (supplementary fig. S7a); however, HSI increased significantly with body size in the same manner (supplementary fig. S7b). Variations in GSI were independent of parasite load (table 3b). GSI differed according to fish species and sex (supplementary fig. S7c, d), with females exhibiting higher size-corrected weight of gonads compared to males and juveniles (supplementary fig. S7d).
Discussion
Abundance–prevalence relationship and aggregation
The distribution of P. laevis s.l. within most fish species was aggregated, confirming the pattern reported in other acanthocephalan species, both in final hosts (Anderson & Gordon, Reference Anderson and Gordon1982; Dobson & Keymer, Reference Dobson, Keymer, Crompton and Nickol1985; Kennedy, Reference Kennedy2006) and in intermediate hosts (Dobson & Keymer, Reference Dobson, Keymer, Crompton and Nickol1985; Rodríguez & Valdivia, Reference Rodríguez and Valdivia2017), and, more generally, in macroparasites (Shaw & Dobson, Reference Shaw and Dobson1995; Poulin, Reference Poulin2007a; Morand & Krasnov, Reference Morand and Krasnov2008).
The more abundant P. laevis s.l. was in a given host species, the higher was its prevalence, in both localities. This pattern is equivalent to the abundance–occupancy relationship in ecology. Variations in habitat availability and quality can generate such a pattern in free-living species (Gaston et al., Reference Gaston, Blackburn, Greenwood, Gregory, Quinn and Lawton2000). For parasites, it corresponds to variation in host availability (encounter and transmission rates) and compatibility. To further understand parasite distribution across fish species, we analysed aggregation using the variance-to-mean abundance relationship (Gaston et al., Reference Gaston, Blackburn, Greenwood, Gregory, Quinn and Lawton2000; Morand & Krasnov, Reference Morand and Krasnov2008) on a subset of fish species. A high proportion of variance in parasite abundance (95%) was explained by mean abundance across fish species. This result is in agreement with Shaw & Dobson (Reference Shaw and Dobson1995) and Poulin (Reference Poulin2013), and provides evidence for a nearly random process of P. laevis s.l. accumulation among fish species. Several factors could potentially increase heterogeneity in parasite distribution among fish host species, such as sample size and host mean body size (Poulin, Reference Poulin2013; Johnson & Wilber, Reference Johnson and Wilber2017), and behavioural or physiological differences among host species (Shaw & Dobson, Reference Shaw and Dobson1995). Differences in diet choice, microhabitat and host–parasite compatibility can all influence parasite distribution among hosts. However, their contribution to variation in aggregation among fish hosts should be negligible compared to the process of random accumulation of P. laevis s.l. However, this conclusion should be taken cautiously; sample size limitations restricted the number of fish species included to only nine out of the 14 species of fish hosts recorded.
Abundance and aggregation in relation to fish biomass
The process of random accumulation of P. laevis s.l. evidenced here was suggesting that parasite distribution within and among fish species was mainly driven by the probability of encounter rate of predators with infected host prey. We attempted to test this hypothesis by using local fish biomass density as a proxy for encounter rate. Interestingly, we found a positive relationship between mean parasite abundance and fish biomass density, but not fish density. Most fish species prey upon amphipods, and these crustaceans are the most abundant macroinvertebrates sampled in these rivers (M.J.P.M., pers. obs.); therefore, encounter rate with infected prey increases with fish host density but also body mass, both leading to a higher prey intake rate. The distribution of P. laevis s.l. among fish hosts further confirms that potential variations in compatibility across fish host species have a negligible effect on the distribution of P. laevis s.l. This interpretation holds assuming that the accumulation of adult intestinal parasites in individual fish occurs at a rate proportional to encounter rate across fish species, meaning low heterogeneity in compatibility, and low within-host competition among co-infecting parasites. In support of this assumption, the lack of intensity-dependent regulation of parasite development or fecundity has been reported previously on a subset of these samples. Parasite load had no effect on parasite body size or reproductive parameters (testes volume and number of eggs) (Perrot-Minnot et al., Reference Perrot-Minnot, Guyonnet, Bollache and Lagrue2019). It is still possible that inter-individual differences within fish species in growth rate or diet choice contribute to the low to medium coefficient of determination between parasite load and fish size. In addition, the occurrence of extra-intestinal parasites in several fish species still suggests that some species are more suitable definitive hosts than others. However, the analysis of aggregation pattern using all P. laevis s.l. (both intra- and extra-intestinal) points to the same conclusions (data not shown). We favoured the analysis of intestinal parasite distribution, since the contribution of extra-intestinal parasites to the life cycle is difficult to establish. Indeed, it may differ according to fish host, either paratenic hosts (minnow) or dead-end hosts (catfish), the former being part of a piscivorous fish diet.
Given the relation of parasite distribution to local fish biomass density, a large fraction of the P. laevis s.l. population typically occurs within a few host species, mainly barbel and chub. Interestingly, this pattern does not preclude a narrower host range when considering P. laevis and P. tereticollis separately, in particular with respect to fish feeding ecology (Perrot-Minnot et al., Reference Perrot-Minnot, Guyonnet, Bollache and Lagrue2019).
Effects on fish host condition/health
We did not observe a decrease in the mean and variance of abundance in the upper category of fish size. Following Lester (Reference Lester1984) and Wilson et al. (Reference Wilson, Bjørnstad, Dobson, Merler, Poglayen, Randolph, Read, Skorping, Hudson, Rizzoli, Grenfell, Heesterbeek and Dobson2002), and assuming that size increases with age, this log-linear increase in abundance with age suggests negligible parasite-induced mortality or acquired immunity in fish. In addition, no effect of infection on body condition was evident, except in female barbel, which exhibited a decreasing body condition with increasing parasite load. Since barbel exhibited the highest mean intensity of P. laevis s.l., with 25% of individuals harbouring more than 30 adult worms (table 1 and supplementary fig. S1), it is possible that P. laevis s.l. impacts fish body condition when reaching intensities hardly seen in most fish species. In addition, parasite load did not affect HSI nor GSI. The spurious positive correlation between HSI and parasite load found in barbel was likely the consequence of the positive correlations of both HSI and parasite load with fish body size (or age). As such a positive relationship between HSI and host size has been reported before (in sharks; see Hussey et al., 2009), it is important to emphasize the necessity to look for confounding variables before interpreting the relationship between HSI and parasite load. In ectotherms with continuous growth, this relationship is probably reflecting both the higher metabolic efficiency of larger individuals within a predatory species, possibly sustained by a larger liver relative to body mass or size, and the increase in parasite load with age (approximated by size). To our knowledge, this hypothesis has not been addressed so far.
Conclusion
Positive relationships between abundance and occupancy, and variance and mean abundance, have been regularly evidenced at the intra- and interspecific levels in free-living (Gaston et al., Reference Gaston, Blackburn, Greenwood, Gregory, Quinn and Lawton2000) and parasite species (Morand & Krasnov, Reference Morand and Krasnov2008; Jenkins & Owens, Reference Jenkins and Owens2011; Pérez-del-Olmo et al., Reference Pérez-del-Olmo, Morand, Raga and Kostadinova2011). Yet, the underlying causes are not well understood, as they potentially include diverse intrinsic and extrinsic factors (reviewed in Poulin Reference Poulin2007a; Johnson & Hoverman, Reference Johnson and Hoverman2014). Here, the positive association between mean P. laevis s.l. abundance and fish biomass density tends to suggest that resource availability, represented by fish biomass density, is the main driver of parasite distribution among hosts. It is important to notice that such a relationship did not hold using fish density. Pomphorhynchus laevis s.l., therefore, tends to accumulate with age within fish species, and with fish biomass density among fish species, with negligible limitations due to intra-host intensity-dependent regulation of parasites, or to parasite-induced morbidity in fish, respectively. It shows that biomass density, rather than density alone, has to be taken into account for trophically transmitted parasites, by contrast to parasites transmitted by contact. We thereby emphasized a specific feature of spatial distribution of ‘predators as resources’ for trophically transmitted parasites, and its contribution to aggregative distribution.
Supplementary material
To view supplementary material for this article, please visit https://doi.org/10.1017/S0022149X1900097X.
Acknowledgement
We thank Mr Julien Bouchard from the Agence française pour la biodiversité for his assistance during the field monitoring campaign.
Financial support
This work was supported, in part, by the Biological Invasion Program of the Ministère de l'Environnement et du Développement Durable (grant number 01121) and by a grant (contrat d’étude) from the Conseil Régional de Bourgogne.
Conflicts of interest
None.
Ethical standards
The authors assert that all procedures contributing to this work comply with the ethical standards of the relevant national and institutional guides on the care and use of laboratory animals.


