


Introduction
The main route of infection by soil-transmitted helminths (STHs) is through exposure to contaminated soil, water and food (Grimes et al., Reference Grimes, Tadesse and Mekete2016; Rostami et al., Reference Rostami, Ebrahimi, Mehravar, Omrani, Fallahi and Behniafar2016). The common conventional methods for their detection in environmental samples are based on sedimentation and/or flotation, aimed to quantitatively separate and concentrate the eggs before final microscopic identification and quantification (Collender et al., Reference Collender, Kirby, Addiss, Freeman and Remais2015; Amoah et al., Reference Amoah, Singh, Stenström and Reddy2017). Microscopic examination of eggs is prone to errors – for instance, in samples with low egg concentrations, false negatives or under-estimation of the egg counts could occur (Verweij et al., Reference Verweij, Brienen, Ziem, Yelifari, Polderman and Van Lieshout2007). This lack of sensitivity in microscopy is also due to the difficulty in morphological differentiation and speciation of STH eggs (Valero et al., Reference Valero, Perez-Crespo, Periago, Khoubbane and Mas-Coma2009; Ai et al., Reference Ai, Dong, Zhang, Elsheikha, Mahmmod and Lin2010) – for instance, hookworm eggs of different genera and species are indistinguishable based on egg morphology (Gordon et al., Reference Gordon, McManus, Acosta, Olveda, Williams, Ross, Gray and Gobert2015). Another challenge is the presence of debris from the sample on the microscope slide that may interfere with the viewing.
The advent of polymerase chain reaction (PCR) methods has led to a more sensitive detection of different microorganisms, including STHs in environmental samples (Basuni et al., Reference Basuni, Muhi and Othman2011). The method is highly sensitive and specific in detecting Strongyloides stercoralis and hookworms as compared to microscopy (Verweij et al., Reference Verweij, Brienen, Ziem, Yelifari, Polderman and Van Lieshout2007, Reference Verweij, Canales, Polman, Ziem, Brienen, Polderman and van Lieshout2009). Despite the advantages with nucleic-acid-based methods for the detection and quantification of STH eggs in environmental samples, the main challenge is the extraction of consistent quantities and good quality of nucleic acid material from these eggs. A low-yielding DNA extraction method may also lead to false negative results, especially in environmental samples where low egg concentrations occur (Salonen et al., Reference Salonen, Nikkilä, Jalanka-Tuovinen, Immonen, Rajilić-Stojanović, Kekkonen, Palva and de Vos2010). The main challenge associated with nucleic acid extraction from helminthic eggs is due to the tough protective eggshell. For instance, the eggshell of Ascaris spp. has four layers, composed of a uterine layer (a glycoprotein), followed by a thin vitelline proteinaceous layer, a chitinaceous layer and then the innermost lipid layer (termed the ‘ascaroside membrane’) (Quilès et al., Reference Quilès, Balandier and Capizzi-Banas2006). These combined layers make the extraction of the nucleic material difficult. To overcome the protective barrier of the tough eggshell, harsh extraction conditions (such as sonication or bead beating) may sometimes be incorporated, but this may also lead to the shearing of the extracted DNA, negatively impacting downstream applications such as PCR. Commercial kits are commonly used for extracting nucleic acid from STH eggs (Pecson et al., Reference Pecson, Barrios, Johnson and Nelson2006; Gyawali et al., Reference Gyawali, Ahmed, Sidhu, Jagals and Toze2017; Luo et al., Reference Luo, Zhang and Li2017). These are, however, not optimized explicitly for helminth eggs and may vary between manufacturers in respect to cost, type of sample, sample processing time, amount of sample required, their ability to recover nucleic acids (Boesenberg-Smith et al., Reference Boesenberg-Smith, Pessarakli and Wolk2012) and removal of PCR inhibitors (Miller et al., Reference Miller, Bryant, Madsen and Ghiorse1999; Lakay et al., Reference Lakay, Botha and Prior2006). Extraction of DNA from environmental samples, such as wastewater and sludge, are further affected by the complex sample matrices. A variable mixture of components may be present, including different proteins, lipids and humic acids, which may have an inhibitory effect on downstream analysis such as quantitative PCR (qPCR) if they follow-through in the extraction (Hall et al., Reference Hall, Zovanyi, Christensen, Koehler and Devins2013; Josefsen et al., Reference Josefsen, Andersen, Christensen and Hoorfar2015).
In this study, DNA from Ascaris spp. eggs was extracted using six commercial kits, and the amount of DNA was quantified using NanoDrop, Qubit and Ct values from qPCR performed on the extracted DNA. Ascaris spp. eggs were used as a surrogate for STHs because eggs of this helminth are the most resilient (Naidoo et al., Reference Naidoo, Archer, Louton and Rodda2016) and have been applied as an indicator pathogen in wastewater and sludge. In addition, morphologically and structurally, the eggs of the two most common Ascaris spp. (A. lumbricoides and A. suum) are indistinguishable, whereby similar challenges are encountered in extracting DNA from the eggs of both species.
Materials and methods
Preparation of egg concentrations
Ascaris suum eggs were purchased from Excelsior Sentinel Inc. (Ithaca, NY). These eggs were initially stored in formalin to inhibit their development. A working solution with approximately 500 eggs was prepared in distilled water. These were counted microscopically under ×100 magnification (Leica DM1000, Leica Microsystems). The stock was then divided into six subsamples, resulting in approximately 83 eggs per extraction method/kit, and used for the comparison of DNA extraction kits. The limit of detection of the three best-performing extraction kits was determined by preparing eggs of different concentrations – 100, 50, 20, 10 eggs – which was done with a newly prepared stock solution and concentrations determined microscopically. DNA was also extracted from raw wastewater and sludge samples (n = 9 for each sample) from a conventional activated sludge wastewater treatment plant. The raw wastewater was taken at the influent point and sludge samples from fresh material on the sludge drying beds. These samples were assumed to contain the human parasite Ascaris lumbricoides, whereby the performance of the kits was assessed for their applicability in extracting DNA from this species as well. These samples were processed using a conventional STH egg-detection method, involving filtration and flotation (using Zinc sulphate with a specific gravity of 1.30). Briefly, 1 l of wastewater was filtered through sieves of sizes 100 and 20 µm; for the sludge samples, 20 g was weighed and mixed thoroughly with saturated ammonium bicarbonate and filtered similarly to the wastewater samples. Deposits collected on the 20 µm sieve were then washed into a test tube and flotation with zinc sulphate was carried out. Eggs were then collected after flotation and concentrated eggs washed thoroughly with distilled water before DNA extraction. The eggs were extracted from each sample, and pooled together to get the total egg concentration per wastewater and sludge. The concentration and stage of development of the Ascaris spp. eggs in the wastewater and sludge samples was determined prior to DNA extraction through microscopic examination of the eggs. Table 1 shows the stage of development of the eggs that were used.
Table 1. The percentage of Ascaris spp. eggs per each extraction at different stages of development.

a Determined microscopically prior to DNA extraction.
bIt is estimated that each larvated egg will contain about 600 cells (Pecson et al., Reference Pecson, Barrios, Johnson and Nelson2006).
DNA extraction and quantification
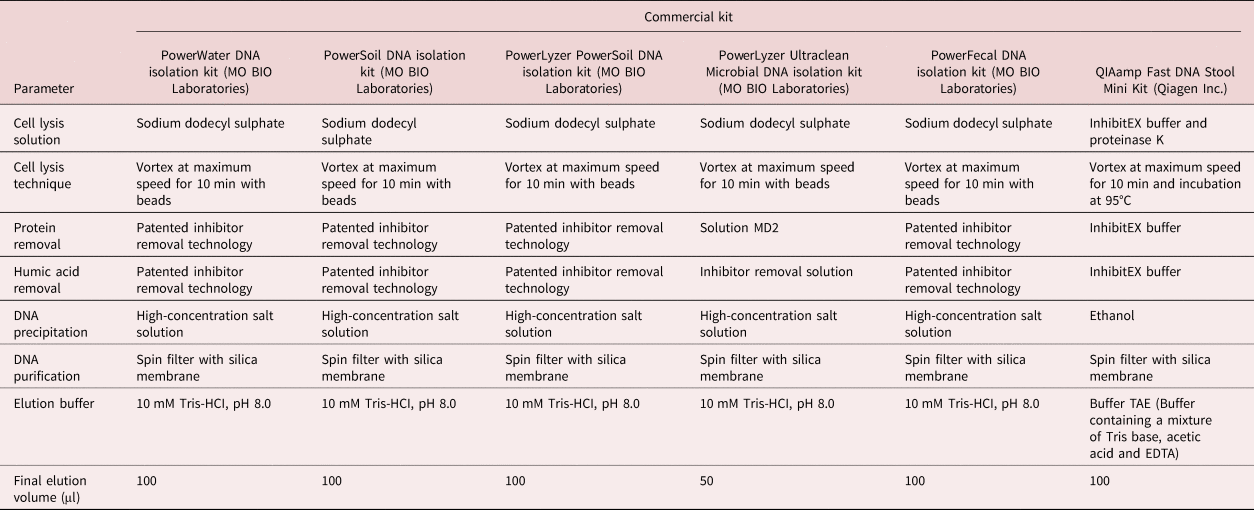
DNA was extracted from the different egg concentrations in triplicate using the six commercial DNA extraction kits (listed in table 2) and extractions were done three times (nine extractions in all per extraction kit) each time with fresh set of quantified eggs, according to the manufacturer's instructions. These kits were selected based on a thorough literature search to find the most commonly used commercial kits for the extraction of DNA from STH eggs in environmental samples. Extracted DNA was quantified using the NanoDrop ND-1000 (Thermo Scientific, Waltham, MA, USA) according to the manufacturer's instructions using 1 µl of DNA sample. The Qubit 2.0 Fluorometer (Carlsbad, California, USA) was also used to quantify the extracted DNA, using the Qubit dsDNA High Sensitivity Assay Kit and a 10 µl sample volume.
Table 2. List of DNA extraction kits used in this study and their critical steps/reagents.
qPCR
The forward primer 5′-GTA ATA GCA GTC GGC GGT TTC TT-3′ and reverse primer 5′-GCC CAA CAT GCC ACC TAT TC-3′ targeting the first Internal transcribed spacer (ITS-1) region of Ascaris spp. were adopted from Wiria et al., (Reference Wiria, Prasetyani and Hamid2010). The qPCR assay was performed using the CFX96 Touch™ Real-Time PCR Detection System (BIO-RAD, Hercules, CA, USA). Briefly, the reaction mixture contained Maxima SYBR Green/ROX qPCR Master Mix (12.5 µl), primers (0.4 µM each) and 5 µl DNA template in a final volume of 25 µl. Water was used instead of template in the negative control.
The qPCR amplification protocol for the targeted genes consists of initial denaturation for 5 min at 95°C, followed by 45 cycles of three steps consisting of 10 s at 95°C, 20 s at 58°C and 20 s at 72°C. The fluorescence signals were measured at the end of each extension step. Serial dilutions of the DNA were made up to 1:100 to check for inhibition of enzymatic reaction and all qPCR reactions were repeated at least three times (in triplicates). These dilutions were done to determine if we had any PCR inhibition in our reactions; therefore, only a few of these eggs were diluted and the test was repeated three times to give accurate information on the presence or otherwise of inhibitors based on the change in Ct values.
Statistical analysis
Statistical analysis on the total DNA yields was performed in GraphPadPrism version 7.0 (GraphPad Software Inc.) using one-way analysis of variance followed by Tukey's multiple comparisons test. A P-value of less than 0.05 was considered significant.
Results
Comparison of DNA extraction kits and methods of DNA quantification
All six DNA extraction kits yielded DNA of varying concentrations, as confirmed by the Ct values from qPCR reactions, as well as the NanoDrop and Qubit results (table 3). The qPCR reactions showed different quantities of template DNA as extracted by the six kits. PowerSoil and PowerLyzer Ultraclean DNA isolation kits gave the least Ct values, indicating higher template DNA concentrations than the other extraction kits, followed by the PowerLyzer PowerSoil DNA isolation kit. The least quantity of DNA was extracted with the QIAamp Fast DNA Stool Mini Kit (Ct value of 30.11 ± 0.08). Considering all three methods of DNA quantification, the PowerLyzer Ultraclean DNA, PowerSoil DNA and PowerLyzer PowerSoil DNA isolation kits were the best in descending order. However, it is worth noting that the PowerLyzer Ultraclean DNA isolation kit had an elution solution of 50 µl, which is half the amount required in comparison with the other extraction kits.
Table 3. Mean concentration (± standard deviation) of extracted DNA (using 83 eggs) as measured by NanoDrop, Qubit and qPCR (n = 9).
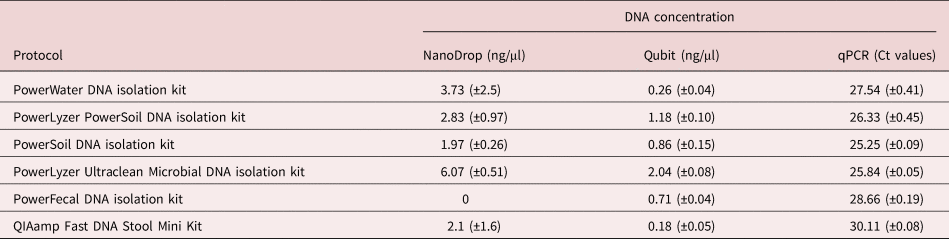
The Ct values after qPCR were statistically significant between the different kits, showing a variation in the amount of template DNA extracted. However, this statistical difference could also be attributed to the uneven distribution of larvated eggs in the samples. Eggs undergoing embryonation could have high copies of nucleic material and, therefore, influence the amount of DNA extracted. With the incorporation of a freeze and thaw step with extractions using the QIAamp Fast DNA Stool Mini Kit, there was an increase in the amount of DNA extracted, with NanoDrop readings of 7.1 ± 2.1 ng/μl and Qubit readings of 2.32 ± 0.24 ng/μl as compared to the 2.1 (±1.6) and 0.18 (±0.05) recorded.
Relationship between A. suum egg concentration and DNA yield
The three best DNA extraction kits (PowerLyzer Ultraclean DNA, PowerSoil DNA and PowerLyzer PowerSoil DNA isolation kits) have similar extraction steps and reagents (see table 2). Therefore, in the further extraction tests, the worst performing of these three (PowerLyzer PowerSoil DNA isolation kit) was replaced with the QIAamp Fast DNA Stool Mini Kit (Qiagen Inc.). This was to enable us to determine if the different extraction steps and reagents, based on difference in manufacturers (at the time of this study, Qiagen Inc. and MO BIO Laboratories were separate companies), would result in different amounts of extracted DNA when applied to a decreasing number of eggs, as well as in different sample matrices.
As expected, the measured DNA decreased when the egg concentrations were reduced. Large differences did occur between the different extraction kits, as can be seen in table 4. However, the removal of assumed inhibitors through dilution resulted in comparable good performance by the PowerSoil DNA isolation kit (table 4). The recorded CT values for the ten- and 100-fold dilutions for the 50 eggs using the PowerLyzer Ultraclean Microbial DNA isolation kit and the QIAamp Fast DNA Stool Mini Kit did not show the expected increase in CT value. Dilution of the extracted DNA from the 100 and 50 eggs of A. suum showed that with an increase in dilution, the amount of template DNA decreases with a corresponding decrease in PCR inhibitors, as based on the Ct values for the PowerLyzer Ultraclean isolation kit, and especially for the QIAamp Fast DNA Mini Kit (table 4).
Table 4. Mean concentration (± standard deviation) of Ascaris suum DNA extracted from varying egg concentrations, as determined by NanoDrop (ng/μl) and qPCR (Ct values) after a series of dilutions (n = 9).

Extraction of Ascaris spp. DNA from wastewater and sludge samples
The wastewater and sludge samples had mean Ascaris spp. egg concentrations of 94.6 (±25.79) eggs/l and 343.4 (±25.79) eggs/g, respectively (table 1). As expected, based on the number of eggs in these samples and given the similar percentage of these eggs being embryonated (table 1), the DNA yield from the sludge samples was higher than the yield from the wastewater samples, which was seen for all three of the extraction protocols (table 5). Ct values from the qPCR were as expected for the extraction protocols, except the QIAamp Fast DNA Stool Mini Kit, where a lower Ct value in the wastewater samples than in the sludge samples was found, as shown in table 5. In contrast to the comparisons made on the commercially purchased eggs, dilutions of DNA extracted from the wastewater and sludge samples showed an absence of enzymatic inhibition, which could rule out problems with inhibitor carryover from extraction to qPCR. However, the increase in the Ct values was above the expected 2–3 values. The PCR reactions were run three times and each time with freshly extracted DNA from the eggs.
Table 5. Mean concentration (± standard deviation) of Ascaris spp. DNA, as measured by NanoDrop (ng/μl) and qPCR (Ct values) in wastewater and sludge (n = 9).

Discussion
All six of the commercial kits were successful in extracting DNA from the A. suum eggs. Using the NanoDrop or Qubit to quantify the extracted DNA, the PowerLyzer Ultraclean Microbial DNA isolation kit gave the highest quantity of DNA yield. However, Ct values that directly correlate with the amount of template DNA in the sample were consistently lower, i.e. more template, in the samples extracted with the PowerSoil DNA isolation kit. The volume of elution solution used with the PowerLyzer Ultraclean Microbial DNA isolation kit was half that recommended for the other extraction kits. Therefore, the final DNA extracts will be more concentrated in the PowerLyzer Ultraclean Microbial DNA isolation kit due to the smaller volume of elution solution. Basing on the Ct values, the PowerSoil DNA isolation kit was the best in extracting the template DNA. It was observed that the type of DNA extraction method did not significantly affect the quantity of DNA extracted, with almost all the extraction kits resulting in low yield. However, kits that have a bead-beating step yielded slightly higher DNA quantities – for instance, the PowerSoil, PowerWater and PowerLyzer Ultraclean DNA isolation kits all make use of beads and these reported the highest yield of DNA. Several studies have established that DNA extraction kits that incorporate bead beating result in higher DNA yield as well as an increase in technical reproducibility (Ariefdjohan et al., Reference Ariefdjohan, Savaiano and Nakatsu2010; Salonen et al., Reference Salonen, Nikkilä, Jalanka-Tuovinen, Immonen, Rajilić-Stojanović, Kekkonen, Palva and de Vos2010; Josefsen et al., Reference Josefsen, Andersen, Christensen and Hoorfar2015). In addition, Josefsen et al. (Reference Josefsen, Andersen, Christensen and Hoorfar2015) showed that a bead-beating step in the DNA extraction protocol using the PowerLyzer PowerSoil and PowerFecal DNA isolation kits resulted in twice the amount of total DNA from the bacterium Campylobacter jejuni cells, although the resistance of the cell wall was lower here. However, prolonged bead beating may result in the shearing of DNA extracts, which may affect downstream applications, especially for bacterial cells (Josefsen et al., Reference Josefsen, Andersen, Christensen and Hoorfar2015). The bead-beating step also introduces an extra step, which increases the duration of extraction. When an additional cell disruption step using liquid nitrogen to freeze and thaw the eggs was introduced, the quantity of DNA extracted using the QIAamp Fast DNA Stool Mini Kit increased. Therefore, it can be concluded that the eggs are tough and may require an extra mechanical egg disruption step to increase DNA yield. Additionally, the difference in the concentration of DNA extracted using these kits could be attributed to the developmental stage of the eggs. In reference to table 1, some of the purified eggs purchased from a commercial supplier (1.7%) had embryonated, which significantly results in an increase in the cell counts and an increase in gene copies as a result (Pecson et al., Reference Pecson, Barrios, Johnson and Nelson2006). With such a low percentage of embryonated eggs, it is possible that a few of the samples may have contained larvated eggs, thus resulting in an uneven DNA quantity thereafter. One embryonated egg with larvae contained approximately 600 cells (Pecson et al., Reference Pecson, Barrios, Johnson and Nelson2006) as compared to the majority (92.8%) of the eggs, which only had a single cell. Naturally, one of these embryonated cells will largely influence the outcome of the extraction in terms of template DNA for the qPCR. To overcome this problem, we performed each extraction three times, in triplicates, and the mean value was used.
Our results show that the choice of DNA extraction kit or protocol may play a critical role in the amount of DNA extracted or the carryover inhibitors, both being crucial for further applications such as qPCR. Although the NanoDrop approach has been used extensively for the quantification of nucleic acids, it is limited for very low nucleic acid concentrations as seen in this study. Therefore, for accurate quantification, the use of the Ct values gives better results. In addition, the NanoDrop does not differentiate between amplifiable or non-amplifiable DNA (Thermo Scientific, 2010). Therefore, relying on DNA concentrations quantified using the NanoDrop to determine the best extraction kit/method may result in inaccurate conclusions. For instance, based on the NanoDrop, the best DNA extraction kit was the PowerLyzer Ultraclean DNA isolation kit; the use of the Ct values, however, showed that the PowerSoil DNA extraction kit extracts the highest quantity of template DNA. In contrast, the Qubit technique, together with the Ct values, may give better quantification. The Qubit technique is based on the binding of intercalating dyes to double-stranded DNA molecules. The fluorescence of these bound dyes is then measured to determine the DNA concentration (Olson & Morrow, Reference Olson and Morrow2012). However, the DNA quantified using the Qubit method may not be amplifiable, but the Ct values gives a direct correlation with the amplifiable DNA content. Based on these Ct values, Qubit readings and the amount of PCR inhibitors, as determined through the dilution of the DNA extracts, the PowerSoil DNA isolation kit was seen to give the best result for the samples used in this study.
STH egg concentration in the environment is generally low, unless in endemic areas. Therefore, any DNA extraction method used must be able to extract DNA from a low number of eggs. Only the PowerLyzer Ultraclean DNA isolation kit yielded measurable DNA from as low as five eggs (the least number of eggs studied). However, qPCR was positive from the extracted samples, which clearly showed the presence of template DNA in all samples, which means all kits successfully extracted amplifiable DNA. The concentrations of STHs in wastewater vary from 0 eggs/l (Forslund et al., Reference Forslund, Ensink and Battilani2010; Abreu-Acosta & Vera, Reference Abreu-Acosta and Vera2011) to 16,000 eggs/l (Yen-Phi et al., Reference Yen-Phi, Rechenburg, Vinnerås, Clemens and Kistemann2010) depending on geographical location, and are an indication of the infection status of the populations. In sludge samples, concentrations are generally higher, although variable (Scaglia et al., Reference Scaglia, D'Imporzano, Garuti, Negri and Adani2014). Therefore, the ability to extract DNA from eggs must cover a wide egg-concentration range.
The main challenge with the molecular detection of STH eggs from environmental samples is the presence of inhibitors that might interfere with the nucleic acid extraction and subsequent PCR applications. The Ct values from the qPCR indicates the presence of inhibitors in the DNA extracts, as can be seen from the results presented in table 4. These inhibitors can be from different sources and vary in type; however, they generally have an impact on the amplification of the DNA. The Ct values reported for the diluted DNA extracts in table 4 could most likely be due to DNA cross-linking and modification caused by the preservation of the eggs with formalin. These eggs were preserved with formalin and this has been reported to affect PCR reactions due to nucleic acid cross-linking, modification and decreased DNA quality (Gilbert et al., Reference Gilbert, Haselkorn, Bunce, Sanchez and Lucas2007). DNA cross-linking may lead to susceptibility of oligonucleotides to mechanical stress and decreased accessibility to DNA polymerase (Dietrich et al., Reference Dietrich, Uhl, Sailer, Holmes and Jung2013). Sludge and wastewater samples contain a lot of substances and materials, including proteins, lipids, humic acids, etc., which have been shown to be PCR inhibitors (Tebbe & Vahjen, Reference Tebbe and Vahjen1993; Sørensen et al., Reference Sørensen, Müller, Hansen, Rasmussen, Lipthay, Barkay, Burns and Dick2002; Zhou & Thompson, Reference Zhou and Thompson2002; Fortin et al., Reference Fortin, Beaumier, Lee and Greer2004; Hall et al., Reference Hall, Zovanyi, Christensen, Koehler and Devins2013). Surprisingly less, or no, inhibition was observed in the sludge and wastewater samples. The increase in average Ct values beyond the 2–3 folds expected may be attributed to the impact of an embryonated egg/s on the quantity of DNA extracted. In addition to being able to extract higher quantities of DNA, DNA extracts from the PowerSoil DNA extraction kit also had the least carryover of PCR inhibitors.
Conclusion
It can be concluded that DNA extraction kits that make use of bead-beating techniques (PowerSoil, PowerWater and PowerLyzer Ultraclean DNA isolation kits) have a higher yield of DNA, which can most likely be attributed to the mechanical effect of the beads on the eggshell. The worst-performing kit was the QIAamp Fast DNA Stool Mini Kit, which is based solely on enzymatic reactions. In addition, PCR inhibitor impact was less in the DNA extracts from the PowerSoil DNA extraction kit, attributed to a superior inhibitor removal technology. For the quantification of DNA extracted from Ascaris spp. eggs, and most probably all helminth eggs, the use of Ct values was also seen to be a better approach, compared to the NanoDrop.
Acknowledgements
We are grateful to the Institute for Water and Wastewater Technology and the Faculty of Health Sciences of the Durban University of Technology for their support.
Financial support
This work was funded by the Bill and Melinda Gates Foundation (grant number OPP1122681) and the Sweden (STINT)/South Africa (National Research Foundation) Bilateral Research Collaboration Programme for the support (grant number STINT150831140656). Additional funding was provided by the South African Research Chairs Initiative (SARChI) of the Department of Science and Technology and National Research Foundation of South Africa.
Conflicts of interest
None.


