Barrel la T, Barwick S and Saltzberg D (2011)
Ross Ice Shelf (Antarctica) in situ radio-frequency attenuation
J. Glaciol. 57(201), 61-66
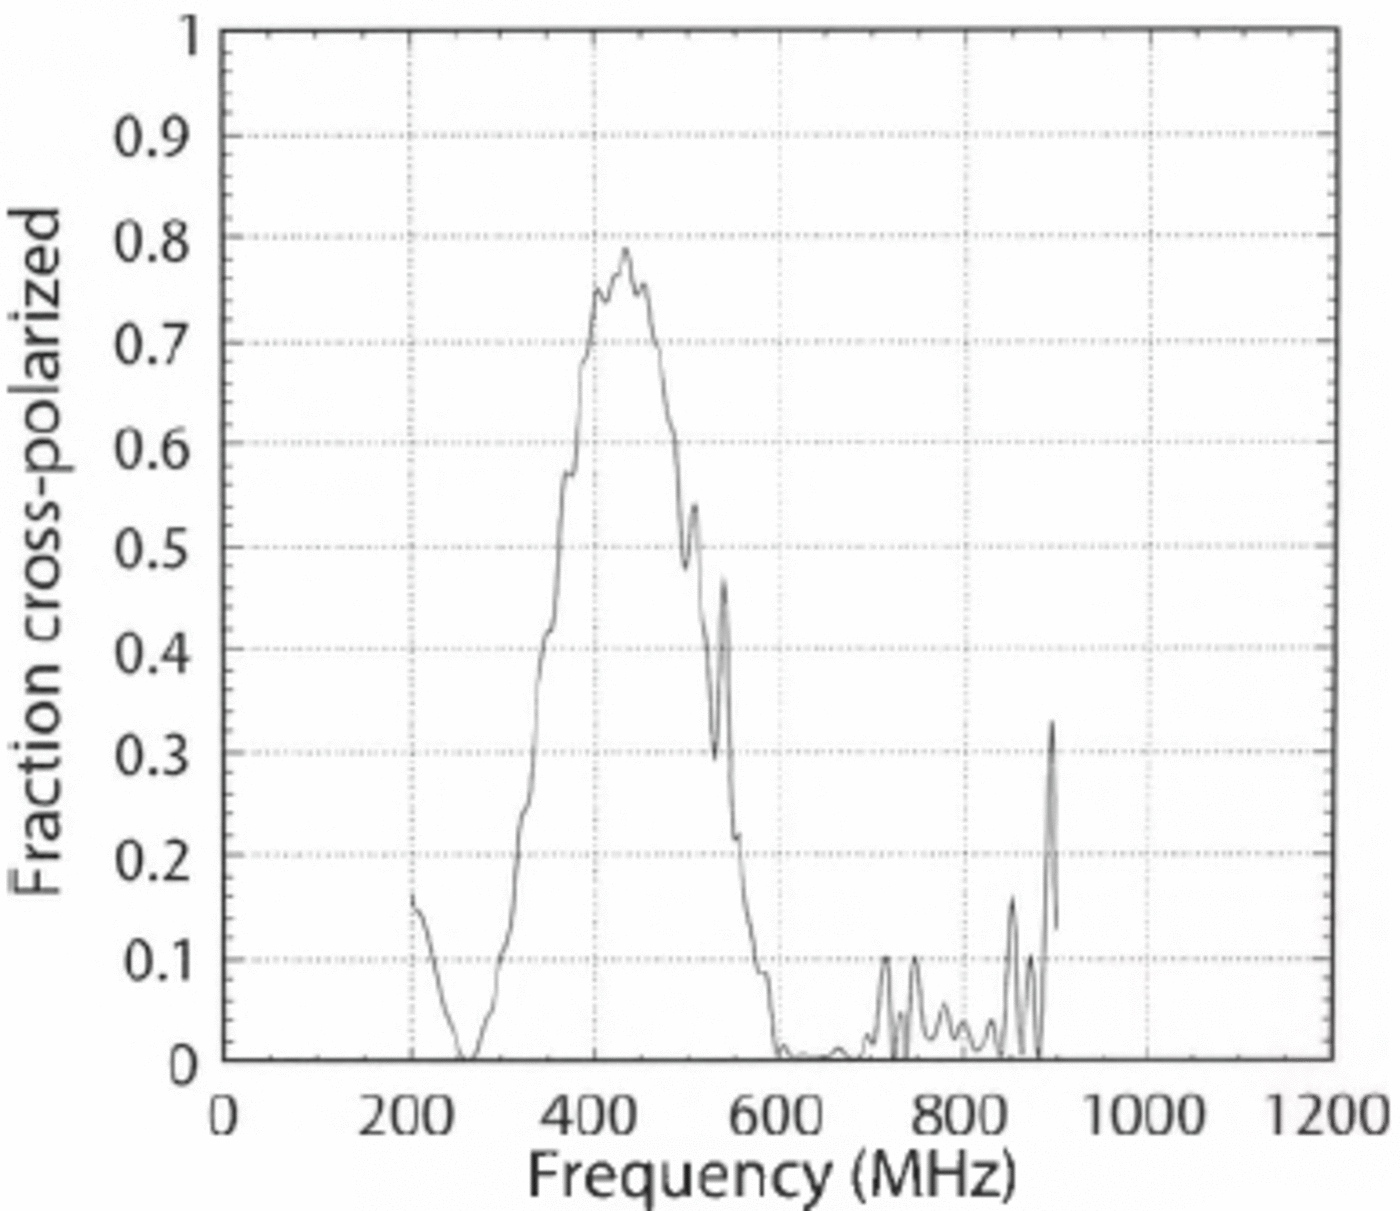
There was an error in Figure 7 in the above paper. The correct figure is reproduced here.
At the bottom of page 64, left-hand column, the sentence 'As shown in Figure 7, this fraction had a peak at ~45% at 450 MHz, which was only seen in ice data, not air' should read 'As shown in Figure 7, this fraction had a peak at ~80% at 450 MHz, which was only seen in ice data, not air.'
Near the bottom of page 65, left-hand column, the sentence 'Although the data are not expected to be described by a constant loss tangent, tan 6, the attenuation length is nearly linear with frequency' should read 'Although the data are not expected to be described by a constant loss tangent, tan 6, the attenuation length decreases with frequency.'
The authors thank Jordan Hanson for finding this error.

Fig. 7. Fraction of the received signal power that was cross- polarized. These data were taken by rotating the receiver by 90° after taking the filtered, co-polarized quad-ridged horn data.


