


1 Introduction
At the turn of the millennium a resurgence of interest occurred in water entry studies. During this time, two foundational papers on cavity formation and cavity dynamics were published, which describe the regimes into which all other water entry studies fall. The first was written by Duez et al. (Reference Duez, Ybert, Clanet and Bocquet2007), who greatly expanded the previous work of May (Reference May1951) explaining when impacting spheres form air cavities, as shown in figure 1(b–e), and when they do not, as shown in figure 1(a). The second paper, written by Aristoff & Bush (Reference Aristoff and Bush2009), came along a couple of years later, discussing the four different shapes or types of cavity that form once the appropriate conditions are met for cavity formation (shown in figure 1 b–e). We will now examine each of these papers in turn, discussing their findings, an unaddressed discrepancy between the two, and how this paper expands our understanding of the conditions in which these five water entry regimes occur.

Figure 1. A 2 mm diameter sphere impacts the water surface creating various cavity types. In (a) the wetting angle is
 $\unicode[STIX]{x1D703}=101^{\circ }$
and the sphere impacts at
$\unicode[STIX]{x1D703}=101^{\circ }$
and the sphere impacts at
 $4.43~\text{m}~\text{s}^{-1}$
without forming a cavity. In (b–e) the sphere has a wetting angle of
$4.43~\text{m}~\text{s}^{-1}$
without forming a cavity. In (b–e) the sphere has a wetting angle of
 $\unicode[STIX]{x1D703}=141^{\circ }$
and impacts with velocities
$\unicode[STIX]{x1D703}=141^{\circ }$
and impacts with velocities
 $0.24~\text{m}~\text{s}^{-1}$
,
$0.24~\text{m}~\text{s}^{-1}$
,
 $1.40~\text{m}~\text{s}^{-1}$
,
$1.40~\text{m}~\text{s}^{-1}$
,
 $2.80~\text{m}~\text{s}^{-1}$
and
$2.80~\text{m}~\text{s}^{-1}$
and
 $4.43~\text{m}~\text{s}^{-1}$
, forming quasistatic, shallow, deep and surface seal cavities, respectively. See supplementary movies 1–5 (available at https://doi.org/10.1017/jfm.2018.985). (f) The basic experimental set-up is shown with two high-speed cameras viewing the impact events above and below the free surface.
$4.43~\text{m}~\text{s}^{-1}$
, forming quasistatic, shallow, deep and surface seal cavities, respectively. See supplementary movies 1–5 (available at https://doi.org/10.1017/jfm.2018.985). (f) The basic experimental set-up is shown with two high-speed cameras viewing the impact events above and below the free surface.
Duez et al. (Reference Duez, Ybert, Clanet and Bocquet2007) found that cavity formation of smooth spheres occurs above a critical velocity
 $U_{cr}$
that is a function of the advancing static contact angle
$U_{cr}$
that is a function of the advancing static contact angle
 $\unicode[STIX]{x1D703}$
. Hydrophilic spheres (
$\unicode[STIX]{x1D703}$
. Hydrophilic spheres (
 $\unicode[STIX]{x1D703}<90^{\circ }$
) form cavities above
$\unicode[STIX]{x1D703}<90^{\circ }$
) form cavities above
 $U_{cr}\approx 7.2~\text{m}~\text{s}^{-1}$
in water. The critical velocity decreases for hydrophobic spheres (
$U_{cr}\approx 7.2~\text{m}~\text{s}^{-1}$
in water. The critical velocity decreases for hydrophobic spheres (
 $\unicode[STIX]{x1D703}>90^{\circ }$
), going to zero as
$\unicode[STIX]{x1D703}>90^{\circ }$
), going to zero as
 $\unicode[STIX]{x1D703}$
goes to
$\unicode[STIX]{x1D703}$
goes to
 $180^{\circ }$
. They explain this finding by discussing the contact-line stability of the thin, upward-moving film or splash crown that forms around the circumference of the sphere upon impact. When the splash adheres to the sphere (below the critical velocity) no cavity forms. When it separates from the sphere, air gets pulled behind the sphere and a cavity forms.
$180^{\circ }$
. They explain this finding by discussing the contact-line stability of the thin, upward-moving film or splash crown that forms around the circumference of the sphere upon impact. When the splash adheres to the sphere (below the critical velocity) no cavity forms. When it separates from the sphere, air gets pulled behind the sphere and a cavity forms.
Aristoff & Bush (Reference Aristoff and Bush2009) studied the water entry of spheres with one contact angle,
 $\unicode[STIX]{x1D703}=120\pm 5^{\circ }$
, and various impact velocities and sphere diameters. Their expansive data set found cavities forming at all impact velocities, with four distinct shapes defined by their collapse or pinch-off location, each of which occurs in a specific region on a Bond–Weber plot. At the lowest Weber number,
$\unicode[STIX]{x1D703}=120\pm 5^{\circ }$
, and various impact velocities and sphere diameters. Their expansive data set found cavities forming at all impact velocities, with four distinct shapes defined by their collapse or pinch-off location, each of which occurs in a specific region on a Bond–Weber plot. At the lowest Weber number,
 $We$
, they describe quasistatic seal, in which pinch-off occurs on or very near the sphere surface (figure 1
b). At higher
$We$
, they describe quasistatic seal, in which pinch-off occurs on or very near the sphere surface (figure 1
b). At higher
 $We$
, both shallow and deep seal are seen. Shallow seal occurs at lower Bond number,
$We$
, both shallow and deep seal are seen. Shallow seal occurs at lower Bond number,
 $Bo$
, where surface tension dominates and the pinch-off depth is of the order of the capillary length (figure 1
c). Deep seal occurs at higher
$Bo$
, where surface tension dominates and the pinch-off depth is of the order of the capillary length (figure 1
c). Deep seal occurs at higher
 $Bo$
, where gravitational forces dominate and pinch-off occurs approximately half way between the pool surface and the sphere (figure 1
d). Surface seal occurs at the highest
$Bo$
, where gravitational forces dominate and pinch-off occurs approximately half way between the pool surface and the sphere (figure 1
d). Surface seal occurs at the highest
 $We$
, wherein the splash crown created upon impact collapses inwards due to air pressure and surface tension (Marston et al.
Reference Marston, Truscott, Speirs, Mansoor and Thoroddsen2016), sealing at the pool surface (figure 1
e).
$We$
, wherein the splash crown created upon impact collapses inwards due to air pressure and surface tension (Marston et al.
Reference Marston, Truscott, Speirs, Mansoor and Thoroddsen2016), sealing at the pool surface (figure 1
e).
According to Duez et al. (Reference Duez, Ybert, Clanet and Bocquet2007), at the contact angle used by Aristoff & Bush (Reference Aristoff and Bush2009) (
 $\unicode[STIX]{x1D703}=120^{\circ }$
), cavities should not form below
$\unicode[STIX]{x1D703}=120^{\circ }$
), cavities should not form below
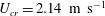 $U_{cr}=2.14~\text{m}~\text{s}^{-1}$
. Yet Aristoff & Bush report quasistatic, shallow and deep seal cavities at velocities below this value. We can explain this discrepancy by the surface roughness of the coating used by Aristoff & Bush – namely Cytonix WX2100. Aristoff & Bush report a root mean squared roughness of
$U_{cr}=2.14~\text{m}~\text{s}^{-1}$
. Yet Aristoff & Bush report quasistatic, shallow and deep seal cavities at velocities below this value. We can explain this discrepancy by the surface roughness of the coating used by Aristoff & Bush – namely Cytonix WX2100. Aristoff & Bush report a root mean squared roughness of
 $R_{q}=1.6~\unicode[STIX]{x03BC}\text{m}$
. A few years later Zhao, Chen & Wang (Reference Zhao, Chen and Wang2014) revealed that the maximum roughness
$R_{q}=1.6~\unicode[STIX]{x03BC}\text{m}$
. A few years later Zhao, Chen & Wang (Reference Zhao, Chen and Wang2014) revealed that the maximum roughness
 $R_{z}$
(defined as the sum of the highest peak and the deepest trough) predicts
$R_{z}$
(defined as the sum of the highest peak and the deepest trough) predicts
 $U_{cr}$
better than the root mean squared roughness. In attempting to reproduce the coating of Aristoff & Bush we obtain a coating with maximum roughness value of
$U_{cr}$
better than the root mean squared roughness. In attempting to reproduce the coating of Aristoff & Bush we obtain a coating with maximum roughness value of
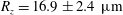 $R_{z}=16.9\pm 2.4~\unicode[STIX]{x03BC}\text{m}$
. According to Zhao et al. (Reference Zhao, Chen and Wang2014) this
$R_{z}=16.9\pm 2.4~\unicode[STIX]{x03BC}\text{m}$
. According to Zhao et al. (Reference Zhao, Chen and Wang2014) this
 $R_{z}$
value should result in cavity formation even at very low impact velocities. Hence the cavity formation described in the work of Aristoff & Bush (Reference Aristoff and Bush2009) is due to both the high contact angle and high roughness.
$R_{z}$
value should result in cavity formation even at very low impact velocities. Hence the cavity formation described in the work of Aristoff & Bush (Reference Aristoff and Bush2009) is due to both the high contact angle and high roughness.
Since these foundational works, several other important studies have come forth. Important topics include: the water entry of spinning spheres (Truscott & Techet Reference Truscott and Techet2009a ,Reference Truscott and Techet b ), the effect of sphere density (Aristoff et al. Reference Aristoff, Truscott, Techet and Bush2010), the occurrence of multiple pinch-off events (Mansoor et al. Reference Mansoor, Marston, Vakarelski and Thoroddsen2014), the buckling instability in the crown (Marston et al. Reference Marston, Truscott, Speirs, Mansoor and Thoroddsen2016), the effects of deformability (Hurd et al. Reference Hurd, Belden, Jandron, Fanning, Bower and Truscott2017), the unsteady forces during entry (Truscott, Epps & Techet Reference Truscott, Epps and Techet2012), and many more described in the annual review by Truscott, Epps & Belden (Reference Truscott, Epps and Belden2014).
Although these works have contributed much to our understanding of water entry, we will return our focus to the foundational works discussed above and examine how the cavity formation regimes respond to experimentally varying the wetting angle
 $\unicode[STIX]{x1D703}$
, the sphere diameter
$\unicode[STIX]{x1D703}$
, the sphere diameter
 $d$
and the impact velocity
$d$
and the impact velocity
 $U_{o}$
. Seeing that the sphere roughness affects the water entry behaviour in a similar manner to the contact angle (as discussed above) we restrict our study to smooth spheres with
$U_{o}$
. Seeing that the sphere roughness affects the water entry behaviour in a similar manner to the contact angle (as discussed above) we restrict our study to smooth spheres with
 $R_{z}\lesssim 1~\unicode[STIX]{x03BC}\text{m}$
, but refer to the findings with hydrophobic and rough spheres of Aristoff & Bush (Reference Aristoff and Bush2009) for comparison. We will explain the physics using the Bond, Weber and Froude numbers, which we define as
$R_{z}\lesssim 1~\unicode[STIX]{x03BC}\text{m}$
, but refer to the findings with hydrophobic and rough spheres of Aristoff & Bush (Reference Aristoff and Bush2009) for comparison. We will explain the physics using the Bond, Weber and Froude numbers, which we define as
 $Bo=\unicode[STIX]{x1D70C}gd^{2}/\unicode[STIX]{x1D70E}$
,
$Bo=\unicode[STIX]{x1D70C}gd^{2}/\unicode[STIX]{x1D70E}$
,
 $We=\unicode[STIX]{x1D70C}U_{o}^{2}d/\unicode[STIX]{x1D70E}$
and
$We=\unicode[STIX]{x1D70C}U_{o}^{2}d/\unicode[STIX]{x1D70E}$
and
 $Fr=U_{o}^{2}/gd$
, respectively, where
$Fr=U_{o}^{2}/gd$
, respectively, where
 $\unicode[STIX]{x1D70C}$
is the liquid density,
$\unicode[STIX]{x1D70C}$
is the liquid density,
 $g$
is the acceleration of gravity and
$g$
is the acceleration of gravity and
 $\unicode[STIX]{x1D70E}$
is the surface tension. We use the diameter
$\unicode[STIX]{x1D70E}$
is the surface tension. We use the diameter
 $d$
instead of the sphere radius as the appropriate length scale in defining the above dimensionless numbers, as it results in transitional behaviours around a value of one. In § 4 we will also examine an alternate method of defining the Bond, Weber and Froude numbers that allows us to predict the cavity types for various impacting bodies on the same regime diagram.
$d$
instead of the sphere radius as the appropriate length scale in defining the above dimensionless numbers, as it results in transitional behaviours around a value of one. In § 4 we will also examine an alternate method of defining the Bond, Weber and Froude numbers that allows us to predict the cavity types for various impacting bodies on the same regime diagram.
2 Experimental set-up and description
Figure 1(f) shows the experimental set-up used in this study. Various diameter stainless steel spheres (
 $d=1{-}18~\text{mm}$
) of density
$d=1{-}18~\text{mm}$
) of density
 $7830~\text{kg}~\text{m}^{-3}$
are dropped from an electromagnet onto a tank of water. Two high-speed cameras record the impact on the free surface, imaging at 2500 frames per second both above and below the surface from the side. The height of the electromagnet controls the impact velocity of the spheres
$7830~\text{kg}~\text{m}^{-3}$
are dropped from an electromagnet onto a tank of water. Two high-speed cameras record the impact on the free surface, imaging at 2500 frames per second both above and below the surface from the side. The height of the electromagnet controls the impact velocity of the spheres
 $U_{o}$
, which is varied from 0.10 to
$U_{o}$
, which is varied from 0.10 to
 $10.39~\text{m}~\text{s}^{-1}$
. To vary the advancing static contact angle
$10.39~\text{m}~\text{s}^{-1}$
. To vary the advancing static contact angle
 $\unicode[STIX]{x1D703}$
, three different coatings (or the lack thereof) are used: clean steel, Turtle Wax Super Hard Shell car wax and Glaco Mirror Coat Zero. The contact angle is measured using the sessile drop method. Values of
$\unicode[STIX]{x1D703}$
, three different coatings (or the lack thereof) are used: clean steel, Turtle Wax Super Hard Shell car wax and Glaco Mirror Coat Zero. The contact angle is measured using the sessile drop method. Values of
 $\unicode[STIX]{x1D703}$
and
$\unicode[STIX]{x1D703}$
and
 $R_{z}$
are shown in table 1. Roughness measurements are obtained using a profilometer. The spheres are prepared by first washing with soap and water and then rinsing with ethyl alcohol. Coatings are then applied and allowed to dry before testing. After each test the spheres are dried and then recoated to ensure consistent surface properties.
$R_{z}$
are shown in table 1. Roughness measurements are obtained using a profilometer. The spheres are prepared by first washing with soap and water and then rinsing with ethyl alcohol. Coatings are then applied and allowed to dry before testing. After each test the spheres are dried and then recoated to ensure consistent surface properties.
Table 1. List of coatings with their advancing static contact angle
 $\unicode[STIX]{x1D703}$
and maximum roughness
$\unicode[STIX]{x1D703}$
and maximum roughness
 $R_{z}$
, with the mean and 95 % confidence window reported.
$R_{z}$
, with the mean and 95 % confidence window reported.

From the high-speed videos we determine whether or not a cavity forms. If a cavity does form, the cavity type is determined using the definitions described by Aristoff & Bush (Reference Aristoff and Bush2009). Measurements are also taken from the videos to find cavity depths, diameters and the time to pinch-off. The pinch-off depth
 $h_{p}$
is defined as the distance from the undisturbed free surface to the location where the cavity walls or splash crown pinch together or collapse (positive downward). The depth of the bottom of the sphere at the time of pinch-off,
$h_{p}$
is defined as the distance from the undisturbed free surface to the location where the cavity walls or splash crown pinch together or collapse (positive downward). The depth of the bottom of the sphere at the time of pinch-off,
 $h_{b}$
, is also measured from the undisturbed free surface. The pinch-off time
$h_{b}$
, is also measured from the undisturbed free surface. The pinch-off time
 $t_{p}$
is defined as the time from impact to the pinch-off event. In cases where cavities do not form, we define the pinch-off time
$t_{p}$
is defined as the time from impact to the pinch-off event. In cases where cavities do not form, we define the pinch-off time
 $t_{p}$
as the time when the splash crown closes on the top of the sphere and the pinch-off depth
$t_{p}$
as the time when the splash crown closes on the top of the sphere and the pinch-off depth
 $h_{p}$
as the location of the top of the sphere at this time. The cavity diameter is measured at discrete depths (each row of pixels) and times (each frame) and the maximum cavity diameter from impact to the time of pinch-off is found at each discrete depth, yielding
$h_{p}$
as the location of the top of the sphere at this time. The cavity diameter is measured at discrete depths (each row of pixels) and times (each frame) and the maximum cavity diameter from impact to the time of pinch-off is found at each discrete depth, yielding
 $d_{c,max}(z)$
. The average of these maximum diameters over all depths defines
$d_{c,max}(z)$
. The average of these maximum diameters over all depths defines
 $d_{c}$
(further explanation of this same method for calculating
$d_{c}$
(further explanation of this same method for calculating
 $d_{c}$
can be found in Speirs et al. (Reference Speirs, Pan, Belden and Truscott2018)).
$d_{c}$
can be found in Speirs et al. (Reference Speirs, Pan, Belden and Truscott2018)).
3 Cavity formation and types for different contact angles
Multiple sphere diameters were tested over a large range of impact velocities for each contact angle. From these data we produce
 $Bo$
–
$Bo$
–
 $We$
plots similar to Aristoff & Bush (Reference Aristoff and Bush2009) to examine how the cavity regimes change with the contact angle (figure 2). The regime diagram for
$We$
plots similar to Aristoff & Bush (Reference Aristoff and Bush2009) to examine how the cavity regimes change with the contact angle (figure 2). The regime diagram for
 $\unicode[STIX]{x1D703}=86^{\circ }$
is shown in figure 2(a). Duez et al. (Reference Duez, Ybert, Clanet and Bocquet2007) predict the critical velocity for cavity formation for a hydrophilic sphere to be
$\unicode[STIX]{x1D703}=86^{\circ }$
is shown in figure 2(a). Duez et al. (Reference Duez, Ybert, Clanet and Bocquet2007) predict the critical velocity for cavity formation for a hydrophilic sphere to be
 $U_{cr}=0.1\unicode[STIX]{x1D70E}/\unicode[STIX]{x1D707}=7.2$
m s
$U_{cr}=0.1\unicode[STIX]{x1D70E}/\unicode[STIX]{x1D707}=7.2$
m s
 $^{-1}$
, where
$^{-1}$
, where
 $\unicode[STIX]{x1D707}$
is the dynamic viscosity, which is represented by the dashed line in figure 2(a). Surface seal cavities occur above this dashed line (as shown in figure 1
e) and no cavity formation is observed just below it (figure 1
a). Once
$\unicode[STIX]{x1D707}$
is the dynamic viscosity, which is represented by the dashed line in figure 2(a). Surface seal cavities occur above this dashed line (as shown in figure 1
e) and no cavity formation is observed just below it (figure 1
a). Once
 $We$
has decreased below approximately 240, cavities start to form again, which is unexpected in light of the work of Duez et al. (Reference Duez, Ybert, Clanet and Bocquet2007). Below
$We$
has decreased below approximately 240, cavities start to form again, which is unexpected in light of the work of Duez et al. (Reference Duez, Ybert, Clanet and Bocquet2007). Below
 $We\approx 240$
, spheres always form quasistatic seal cavities.
$We\approx 240$
, spheres always form quasistatic seal cavities.
Looking at the regime diagram for
 $\unicode[STIX]{x1D703}=101^{\circ }$
(figure 2
b) we see a similar trend to
$\unicode[STIX]{x1D703}=101^{\circ }$
(figure 2
b) we see a similar trend to
 $\unicode[STIX]{x1D703}=86^{\circ }$
with a few differences. The critical velocity for cavity formation as predicted by Duez et al. (Reference Duez, Ybert, Clanet and Bocquet2007) has decreased due to the increased contact angle and is defined by
$\unicode[STIX]{x1D703}=86^{\circ }$
with a few differences. The critical velocity for cavity formation as predicted by Duez et al. (Reference Duez, Ybert, Clanet and Bocquet2007) has decreased due to the increased contact angle and is defined by
 $U_{cr}=(7/270)(\unicode[STIX]{x1D70E}/\unicode[STIX]{x1D707})(\unicode[STIX]{x03C0}-\unicode[STIX]{x1D703})^{3}=4.89$
m s
$U_{cr}=(7/270)(\unicode[STIX]{x1D70E}/\unicode[STIX]{x1D707})(\unicode[STIX]{x03C0}-\unicode[STIX]{x1D703})^{3}=4.89$
m s
 $^{-1}$
. The critical
$^{-1}$
. The critical
 $We$
below which cavities form again does not change with the increase in
$We$
below which cavities form again does not change with the increase in
 $\unicode[STIX]{x1D703}$
. Below
$\unicode[STIX]{x1D703}$
. Below
 $We\approx 240$
, mostly quasistatic seal cavities form, with the exception of a few shallow seal cavities at low
$We\approx 240$
, mostly quasistatic seal cavities form, with the exception of a few shallow seal cavities at low
 $Bo$
, for which the volume of air entrained with the sphere is small, but approximately equal to the volume of the sphere (this is consistent with the cutoff defined by Aristoff & Bush (Reference Aristoff and Bush2009)).
$Bo$
, for which the volume of air entrained with the sphere is small, but approximately equal to the volume of the sphere (this is consistent with the cutoff defined by Aristoff & Bush (Reference Aristoff and Bush2009)).

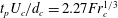
Figure 2. The cavity regimes for various contact angles are shown for (a)
 $\unicode[STIX]{x1D703}=86^{\circ }$
, (b)
$\unicode[STIX]{x1D703}=86^{\circ }$
, (b)
 $\unicode[STIX]{x1D703}=101^{\circ }$
, (c)
$\unicode[STIX]{x1D703}=101^{\circ }$
, (c)
 $\unicode[STIX]{x1D703}=120^{\circ }$
and
$\unicode[STIX]{x1D703}=120^{\circ }$
and
 $R_{z}=16.9~\unicode[STIX]{x03BC}\text{m}$
(remade from Aristoff & Bush (Reference Aristoff and Bush2009)) and (d)
$R_{z}=16.9~\unicode[STIX]{x03BC}\text{m}$
(remade from Aristoff & Bush (Reference Aristoff and Bush2009)) and (d)
 $\unicode[STIX]{x1D703}=141^{\circ }$
. All of the spheres (
$\unicode[STIX]{x1D703}=141^{\circ }$
. All of the spheres (
 $d=1$
–18 mm) are smooth according to Zhao et al. (Reference Zhao, Chen and Wang2014) except (c) (table 1). The dotted and dashed lines in (a) and (b) represent splash crown formation and Duez cavity formation, respectively. The regime separation lines in (c) and (d) are not the same as in (a) and (b). Instead they come from the predictions of Aristoff & Bush (Reference Aristoff and Bush2009). Aristoff & Bush predict the cutoffs defined by the solid curve and the dash-dotted line by equating the pinch-off times of adjacent regimes. The dashed line represents their empirical fit of
$d=1$
–18 mm) are smooth according to Zhao et al. (Reference Zhao, Chen and Wang2014) except (c) (table 1). The dotted and dashed lines in (a) and (b) represent splash crown formation and Duez cavity formation, respectively. The regime separation lines in (c) and (d) are not the same as in (a) and (b). Instead they come from the predictions of Aristoff & Bush (Reference Aristoff and Bush2009). Aristoff & Bush predict the cutoffs defined by the solid curve and the dash-dotted line by equating the pinch-off times of adjacent regimes. The dashed line represents their empirical fit of
 $We=640$
for
$We=640$
for
 $Bo\lesssim 10$
and for
$Bo\lesssim 10$
and for
 $Bo\gtrsim 10$
it is defined by
$Bo\gtrsim 10$
it is defined by
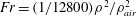 $Fr=(1/12800)\unicode[STIX]{x1D70C}^{2}/\unicode[STIX]{x1D70C}_{air}^{2}$
from Birkhoff & Isaacs (Reference Birkhoff and Isaacs1951). Pictures of the different regimes can be seen in figure 1(a–e).
$Fr=(1/12800)\unicode[STIX]{x1D70C}^{2}/\unicode[STIX]{x1D70C}_{air}^{2}$
from Birkhoff & Isaacs (Reference Birkhoff and Isaacs1951). Pictures of the different regimes can be seen in figure 1(a–e).
To understand why cavities form below a value of
 $We\approx 240$
we look at what happens as the velocity or
$We\approx 240$
we look at what happens as the velocity or
 $We$
increases for a given sphere diameter or
$We$
increases for a given sphere diameter or
 $Bo$
. Figure 3(a) shows the impact of a 10 mm diameter sphere at various
$Bo$
. Figure 3(a) shows the impact of a 10 mm diameter sphere at various
 $We$
when the sphere is approximately half submerged. At the lowest
$We$
when the sphere is approximately half submerged. At the lowest
 $We$
, a short, thick rim forms around the edge of the sphere. This rim does not have enough upward velocity to climb up the surface of the sphere and meet itself at the pole to prevent cavity formation (Duez et al.
Reference Duez, Ybert, Clanet and Bocquet2007). Hence, as the sphere descends, the free surface is pulled down with the sphere and a quasistatic seal cavity forms in its wake (figure 3
b,c,
$We$
, a short, thick rim forms around the edge of the sphere. This rim does not have enough upward velocity to climb up the surface of the sphere and meet itself at the pole to prevent cavity formation (Duez et al.
Reference Duez, Ybert, Clanet and Bocquet2007). Hence, as the sphere descends, the free surface is pulled down with the sphere and a quasistatic seal cavity forms in its wake (figure 3
b,c,
 $We=7.9$
). As
$We=7.9$
). As
 $We$
increases, the rim thins and grows taller due to its increasing upward velocity, which allows it to begin to climb the surface of the sphere, as seen in figure 3(a) at
$We$
increases, the rim thins and grows taller due to its increasing upward velocity, which allows it to begin to climb the surface of the sphere, as seen in figure 3(a) at
 $We=109$
. The upward velocity and adherence of the rim to the sphere directly competes with the rate of sphere submergence. This causes the water to move up and around the top of the sphere faster as it descends below the original free-surface plane, resulting in less air entrainment and the formation of increasingly smaller cavities. Hence, the pinch-off time
$We=109$
. The upward velocity and adherence of the rim to the sphere directly competes with the rate of sphere submergence. This causes the water to move up and around the top of the sphere faster as it descends below the original free-surface plane, resulting in less air entrainment and the formation of increasingly smaller cavities. Hence, the pinch-off time
 $t_{p}$
, depth of the sphere at pinch-off
$t_{p}$
, depth of the sphere at pinch-off
 $h_{b}$
, and the pinch-off depth
$h_{b}$
, and the pinch-off depth
 $h_{p}$
, all decrease with increasing
$h_{p}$
, all decrease with increasing
 $We$
, which can be seen qualitatively in figure 3 and quantitatively in figure 4. Once
$We$
, which can be seen qualitatively in figure 3 and quantitatively in figure 4. Once
 $We\gtrsim 240$
(dotted line) the rim has formed into a splash crown that adheres to the sphere and has enough upward velocity to reach the top of the sphere by the time the top of the sphere has descended to the level of the undisturbed free surface (
$We\gtrsim 240$
(dotted line) the rim has formed into a splash crown that adheres to the sphere and has enough upward velocity to reach the top of the sphere by the time the top of the sphere has descended to the level of the undisturbed free surface (
 $h_{b}=1$
and
$h_{b}=1$
and
 $h_{p}=0$
, figure 4
b,c), as seen at
$h_{p}=0$
, figure 4
b,c), as seen at
 $We=269$
in figure 3(b,c). Hence, the formation of the splash crown (which adheres to the sphere) suppresses cavity formation and we will call the dotted lines in figures 2(a,b) and 3 the splash crown formation line. The convergence of the splash crown on the top of the sphere looks similar to convergence of the thin films on the top of a viscous drop impacting on a pool of low viscosity, as seen by Marston & Thoroddsen (Reference Marston and Thoroddsen2008).
$We=269$
in figure 3(b,c). Hence, the formation of the splash crown (which adheres to the sphere) suppresses cavity formation and we will call the dotted lines in figures 2(a,b) and 3 the splash crown formation line. The convergence of the splash crown on the top of the sphere looks similar to convergence of the thin films on the top of a viscous drop impacting on a pool of low viscosity, as seen by Marston & Thoroddsen (Reference Marston and Thoroddsen2008).

Figure 3. The development of the splash crown and progression of cavity regimes are shown for increasing
 $We$
, for
$We$
, for
 $d=10$
mm,
$d=10$
mm,
 $Bo=13.6$
and
$Bo=13.6$
and
 $\unicode[STIX]{x1D703}=101^{\circ }$
. Each row shows different times and/or views of the same impact event. In (a) we show the development of the rim or splash crown when the sphere is approximately half submerged. In (b,c) we show the frame just prior to pinch-off or closure of the splash crown above the sphere as viewed from above and below the pool surface, respectively. The dotted and dashed lines represent splash crown formation and Duez cavity formation, respectively, and the symbols indicated the cavity type, which are all shown in figure 2(b).
$\unicode[STIX]{x1D703}=101^{\circ }$
. Each row shows different times and/or views of the same impact event. In (a) we show the development of the rim or splash crown when the sphere is approximately half submerged. In (b,c) we show the frame just prior to pinch-off or closure of the splash crown above the sphere as viewed from above and below the pool surface, respectively. The dotted and dashed lines represent splash crown formation and Duez cavity formation, respectively, and the symbols indicated the cavity type, which are all shown in figure 2(b).

Figure 4. (a) The non-dimensional pinch-off time
 $t_{p}$
, (b) depth of the bottom of the sphere at pinch-off
$t_{p}$
, (b) depth of the bottom of the sphere at pinch-off
 $h_{b}$
and (c) the pinch-off depth
$h_{b}$
and (c) the pinch-off depth
 $h_{p}$
scale with
$h_{p}$
scale with
 $We_{a}$
for the quasistatic and no-cavity regimes for
$We_{a}$
for the quasistatic and no-cavity regimes for
 $\unicode[STIX]{x1D703}=86^{\circ }$
and
$\unicode[STIX]{x1D703}=86^{\circ }$
and
 $101^{\circ }$
(same data as figure 2
a,b). Figure 3(c) shows the same trends for
$101^{\circ }$
(same data as figure 2
a,b). Figure 3(c) shows the same trends for
 $h_{b}$
and
$h_{b}$
and
 $h_{p}$
qualitatively, except that here the surface seal data is not shown as transition occurs at a constant velocity and hence the transition does not collapse with
$h_{p}$
qualitatively, except that here the surface seal data is not shown as transition occurs at a constant velocity and hence the transition does not collapse with
 $We_{a}$
. The dotted line represents the splash crown formation line. Note that the Weber number and dimensionless pinch-off time are defined using the average sphere velocity from initial impact to full submergence
$We_{a}$
. The dotted line represents the splash crown formation line. Note that the Weber number and dimensionless pinch-off time are defined using the average sphere velocity from initial impact to full submergence
 $U_{a}$
(
$U_{a}$
(
 $We_{a}=\unicode[STIX]{x1D70C}U_{a}^{2}d/\unicode[STIX]{x1D70E}$
). This accounts for the continued acceleration of the sphere when it has not reached the terminal velocity in water by the time it impacts (e.g., an 18 mm sphere falling 3 mm). The legend in (c) applies to all three plots.
$We_{a}=\unicode[STIX]{x1D70C}U_{a}^{2}d/\unicode[STIX]{x1D70E}$
). This accounts for the continued acceleration of the sphere when it has not reached the terminal velocity in water by the time it impacts (e.g., an 18 mm sphere falling 3 mm). The legend in (c) applies to all three plots.
As
 $We$
increases above the splash crown formation line the splash crown climbs up the sphere surface faster, causing
$We$
increases above the splash crown formation line the splash crown climbs up the sphere surface faster, causing
 $h_{p}$
to gradually rise above the free surface (figure 4
c), and decreasing both
$h_{p}$
to gradually rise above the free surface (figure 4
c), and decreasing both
 $t_{p}$
(figure 4
a) and
$t_{p}$
(figure 4
a) and
 $h_{b}$
(figure 4
b). Around
$h_{b}$
(figure 4
b). Around
 $U_{cr}$
, a small asymmetric cavity forms with the splash crown quickly doming over the top (figure 3,
$U_{cr}$
, a small asymmetric cavity forms with the splash crown quickly doming over the top (figure 3,
 $We=2696$
). Once
$We=2696$
). Once
 $U_{cr}$
is reached, the splash crown has enough velocity to separate from the sphere and a large surface seal cavity forms (figure 3,
$U_{cr}$
is reached, the splash crown has enough velocity to separate from the sphere and a large surface seal cavity forms (figure 3,
 $We=8081$
). Hence, we see that cavity formation or suppression is governed by the formation and separation of the splash crown. Also, we find that cavity formation occurs in two regimes: at low enough
$We=8081$
). Hence, we see that cavity formation or suppression is governed by the formation and separation of the splash crown. Also, we find that cavity formation occurs in two regimes: at low enough
 $We$
that a splash crown does not form, and at high enough impact velocity that the splash crown separates from the sphere. The boundaries of the no-cavity regime are defined by splash crown formation and what we will call Duez cavity formation (dotted and dashed lines in figures 2
a,b and 3, respectively).
$We$
that a splash crown does not form, and at high enough impact velocity that the splash crown separates from the sphere. The boundaries of the no-cavity regime are defined by splash crown formation and what we will call Duez cavity formation (dotted and dashed lines in figures 2
a,b and 3, respectively).
Surface seal is caused by the collapse of the splash crown. In the ideal cases typically depicted in the literature, the collapse of the crown, also know as dome over, causes a complete seal between the air in the cavity and the atmosphere (see supplementary movie 5). Figure 5 shows an event in which a complete seal does not occur during dome over. At
 $t=6.4$
ms, the splash crown has domed over and the air cavity behind the sphere begins to pull away from the free surface of the pool. At
$t=6.4$
ms, the splash crown has domed over and the air cavity behind the sphere begins to pull away from the free surface of the pool. At
 $t=8.0{-}9.6$
ms, air continues to enter the cavity, as evidenced by the small conical structure that forms and connects the top of the cavity to the surface of the pool. The conical structure then collapses radially slightly below the surface, providing a complete seal (
$t=8.0{-}9.6$
ms, air continues to enter the cavity, as evidenced by the small conical structure that forms and connects the top of the cavity to the surface of the pool. The conical structure then collapses radially slightly below the surface, providing a complete seal (
 $t=11.2$
ms). These partial surface seal events could be caused by an asymmetric dome over of the splash crown, that leaves a small hole or by the formation of the thin-filmed bags observed by Marston et al. (Reference Marston, Truscott, Speirs, Mansoor and Thoroddsen2016) that pop, leaving holes in the crown. Partial surface seal occurs most commonly just above the critical velocity for cavity formation and at lower contact angles.
$t=11.2$
ms). These partial surface seal events could be caused by an asymmetric dome over of the splash crown, that leaves a small hole or by the formation of the thin-filmed bags observed by Marston et al. (Reference Marston, Truscott, Speirs, Mansoor and Thoroddsen2016) that pop, leaving holes in the crown. Partial surface seal occurs most commonly just above the critical velocity for cavity formation and at lower contact angles.

Figure 5. A sphere with
 $d=10$
mm and
$d=10$
mm and
 $\unicode[STIX]{x1D703}=101^{\circ }$
impacts the pool surface at
$\unicode[STIX]{x1D703}=101^{\circ }$
impacts the pool surface at
 $U=6.26~\text{m}~\text{s}^{-1}$
forming a surface seal cavity with the above and below water views shown in (a,b) respectively. The splash crown does not always provide a complete seal of the cavity during dome over. Sometimes it mostly seals, but allows some air to continue to enter the cavity, as shown by the conical air pocket near the surface and above the main portion of the cavity at
$U=6.26~\text{m}~\text{s}^{-1}$
forming a surface seal cavity with the above and below water views shown in (a,b) respectively. The splash crown does not always provide a complete seal of the cavity during dome over. Sometimes it mostly seals, but allows some air to continue to enter the cavity, as shown by the conical air pocket near the surface and above the main portion of the cavity at
 $t=9.6$
ms. The conical portion of the cavity then collapses radially (
$t=9.6$
ms. The conical portion of the cavity then collapses radially (
 $t=11.2{-}12.8$
ms). See supplementary movie 6.
$t=11.2{-}12.8$
ms). See supplementary movie 6.
At the highest contact angle tested, when
 $\unicode[STIX]{x1D703}=141^{\circ }$
Duez et al. (Reference Duez, Ybert, Clanet and Bocquet2007) predict that cavities should form above a critical velocity of
$\unicode[STIX]{x1D703}=141^{\circ }$
Duez et al. (Reference Duez, Ybert, Clanet and Bocquet2007) predict that cavities should form above a critical velocity of
 $U_{cr}=(7/270)(\unicode[STIX]{x1D70E}/\unicode[STIX]{x1D707})(\unicode[STIX]{x03C0}-\unicode[STIX]{x1D703})^{3}=0.58~\text{m}~\text{s}^{-1}$
. This velocity gives
$U_{cr}=(7/270)(\unicode[STIX]{x1D70E}/\unicode[STIX]{x1D707})(\unicode[STIX]{x03C0}-\unicode[STIX]{x1D703})^{3}=0.58~\text{m}~\text{s}^{-1}$
. This velocity gives
 $We<240$
for all sphere diameters tested. Hence, the Duez cavity formation line lies below the splash crown formation line at all
$We<240$
for all sphere diameters tested. Hence, the Duez cavity formation line lies below the splash crown formation line at all
 $Bo$
tested and we would expect cavities to form at all impact velocities. This is indeed the case, as shown in figure 2(d). Comparing figure 2(d) to the data obtained by Aristoff & Bush (Reference Aristoff and Bush2009) for rough spheres with
$Bo$
tested and we would expect cavities to form at all impact velocities. This is indeed the case, as shown in figure 2(d). Comparing figure 2(d) to the data obtained by Aristoff & Bush (Reference Aristoff and Bush2009) for rough spheres with
 $\unicode[STIX]{x1D703}=120^{\circ }$
(shown in figure 2
c) we see that the regime locations for the two coatings are very similar. Discrepancies in the cutoff between quasistatic seal and shallow or deep seal are possibly due to the lower atmospheric pressure in Logan, Utah (elevation of 1382 m) where our experiments were performed and Cambridge, Massachusetts (elevation of 40 m) where the experiments of Aristoff & Bush (Reference Aristoff and Bush2009) were performed, with the lower pressure leading to less air entrainment, as shown by Gilbarg & Anderson (Reference Gilbarg and Anderson1948), persisting for larger
$\unicode[STIX]{x1D703}=120^{\circ }$
(shown in figure 2
c) we see that the regime locations for the two coatings are very similar. Discrepancies in the cutoff between quasistatic seal and shallow or deep seal are possibly due to the lower atmospheric pressure in Logan, Utah (elevation of 1382 m) where our experiments were performed and Cambridge, Massachusetts (elevation of 40 m) where the experiments of Aristoff & Bush (Reference Aristoff and Bush2009) were performed, with the lower pressure leading to less air entrainment, as shown by Gilbarg & Anderson (Reference Gilbarg and Anderson1948), persisting for larger
 $We$
. Discrepancies could also be due to the difference in roughness or the difference in wetting angle, or all three effects combined.
$We$
. Discrepancies could also be due to the difference in roughness or the difference in wetting angle, or all three effects combined.
Spheres rebound off the pool surface at the lowest
 $Bo$
and
$Bo$
and
 $We$
tested for all three contact angles. Figure 2 shows that transition from water entry to rebound occurs when
$We$
tested for all three contact angles. Figure 2 shows that transition from water entry to rebound occurs when
 $We<1$
and
$We<1$
and
 $Bo<0.5$
. In this parameter space, surface tension dominates over both inertial and gravitational forces and, hence, neither the sphere’s inertia nor its weight cause it to enter the water surface. Figure 2 also shows that rebound is slightly dependent on the sphere’s contact angle, with higher contact angles leading to rebound at higher
$Bo<0.5$
. In this parameter space, surface tension dominates over both inertial and gravitational forces and, hence, neither the sphere’s inertia nor its weight cause it to enter the water surface. Figure 2 also shows that rebound is slightly dependent on the sphere’s contact angle, with higher contact angles leading to rebound at higher
 $Bo$
and
$Bo$
and
 $We$
.
$We$
.

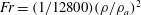
Figure 6. The cavity regimes can be predicted for various impacting bodies using the cavity diameter
 $d_{c}$
and cavity velocity
$d_{c}$
and cavity velocity
 $U_{c}$
to define
$U_{c}$
to define
 $Bo_{c}$
and
$Bo_{c}$
and
 $We_{c}$
. The hollow symbols are for spheres (same as figure 2
d) and the solid symbols are for multidroplet streams and jets. For spheres,
$We_{c}$
. The hollow symbols are for spheres (same as figure 2
d) and the solid symbols are for multidroplet streams and jets. For spheres,
 $U_{c}=U_{o}$
, and for multidroplet streams and jets,
$U_{c}=U_{o}$
, and for multidroplet streams and jets,
 $U_{c}$
is set equal to
$U_{c}$
is set equal to
 $1/2U_{stream}$
. The dash-dotted line separating the shallow and deep seal regimes is found by equating the dimensionless pinch-off times for shallow and deep seal (figure 7). The dashed line dividing deep and surface seal is drawn by modifying the cutoffs found by Birkhoff & Isaacs (Reference Birkhoff and Isaacs1951) and Aristoff & Bush (Reference Aristoff and Bush2009).
$1/2U_{stream}$
. The dash-dotted line separating the shallow and deep seal regimes is found by equating the dimensionless pinch-off times for shallow and deep seal (figure 7). The dashed line dividing deep and surface seal is drawn by modifying the cutoffs found by Birkhoff & Isaacs (Reference Birkhoff and Isaacs1951) and Aristoff & Bush (Reference Aristoff and Bush2009).
4 New scaling to predict cavity regimes for various impacting bodies
When defining dimensionless numbers it is always difficult to pick the appropriate length and velocity scales to describe the physics of the problem. Historically in water entry research, the sphere diameter or radius has been chosen as the length scale and the initial impact velocity for the velocity scale (Truscott et al.
Reference Truscott, Epps and Belden2014). As the cavity collapse is likely to be a function of the cavity characteristics, it could be insightful to redefine the appropriate dimensionless numbers using cavity length and velocity scales. We define the cavity Weber number as
 $We_{c}=\unicode[STIX]{x1D70C}U_{c}^{2}d_{c}/\unicode[STIX]{x1D70E}$
, the cavity Bond number as
$We_{c}=\unicode[STIX]{x1D70C}U_{c}^{2}d_{c}/\unicode[STIX]{x1D70E}$
, the cavity Bond number as
 $Bo_{c}=\unicode[STIX]{x1D70C}gd_{c}^{2}/\unicode[STIX]{x1D70E}$
and the cavity Froude number as
$Bo_{c}=\unicode[STIX]{x1D70C}gd_{c}^{2}/\unicode[STIX]{x1D70E}$
and the cavity Froude number as
 $Fr_{c}=U_{c}^{2}/gd_{c}$
, where
$Fr_{c}=U_{c}^{2}/gd_{c}$
, where
 $d_{c}$
is the cavity diameter defined in § 2 as an averaged maximum diameter and
$d_{c}$
is the cavity diameter defined in § 2 as an averaged maximum diameter and
 $U_{c}$
is the downward cavity velocity. We set
$U_{c}$
is the downward cavity velocity. We set
 $U_{c}$
equal to the initial sphere impact velocity
$U_{c}$
equal to the initial sphere impact velocity
 $U_{o}$
as they are approximately the same over the time of cavity collapse. Plotting a regime diagram with the cavity scaling for
$U_{o}$
as they are approximately the same over the time of cavity collapse. Plotting a regime diagram with the cavity scaling for
 $\unicode[STIX]{x1D703}=141^{\circ }$
, we see in figure 6 that
$\unicode[STIX]{x1D703}=141^{\circ }$
, we see in figure 6 that
 $Bo_{c}$
and
$Bo_{c}$
and
 $We_{c}$
separate the cavity types for shallow, deep and surface seal (hollow symbols). Quasistatic seal cavities are not included because they are not cylindrical, and they are specific to sphere entry, as discussed more in the next paragraph.
$We_{c}$
separate the cavity types for shallow, deep and surface seal (hollow symbols). Quasistatic seal cavities are not included because they are not cylindrical, and they are specific to sphere entry, as discussed more in the next paragraph.
Speirs et al. (Reference Speirs, Pan, Belden and Truscott2018) investigated the water entry of multidroplet streams and jets and found that shallow, deep and surface seal cavities occur for liquid–liquid impact as well. Previous work had only shown shallow seal for multidroplet streams (Bouwhuis et al.
Reference Bouwhuis, Huang, Chan, Frommhold, Ohl, Lohse, Snoeijer and van der Meer2016) and deep seal for jets (Oguz, Prosperetti & Lezzi Reference Oguz, Prosperetti and Lezzi1992; Oguz, Prosperetti & Kolaini Reference Oguz, Prosperetti and Kolaini1995; Zhu, Oguz & Prosperetti Reference Zhu, Oguz and Prosperetti2000; Qu et al.
Reference Qu, Goharzadeh, Khezzar and Molki2013). In that paper we predicted the cavity seal types for both multidroplet streams and jets on the same
 $Bo$
–
$Bo$
–
 $We$
regime diagram (figure 6c of Speirs et al. (Reference Speirs, Pan, Belden and Truscott2018)) using a scaling based on the cavity diameter (figure 5 of Speirs et al. (Reference Speirs, Pan, Belden and Truscott2018)) and no alteration of the impact velocity. We can collapse those data onto the
$We$
regime diagram (figure 6c of Speirs et al. (Reference Speirs, Pan, Belden and Truscott2018)) using a scaling based on the cavity diameter (figure 5 of Speirs et al. (Reference Speirs, Pan, Belden and Truscott2018)) and no alteration of the impact velocity. We can collapse those data onto the
 $Bo_{c}$
–
$Bo_{c}$
–
 $We_{c}$
regime diagram for spheres, figure 6, using
$We_{c}$
regime diagram for spheres, figure 6, using
 $d_{c}$
and
$d_{c}$
and
 $U_{c}$
to define
$U_{c}$
to define
 $Bo_{c}$
and
$Bo_{c}$
and
 $We_{c}$
. (The regime diagram in figure 6c of Speirs et al. (Reference Speirs, Pan, Belden and Truscott2018) uses the stream velocity, jet diameter and a modified droplet diameter in the calculation of the Bond and Weber numbers.) The cavity velocity
$We_{c}$
. (The regime diagram in figure 6c of Speirs et al. (Reference Speirs, Pan, Belden and Truscott2018) uses the stream velocity, jet diameter and a modified droplet diameter in the calculation of the Bond and Weber numbers.) The cavity velocity
 $U_{c}$
is set equal to one half the impacting stream velocity, which is shown to be a good approximation for jets in multiple works (Oguz et al.
Reference Oguz, Prosperetti and Lezzi1992, Reference Oguz, Prosperetti and Kolaini1995; Zhu et al.
Reference Zhu, Oguz and Prosperetti2000; Qu et al.
Reference Qu, Goharzadeh, Khezzar and Molki2013; Speirs et al.
Reference Speirs, Pan, Belden and Truscott2018). Using this scaling, figure 6 shows that the regimes for all three water entry types (spheres, liquid jets and liquid multidroplet streams) can be predicted in the same
$U_{c}$
is set equal to one half the impacting stream velocity, which is shown to be a good approximation for jets in multiple works (Oguz et al.
Reference Oguz, Prosperetti and Lezzi1992, Reference Oguz, Prosperetti and Kolaini1995; Zhu et al.
Reference Zhu, Oguz and Prosperetti2000; Qu et al.
Reference Qu, Goharzadeh, Khezzar and Molki2013; Speirs et al.
Reference Speirs, Pan, Belden and Truscott2018). Using this scaling, figure 6 shows that the regimes for all three water entry types (spheres, liquid jets and liquid multidroplet streams) can be predicted in the same
 $Bo_{c}$
–
$Bo_{c}$
–
 $We_{c}$
parameter space. This scaling suggests that we can predict the pinch-off type of a cavity if we know its diameter and downward velocity, regardless of the type of impacting body used.
$We_{c}$
parameter space. This scaling suggests that we can predict the pinch-off type of a cavity if we know its diameter and downward velocity, regardless of the type of impacting body used.
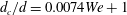
The cavity non-dimensional pinch-off times,
 $t_{p}U_{c}/d_{c}$
, of the sphere, multidroplet stream and jet data can be predicted on the same plot for shallow and deep seal using
$t_{p}U_{c}/d_{c}$
, of the sphere, multidroplet stream and jet data can be predicted on the same plot for shallow and deep seal using
 $We_{c}$
and
$We_{c}$
and
 $Fr_{c}$
, respectively. Figure 7(a) shows that
$Fr_{c}$
, respectively. Figure 7(a) shows that
 $t_{p}U_{c}/d_{c}$
scales with
$t_{p}U_{c}/d_{c}$
scales with
 $We_{c}^{1/2}$
for shallow seal and figure 7(b) shows that
$We_{c}^{1/2}$
for shallow seal and figure 7(b) shows that
 $t_{p}U_{c}/d_{c}$
scales with
$t_{p}U_{c}/d_{c}$
scales with
 $Fr_{c}^{1/3}$
for deep seal as also shown by Oguz et al. (Reference Oguz, Prosperetti and Kolaini1995), Lohse et al. (Reference Lohse, Bergmann, Mikkelsen, Zeilstra, van der Meer, Versluis, van der Weele, van der Hoef and Kuipers2004) and Duclaux et al. (Reference Duclaux, Caillé, Duez, Ybert, Bocquet and Clanet2007). Equating these non-dimensional pinch-off times and rearranging gives the cutoff between the shallow and deep seal regimes, as shown by the dash-dotted line in figure 6 (
$Fr_{c}^{1/3}$
for deep seal as also shown by Oguz et al. (Reference Oguz, Prosperetti and Kolaini1995), Lohse et al. (Reference Lohse, Bergmann, Mikkelsen, Zeilstra, van der Meer, Versluis, van der Weele, van der Hoef and Kuipers2004) and Duclaux et al. (Reference Duclaux, Caillé, Duez, Ybert, Bocquet and Clanet2007). Equating these non-dimensional pinch-off times and rearranging gives the cutoff between the shallow and deep seal regimes, as shown by the dash-dotted line in figure 6 (
 $We_{c}=1,525Bo_{c}^{-2}$
).
$We_{c}=1,525Bo_{c}^{-2}$
).

Figure 7. The non-dimensional cavity pinch-off time scales with
 $We_{c}$
and
$We_{c}$
and
 $Fr_{c}$
for (a) shallow and (b) deep seal for spheres with contact angle
$Fr_{c}$
for (a) shallow and (b) deep seal for spheres with contact angle
 $\unicode[STIX]{x1D703}=141^{\circ }$
(hollow symbols) and multidroplet streams and jets (solid symbols). The dashed lines are fits to the data with powers forced to
$\unicode[STIX]{x1D703}=141^{\circ }$
(hollow symbols) and multidroplet streams and jets (solid symbols). The dashed lines are fits to the data with powers forced to
 $t_{p}U_{c}/d_{c}=0.67We_{c}^{1/2}$
for shallow seal and
$t_{p}U_{c}/d_{c}=0.67We_{c}^{1/2}$
for shallow seal and
 $t_{p}U_{c}/d_{c}=2.27Fr_{c}^{1/3}$
for deep seal.
$t_{p}U_{c}/d_{c}=2.27Fr_{c}^{1/3}$
for deep seal.
To predict the cutoff for surface seal we look at previous works. Aristoff & Bush (Reference Aristoff and Bush2009) used an empirical fit of
 $We=640$
to define the cutoff for surface seal at low
$We=640$
to define the cutoff for surface seal at low
 $Bo$
while at high
$Bo$
while at high
 $Bo$
Birkhoff & Isaacs (Reference Birkhoff and Isaacs1951) predicted the cutoff to occur at
$Bo$
Birkhoff & Isaacs (Reference Birkhoff and Isaacs1951) predicted the cutoff to occur at
 $Fr=(1/12800)(\unicode[STIX]{x1D70C}/\unicode[STIX]{x1D70C}_{a})^{2}$
, where
$Fr=(1/12800)(\unicode[STIX]{x1D70C}/\unicode[STIX]{x1D70C}_{a})^{2}$
, where
 $\unicode[STIX]{x1D70C}_{a}$
is the air density. We can use these results to find the surface seal cutoff in terms of
$\unicode[STIX]{x1D70C}_{a}$
is the air density. We can use these results to find the surface seal cutoff in terms of
 $We_{c}$
and
$We_{c}$
and
 $Fr_{c}$
. At low
$Fr_{c}$
. At low
 $Bo_{c}$
, the cutoff is
$Bo_{c}$
, the cutoff is
 $We_{c}=640(d_{c}/d)_{mean}$
, where
$We_{c}=640(d_{c}/d)_{mean}$
, where
 $(d_{c}/d)_{mean}\approx 2.5$
is the mean cavity to sphere diameter ratio for the deep and surface seal data just above and below the transition at low
$(d_{c}/d)_{mean}\approx 2.5$
is the mean cavity to sphere diameter ratio for the deep and surface seal data just above and below the transition at low
 $Bo_{c}$
. This leads to a transition at
$Bo_{c}$
. This leads to a transition at
 $We_{c}=1600$
. At high
$We_{c}=1600$
. At high
 $Bo_{c}$
, the cutoff is
$Bo_{c}$
, the cutoff is
 $Fr_{c}=(1/12800)(\unicode[STIX]{x1D70C}/\unicode[STIX]{x1D70C}_{a})^{2}(d/d_{c})_{mean}$
, where
$Fr_{c}=(1/12800)(\unicode[STIX]{x1D70C}/\unicode[STIX]{x1D70C}_{a})^{2}(d/d_{c})_{mean}$
, where
 $(d/d_{c})_{mean}\approx 1.6$
is the mean for the deep and surface seal data just above and below the transition at high
$(d/d_{c})_{mean}\approx 1.6$
is the mean for the deep and surface seal data just above and below the transition at high
 $Bo_{c}$
. This leads to a transition at
$Bo_{c}$
. This leads to a transition at
 $Fr_{c}=44$
or
$Fr_{c}=44$
or
 $We_{c}=44Bo_{c}$
. These transitional lines are shown in figure 6 with the dashed line and appropriately divide the deep and surface seal regimes. It is interesting to note that the shallow, deep and surface seal transition lines intersect at
$We_{c}=44Bo_{c}$
. These transitional lines are shown in figure 6 with the dashed line and appropriately divide the deep and surface seal regimes. It is interesting to note that the shallow, deep and surface seal transition lines intersect at
 $Bo_{c}=1$
, indicating that when surface tension dominates over gravitational forces, shallow seal will always occur instead of deep.
$Bo_{c}=1$
, indicating that when surface tension dominates over gravitational forces, shallow seal will always occur instead of deep.
Seeing the importance of the cavity diameter in calculating
 $Bo_{c}$
and
$Bo_{c}$
and
 $We_{c}$
, we now scale
$We_{c}$
, we now scale
 $d_{c}$
for each pinch-off type. Plotting the non-dimensional cavity diameter
$d_{c}$
for each pinch-off type. Plotting the non-dimensional cavity diameter
 $d_{c}/d$
against
$d_{c}/d$
against
 $We$
we see in figure 8(a) that the cavity diameter for the shallow seal data is a function of
$We$
we see in figure 8(a) that the cavity diameter for the shallow seal data is a function of
 $We$
and can be predicted with a linear fit of
$We$
and can be predicted with a linear fit of
 $d_{c}/d=0.0074We+1$
, where the
$d_{c}/d=0.0074We+1$
, where the
 $y$
-intercept is forced to equal one sphere diameter. We can also predict the cavity diameter for the surface seal data using
$y$
-intercept is forced to equal one sphere diameter. We can also predict the cavity diameter for the surface seal data using
 $We$
with the fit
$We$
with the fit
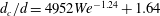 $d_{c}/d=4952We^{-1.24}+1.64$
. As commonly seen, the deep seal data scales better with
$d_{c}/d=4952We^{-1.24}+1.64$
. As commonly seen, the deep seal data scales better with
 $Fr$
, as shown in figure 8(b), and can be predicted by
$Fr$
, as shown in figure 8(b), and can be predicted by
 $d_{c}/d=0.73Fr^{0.18}$
for high
$d_{c}/d=0.73Fr^{0.18}$
for high
 $Fr$
; but below
$Fr$
; but below
 $Fr\approx 7$
the ratio
$Fr\approx 7$
the ratio
 $d_{c}/d$
asymptotes to one.
$d_{c}/d$
asymptotes to one.

Figure 8. The cavity diameter for the impact of spheres with
 $\unicode[STIX]{x1D703}=141^{\circ }$
scales with
$\unicode[STIX]{x1D703}=141^{\circ }$
scales with
 $We$
for shallow and surface seal (a) and
$We$
for shallow and surface seal (a) and
 $Fr$
for deep seal (b). The solid and dashed lines in (a) are least square regressions with
$Fr$
for deep seal (b). The solid and dashed lines in (a) are least square regressions with
 $d_{c}/d=0.0074We+1$
for shallow seal and
$d_{c}/d=0.0074We+1$
for shallow seal and
 $d_{c}/d=4952We^{-1.24}+1.64$
for surface seal. The curved dotted line in (b) is a fit for the deep seal data (
$d_{c}/d=4952We^{-1.24}+1.64$
for surface seal. The curved dotted line in (b) is a fit for the deep seal data (
 $d_{c}/d=0.73Fr^{0.18}$
), but for
$d_{c}/d=0.73Fr^{0.18}$
), but for
 $Fr<7$
the cavity diameter approaches the sphere diameter,
$Fr<7$
the cavity diameter approaches the sphere diameter,
 $d_{c}/d=1$
, marked by the horizontal dotted line.
$d_{c}/d=1$
, marked by the horizontal dotted line.
5 Conclusion
Cavity formation is dependent on the formation and behaviour of the splash crown. Three crown behaviours exist. (1) At low
 $We$
, a slow-moving, thick rim forms around the sphere, which allows air to entrain in the wake of the sphere, forming small cavities. (2) At higher
$We$
, a slow-moving, thick rim forms around the sphere, which allows air to entrain in the wake of the sphere, forming small cavities. (2) At higher
 $We$
, the crown thins, allowing it to adhere to the sphere, and gains velocity, allowing it to climb the surface and meet at the apex prior to full submergence to prevent cavity formation. (3) Once the critical velocity for cavity formation is reached, the splash crown separates from the sphere, forming the classical cavities discussed above and in previous works. The cutoffs between these behaviours are defined by splash crown formation, which is shown to be independent of contact angle for
$We$
, the crown thins, allowing it to adhere to the sphere, and gains velocity, allowing it to climb the surface and meet at the apex prior to full submergence to prevent cavity formation. (3) Once the critical velocity for cavity formation is reached, the splash crown separates from the sphere, forming the classical cavities discussed above and in previous works. The cutoffs between these behaviours are defined by splash crown formation, which is shown to be independent of contact angle for
 $\unicode[STIX]{x1D703}=86^{\circ }$
and
$\unicode[STIX]{x1D703}=86^{\circ }$
and
 $\unicode[STIX]{x1D703}=101^{\circ }$
, and Duez cavity formation, which is dependent on contact angle. For hydrophilic and slightly hydrophobic spheres, the inception of splash crown formation and adherence to the sphere decreases the cavity size, compared to higher contact angles, leading to quasistatic seal and small shallow seal cavities. When the contact angle is high enough (
$\unicode[STIX]{x1D703}=101^{\circ }$
, and Duez cavity formation, which is dependent on contact angle. For hydrophilic and slightly hydrophobic spheres, the inception of splash crown formation and adherence to the sphere decreases the cavity size, compared to higher contact angles, leading to quasistatic seal and small shallow seal cavities. When the contact angle is high enough (
 $\unicode[STIX]{x1D703}\gtrsim 140^{\circ }$
) or the sphere is rough (Zhao et al.
Reference Zhao, Chen and Wang2014), cavities form at all impact velocities because the splash crown either does not form or it separates from the sphere. These cavity formation regimes are predicted by Aristoff & Bush (Reference Aristoff and Bush2009). When cavity formation is not inhibited by the splash, the pinch-off type can be predicted by the cavity diameter and downward cavity velocity regardless of the type of impacting body (e.g., sphere, jet, or multidroplet stream). This forms a more complete picture, linking the impact of solids and liquids on liquid pools.
$\unicode[STIX]{x1D703}\gtrsim 140^{\circ }$
) or the sphere is rough (Zhao et al.
Reference Zhao, Chen and Wang2014), cavities form at all impact velocities because the splash crown either does not form or it separates from the sphere. These cavity formation regimes are predicted by Aristoff & Bush (Reference Aristoff and Bush2009). When cavity formation is not inhibited by the splash, the pinch-off type can be predicted by the cavity diameter and downward cavity velocity regardless of the type of impacting body (e.g., sphere, jet, or multidroplet stream). This forms a more complete picture, linking the impact of solids and liquids on liquid pools.
Acknowledgements
N.B.S., T.T.T. and J.B. acknowledge funding from the Office of Naval Research, Navy Undersea Research Program (grant N0001414WX00811), monitored by Ms Maria Medeiros. J.B. acknowledges funding from the Naval Undersea Warfare Center In-House Laboratory Independent Research programme, monitored by Mr N. Dubois. N.B.S. and T.T.T. acknowledge funding from the Utah State University Research and Graduate Studies Development Grant Program.
Supplementary movies
Supplementary movies are available at https://doi.org/10.1017/jfm.2018.985.


