


1 Introduction
The deformation of an interface between two separated fluids (e.g. air and water) by a solid projectile passing through it is a famous classical fluid dynamics problem. Despite the simple configuration, the subsequent phenomena such as the formation and evolution of a splash, jet and cavity above and below the free surface exhibit complex variations depending on the body geometry, fluid and material properties and impact conditions (Duclaux et al. Reference Duclaux, Caille, Duez, Ybert, Bocquet and Clanet2007; Duez et al. Reference Duez, Ybert, Clanet and Bocquet2007; Aristoff & Bush Reference Aristoff and Bush2009; Truscott, Epps & Techet Reference Truscott, Epps and Techet2012; Truscott, Epps & Belden Reference Truscott, Epps and Belden2014). These variations are important because the unsteady dynamics of these interfacial features is closely related to changes in the hydrodynamic loading of the projectile. For example, Truscott et al. (Reference Truscott, Epps and Techet2012) studied a sphere descending underwater and showed that the pressure near the front stagnation position dominates the flow around the sphere when there is a cavity, while the case without a cavity is affected by the added mass, buoyancy and wake defect. Water entry has also been investigated as a simplified problem to understand the underlying physics of ship slamming (Zhao & Faltinsen Reference Zhao and Faltinsen1993), air-to-seawater ballistics for military applications (May Reference May1952; Yao et al. Reference Yao, Wang, Pan, Wang and Woding2014), the stability of offshore structures (Sun & Faltinsen Reference Sun and Faltinsen2006), sports engineering topics such as diving and rowing (Harrison et al. Reference Harrison, Cohen, Cleary, Barris and Rose2016), stone skipping (Clanet, Hersen & Bocquet Reference Clanet, Hersen and Bocquet2004; Rosellini et al. Reference Rosellini, Hersen, Clanet and Bocquet2005), film coating in chemical processes (Benkreira & Khan Reference Benkreira and Khan2008) and so on. Recently, regarding the role of a cavity, the flow condition for a near-zero drag projectile has been investigated as well (Vakarelski et al. Reference Vakarelski, Klaseboer, Jetly, Mansoor, Aguirre-Pablo, Chan and Thoroddsen2017).
As reviewed by Truscott et al. (Reference Truscott, Epps and Belden2014), the general picture of free-surface deformation due to an impacting body involves the unsteady processes of a splash, cavity and jet flow. For example, as a sphere enters water with cavity formation, a jet is first ejected in the radial direction above the free surface, and a splash is then formed. When the Weber number is sufficiently high, the splash converges into a dome (Aristoff & Bush Reference Aristoff and Bush2009; Marston et al. Reference Marston, Truscott, Speirs, Mansoor and Thoroddsen2016). Below the free surface, the cavity pinches off due to the hydrostatic pressure (called a deep seal), and the dome comes down to the free surface to prevent further cavity expansion (surface seal). While the deep seal occurs near the midpoint between the free surface and the body, the pinch-off occurring close to the free surface is called a shallow seal. When the pinch-off occurs close to the body, leaving almost no cavity bubble attached to the body, it is classified as a quasi-static seal (Aristoff & Bush Reference Aristoff and Bush2009). When the sphere enters a free surface without forming a cavity, a thin jet is induced above the free surface instead of a splash. Although this interesting phenomenon was reported a long time ago (Worthington Reference Worthington1908), recent advances in high-speed imaging have spurred the accumulation of relevant data and theoretical analysis in the past decade (Lee, Longoria & Wilson Reference Lee, Longoria and Wilson1997; Duclaux et al. Reference Duclaux, Caille, Duez, Ybert, Bocquet and Clanet2007; Aristoff & Bush Reference Aristoff and Bush2009; Aristoff et al. Reference Aristoff, Truscott, Techet and Bush2010; Truscott et al. Reference Truscott, Epps and Techet2012).
The entry of a solid object (characteristic size
 $R$
and downward impact speed of
$R$
and downward impact speed of
 $U_{\circ }$
at the interface) into a liquid is affected by the surface tension, fluid properties (density and viscosity), solid properties (density), surface conditions of the object (roughness and wettability) and gravity. Thus, it is possible to characterize the qualitative picture of a water entry with dimensionless parameters such as the Froude number (
$U_{\circ }$
at the interface) into a liquid is affected by the surface tension, fluid properties (density and viscosity), solid properties (density), surface conditions of the object (roughness and wettability) and gravity. Thus, it is possible to characterize the qualitative picture of a water entry with dimensionless parameters such as the Froude number (
 $Fr=U_{\circ }^{2}/gR$
), Reynolds number (
$Fr=U_{\circ }^{2}/gR$
), Reynolds number (
 $Re=\unicode[STIX]{x1D70C}U_{\circ }R/\unicode[STIX]{x1D707}$
), Weber number (
$Re=\unicode[STIX]{x1D70C}U_{\circ }R/\unicode[STIX]{x1D707}$
), Weber number (
 $We=\unicode[STIX]{x1D70C}U_{\circ }^{2}R/\unicode[STIX]{x1D70E}$
), Bond number (
$We=\unicode[STIX]{x1D70C}U_{\circ }^{2}R/\unicode[STIX]{x1D70E}$
), Bond number (
 $Bo=\unicode[STIX]{x1D70C}gR^{2}/\unicode[STIX]{x1D70E}$
), capillary number (
$Bo=\unicode[STIX]{x1D70C}gR^{2}/\unicode[STIX]{x1D70E}$
), capillary number (
 $Ca=\unicode[STIX]{x1D707}U_{\circ }/\unicode[STIX]{x1D70E}$
) and solid–liquid density ratio (
$Ca=\unicode[STIX]{x1D707}U_{\circ }/\unicode[STIX]{x1D70E}$
) and solid–liquid density ratio (
 $d=\unicode[STIX]{x1D70C}_{s}/\unicode[STIX]{x1D70C}$
). Here,
$d=\unicode[STIX]{x1D70C}_{s}/\unicode[STIX]{x1D70C}$
). Here,
 $\unicode[STIX]{x1D70E}$
is the surface tension,
$\unicode[STIX]{x1D70E}$
is the surface tension,
 $\unicode[STIX]{x1D707}$
and
$\unicode[STIX]{x1D707}$
and
 $\unicode[STIX]{x1D70C}$
are the dynamic viscosity and density of the liquid, respectively,
$\unicode[STIX]{x1D70C}$
are the dynamic viscosity and density of the liquid, respectively,
 $\unicode[STIX]{x1D70C}_{s}$
is the solid density and
$\unicode[STIX]{x1D70C}_{s}$
is the solid density and
 $g$
is the gravitational acceleration. For example, Thoroddsen et al. (Reference Thoroddsen, Etoh, Takehara and Takano2004) experimentally demonstrated that a radial jet appears approximately
$g$
is the gravitational acceleration. For example, Thoroddsen et al. (Reference Thoroddsen, Etoh, Takehara and Takano2004) experimentally demonstrated that a radial jet appears approximately
 $8~\unicode[STIX]{x03BC}\text{s}$
after a sphere first contacts a free surface at
$8~\unicode[STIX]{x03BC}\text{s}$
after a sphere first contacts a free surface at
 $Re\simeq 10^{5}$
and that its velocity is proportional to
$Re\simeq 10^{5}$
and that its velocity is proportional to
 $U_{\circ }^{0.5}$
. Marston, Vakarelski & Thoroddsen (Reference Marston, Vakarelski and Thoroddsen2011) observed that air is trapped between the free surface and front part of a sphere at the instant of impact (when
$U_{\circ }^{0.5}$
. Marston, Vakarelski & Thoroddsen (Reference Marston, Vakarelski and Thoroddsen2011) observed that air is trapped between the free surface and front part of a sphere at the instant of impact (when
 $We>1$
) and shrinks from a sheet to a bubble as the sphere descends at
$We>1$
) and shrinks from a sheet to a bubble as the sphere descends at
 $Ca<1$
and
$Ca<1$
and
 $Re>1000$
. Marston et al. (Reference Marston, Truscott, Speirs, Mansoor and Thoroddsen2016) showed that surface tension plays an important role along with pressure at the moment of splash closing. While the splash width increases as the air pressure decreases during splash growth, the rate of collapse later is more influenced by surface tension for
$Re>1000$
. Marston et al. (Reference Marston, Truscott, Speirs, Mansoor and Thoroddsen2016) showed that surface tension plays an important role along with pressure at the moment of splash closing. While the splash width increases as the air pressure decreases during splash growth, the rate of collapse later is more influenced by surface tension for
 $We=\boldsymbol{O}(10^{3}{-}10^{5})$
and
$We=\boldsymbol{O}(10^{3}{-}10^{5})$
and
 $Re=\boldsymbol{O}(10^{4}{-}10^{5})$
. Below the free surface, a cavity is formed when the capillary number (
$Re=\boldsymbol{O}(10^{4}{-}10^{5})$
. Below the free surface, a cavity is formed when the capillary number (
 $Ca$
) exceeds a critical value (Dussan Reference Dussan1979; Duez et al.
Reference Duez, Ybert, Clanet and Bocquet2007) and pinches off due to the hydrostatic pressure. Mansoor et al. (Reference Mansoor, Marston, Vakarelski and Thoroddsen2014) found that a deep seal occurs before a surface seal or is reversed depending on
$Ca$
) exceeds a critical value (Dussan Reference Dussan1979; Duez et al.
Reference Duez, Ybert, Clanet and Bocquet2007) and pinches off due to the hydrostatic pressure. Mansoor et al. (Reference Mansoor, Marston, Vakarelski and Thoroddsen2014) found that a deep seal occurs before a surface seal or is reversed depending on
 $Fr$
. With a surface seal, the ratio between the distances from the free surface to the pinch-off location (
$Fr$
. With a surface seal, the ratio between the distances from the free surface to the pinch-off location (
 $H_{p}$
) and the impacting sphere centre (
$H_{p}$
) and the impacting sphere centre (
 $H$
) decreases with increasing
$H$
) decreases with increasing
 $Fr$
(when
$Fr$
(when
 $Fr>100$
). By varying the density of a falling sphere, Aristoff et al. (Reference Aristoff, Truscott, Techet and Bush2010) showed that the cavity pinch-off position and time (
$Fr>100$
). By varying the density of a falling sphere, Aristoff et al. (Reference Aristoff, Truscott, Techet and Bush2010) showed that the cavity pinch-off position and time (
 $t_{p}$
) increase linearly with
$t_{p}$
) increase linearly with
 $Fr$
, while
$Fr$
, while
 $H_{p}/H$
remains almost constant when the momentum loss of the impacting sphere is small. This behaviour agrees with the results obtained by Duclaux et al. (Reference Duclaux, Caille, Duez, Ybert, Bocquet and Clanet2007), who found that
$H_{p}/H$
remains almost constant when the momentum loss of the impacting sphere is small. This behaviour agrees with the results obtained by Duclaux et al. (Reference Duclaux, Caille, Duez, Ybert, Bocquet and Clanet2007), who found that
 $H_{p}/H$
is constant at 0.5 when
$H_{p}/H$
is constant at 0.5 when
 $Fr<1000$
. The larger
$Fr<1000$
. The larger
 $Fr$
is, the larger the volume of air is that is attached to the sphere after pinch-off. When the water entry of a projectile does not involve cavity formation, a thin liquid film moves up along the sphere surface after impact, which is followed by a jet flow rising in two steps from the top of the sphere (Kuwabara, Tanba & Kono Reference Kuwabara, Tanba and Kono1987). The dimensionless initial velocities of the first and second jet flows are approximately constant irrespective of the
$Fr$
is, the larger the volume of air is that is attached to the sphere after pinch-off. When the water entry of a projectile does not involve cavity formation, a thin liquid film moves up along the sphere surface after impact, which is followed by a jet flow rising in two steps from the top of the sphere (Kuwabara, Tanba & Kono Reference Kuwabara, Tanba and Kono1987). The dimensionless initial velocities of the first and second jet flows are approximately constant irrespective of the
 $Re$
of
$Re$
of
 $\boldsymbol{O}(10^{4})$
. Kubota & Mochizuki (Reference Kubota and Mochizuki2009) reported that the larger
$\boldsymbol{O}(10^{4})$
. Kubota & Mochizuki (Reference Kubota and Mochizuki2009) reported that the larger
 $We$
is, the more the liquid film (jet) is broken into droplets.
$We$
is, the more the liquid film (jet) is broken into droplets.
In addition, the body surface condition can change the global picture of water entry. For example, the static contact angle (
 $\unicode[STIX]{x1D703}_{c}$
) is known to be an important parameter in defining surface wettability. Duez et al. (Reference Duez, Ybert, Clanet and Bocquet2007) explained that the minimum impact velocity required to form a cavity is proportional to the capillary velocity, which is the ratio of surface tension to liquid viscosity. The critical velocity of an impacting sphere with a hydrophilic surface (
$\unicode[STIX]{x1D703}_{c}$
) is known to be an important parameter in defining surface wettability. Duez et al. (Reference Duez, Ybert, Clanet and Bocquet2007) explained that the minimum impact velocity required to form a cavity is proportional to the capillary velocity, which is the ratio of surface tension to liquid viscosity. The critical velocity of an impacting sphere with a hydrophilic surface (
 $\unicode[STIX]{x1D703}_{c}<90^{\circ }$
) is proportional to the capillary velocity, while that of a sphere with a hydrophobic surface (
$\unicode[STIX]{x1D703}_{c}<90^{\circ }$
) is proportional to the capillary velocity, while that of a sphere with a hydrophobic surface (
 $\unicode[STIX]{x1D703}_{c}>90^{\circ }$
) is proportional to
$\unicode[STIX]{x1D703}_{c}>90^{\circ }$
) is proportional to
 $\unicode[STIX]{x1D703}_{c}^{3}$
as well as the capillary velocity. Therefore, a hydrophobic sphere creates a cavity even at a relatively low impact velocity. Although it has not been investigated in detail, even slight surface contamination (i.e. roughness) would also lead to cavity formation behind a submerging body under conditions where the smooth counterpart would not (Worthington Reference Worthington1908; May Reference May1951; Grumstrup, Keller & Belmonte Reference Grumstrup, Keller and Belmonte2007; Zhao, Chen & Wang Reference Zhao, Chen and Wang2014).
$\unicode[STIX]{x1D703}_{c}^{3}$
as well as the capillary velocity. Therefore, a hydrophobic sphere creates a cavity even at a relatively low impact velocity. Although it has not been investigated in detail, even slight surface contamination (i.e. roughness) would also lead to cavity formation behind a submerging body under conditions where the smooth counterpart would not (Worthington Reference Worthington1908; May Reference May1951; Grumstrup, Keller & Belmonte Reference Grumstrup, Keller and Belmonte2007; Zhao, Chen & Wang Reference Zhao, Chen and Wang2014).
It is clear that our knowledge about the solid–fluid interactions occurring at free surfaces has increased significantly. However, most previous studies have considered the entry of spheres, and it is necessary to extend our understanding to different shapes. For example, an elongated cylindrical projectile (of length
 $L$
) is more closely connected to practical applications such as expendable bathythermographs and naval weapons. Actually, some studies have focused on the entry of non-spherical impacting bodies. Bodily, Carlson & Truscott (Reference Bodily, Carlson and Truscott2014) conducted experiments with a long axisymmetric body (aspect ratio,
$L$
) is more closely connected to practical applications such as expendable bathythermographs and naval weapons. Actually, some studies have focused on the entry of non-spherical impacting bodies. Bodily, Carlson & Truscott (Reference Bodily, Carlson and Truscott2014) conducted experiments with a long axisymmetric body (aspect ratio,
 $AR=L/(2R)=10$
) with
$AR=L/(2R)=10$
) with
 $Fr=56{-}80$
,
$Fr=56{-}80$
,
 $Re=3.4{-}4.0\times 10^{4}$
and
$Re=3.4{-}4.0\times 10^{4}$
and
 $We=1235{-}1710$
and observed how the entry angle, nose shape and position of the centre of mass affect its trajectory after impact. They showed that the projectile moves in the lateral direction as the entry angle increases (i.e. it deviates more from the vertical axis), the nose shape becomes conical, and the centre of mass moves farther from the nose. Cavity pinch-off occurs twice: first at the side of the body and then in the wake. Gekle et al. (Reference Gekle, van der Bos, Bergmann, van der Meer and Lohse2008) showed that the location of cavity pinch-off behind a cylinder (
$We=1235{-}1710$
and observed how the entry angle, nose shape and position of the centre of mass affect its trajectory after impact. They showed that the projectile moves in the lateral direction as the entry angle increases (i.e. it deviates more from the vertical axis), the nose shape becomes conical, and the centre of mass moves farther from the nose. Cavity pinch-off occurs twice: first at the side of the body and then in the wake. Gekle et al. (Reference Gekle, van der Bos, Bergmann, van der Meer and Lohse2008) showed that the location of cavity pinch-off behind a cylinder (
 $AR=3.7$
) is not linearly proportional to
$AR=3.7$
) is not linearly proportional to
 $Fr$
, unlike in the case of a sphere. Aristoff & Bush (Reference Aristoff and Bush2009) demonstrated that the cavity behind a long cylinder (
$Fr$
, unlike in the case of a sphere. Aristoff & Bush (Reference Aristoff and Bush2009) demonstrated that the cavity behind a long cylinder (
 $AR=75$
) is formed in a narrow region behind the tail. Yao et al. (Reference Yao, Wang, Pan, Wang and Woding2014) tried to predict the trajectory and cavity shape of a bullet-shaped projectile (
$AR=75$
) is formed in a narrow region behind the tail. Yao et al. (Reference Yao, Wang, Pan, Wang and Woding2014) tried to predict the trajectory and cavity shape of a bullet-shaped projectile (
 $AR=5.7$
,
$AR=5.7$
,
 $Re=1.3\times 10^{5}$
and
$Re=1.3\times 10^{5}$
and
 $Fr=2600$
) using a theoretical approach (Duclaux et al.
Reference Duclaux, Caille, Duez, Ybert, Bocquet and Clanet2007; Aristoff & Bush Reference Aristoff and Bush2009), and showed that their predictions agree with the experimental results before cavity pinch-off occurs.
$Fr=2600$
) using a theoretical approach (Duclaux et al.
Reference Duclaux, Caille, Duez, Ybert, Bocquet and Clanet2007; Aristoff & Bush Reference Aristoff and Bush2009), and showed that their predictions agree with the experimental results before cavity pinch-off occurs.
Thus, it is necessary to study free-surface deformation occurring upon the entry of a cylindrical body in more detail. In particular, it is of great interest to examine the effects of the projectile
 $AR$
in the cases with and without cavity formation. In the present study, we experimentally investigate the vertical free fall of a slender solid body (whose nose and tail parts have hemispherical shapes) onto an air–water interface. We focus on measuring the morphing of the free surface into a jet/splash and an underwater cavity via high-speed imaging.
$AR$
in the cases with and without cavity formation. In the present study, we experimentally investigate the vertical free fall of a slender solid body (whose nose and tail parts have hemispherical shapes) onto an air–water interface. We focus on measuring the morphing of the free surface into a jet/splash and an underwater cavity via high-speed imaging.
 $AR$
is varied from 1.0 (sphere) to 8.0. The non-dimensional variables are
$AR$
is varied from 1.0 (sphere) to 8.0. The non-dimensional variables are
 $Fr=32{-}90$
,
$Fr=32{-}90$
,
 $Re=5{-}8.4\times 10^{4}$
,
$Re=5{-}8.4\times 10^{4}$
,
 $We=1700{-}5000$
,
$We=1700{-}5000$
,
 $Bo=55$
and
$Bo=55$
and
 $Ca=0.03{-}0.06$
, for which no cavity would be formed by the water entry of a hydrophilic object. Since cavity formation and growth are of great interest, we also test the cavity-forming case by roughening the nose part of each projectile. To the best of our knowledge, this is the first study in which the effects of the
$Ca=0.03{-}0.06$
, for which no cavity would be formed by the water entry of a hydrophilic object. Since cavity formation and growth are of great interest, we also test the cavity-forming case by roughening the nose part of each projectile. To the best of our knowledge, this is the first study in which the effects of the
 $AR$
of a projectile on water entry have been systematically investigated, comparing the cases with and without cavity formation.
$AR$
of a projectile on water entry have been systematically investigated, comparing the cases with and without cavity formation.
The paper is organized as follows. In § 2, we explain the experimental set-up, including the high-speed imaging technique, and characterize the considered impacting bodies. The water entry of a projectile with a smooth surface (without a cavity) is discussed in § 3. In § 4, we address the case with a roughened surface (with a cavity). In § 5, we further examine the effects of a cavity on the hydrodynamic force acting on a sinking body. A summary and the conclusions are given in § 6.
2 Experimental set-up and procedures
In the present study, the water entry of a cylindrical body is measured in a large acrylic tank (
 $800\times 800\times 1000~\text{mm}^{3}$
) filled with tap water (static), as shown in figure 1(a). The projectiles (made of acrylic) have the form of spheres extended along the longitudinal direction (length
$800\times 800\times 1000~\text{mm}^{3}$
) filled with tap water (static), as shown in figure 1(a). The projectiles (made of acrylic) have the form of spheres extended along the longitudinal direction (length
 $L$
); i.e. both the nose and tail parts are hemispherical (radius
$L$
); i.e. both the nose and tail parts are hemispherical (radius
 $R=0.5D=20~\text{mm}$
) and
$R=0.5D=20~\text{mm}$
) and
 $AR$
(
$AR$
(
 $=L/D$
) is set to 1.0 (sphere), 2.0, 4.0 and 8.0 (figure 1
b). Thus, the ratio of body diameter (
$=L/D$
) is set to 1.0 (sphere), 2.0, 4.0 and 8.0 (figure 1
b). Thus, the ratio of body diameter (
 $D$
) to tank width is
$D$
) to tank width is
 $D/D_{tank}=0.05$
, which satisfies the criterion of
$D/D_{tank}=0.05$
, which satisfies the criterion of
 $D/D_{tank}<0.075$
, at which the tank side walls negligibly affect the measurements according to Mansoor et al. (Reference Mansoor, Marston, Vakarelski and Thoroddsen2014). The solid-to-liquid density ratio (
$D/D_{tank}<0.075$
, at which the tank side walls negligibly affect the measurements according to Mansoor et al. (Reference Mansoor, Marston, Vakarelski and Thoroddsen2014). The solid-to-liquid density ratio (
 $d=\unicode[STIX]{x1D70C}_{s}/\unicode[STIX]{x1D70C}$
) is approximately 1.2.
$d=\unicode[STIX]{x1D70C}_{s}/\unicode[STIX]{x1D70C}$
) is approximately 1.2.
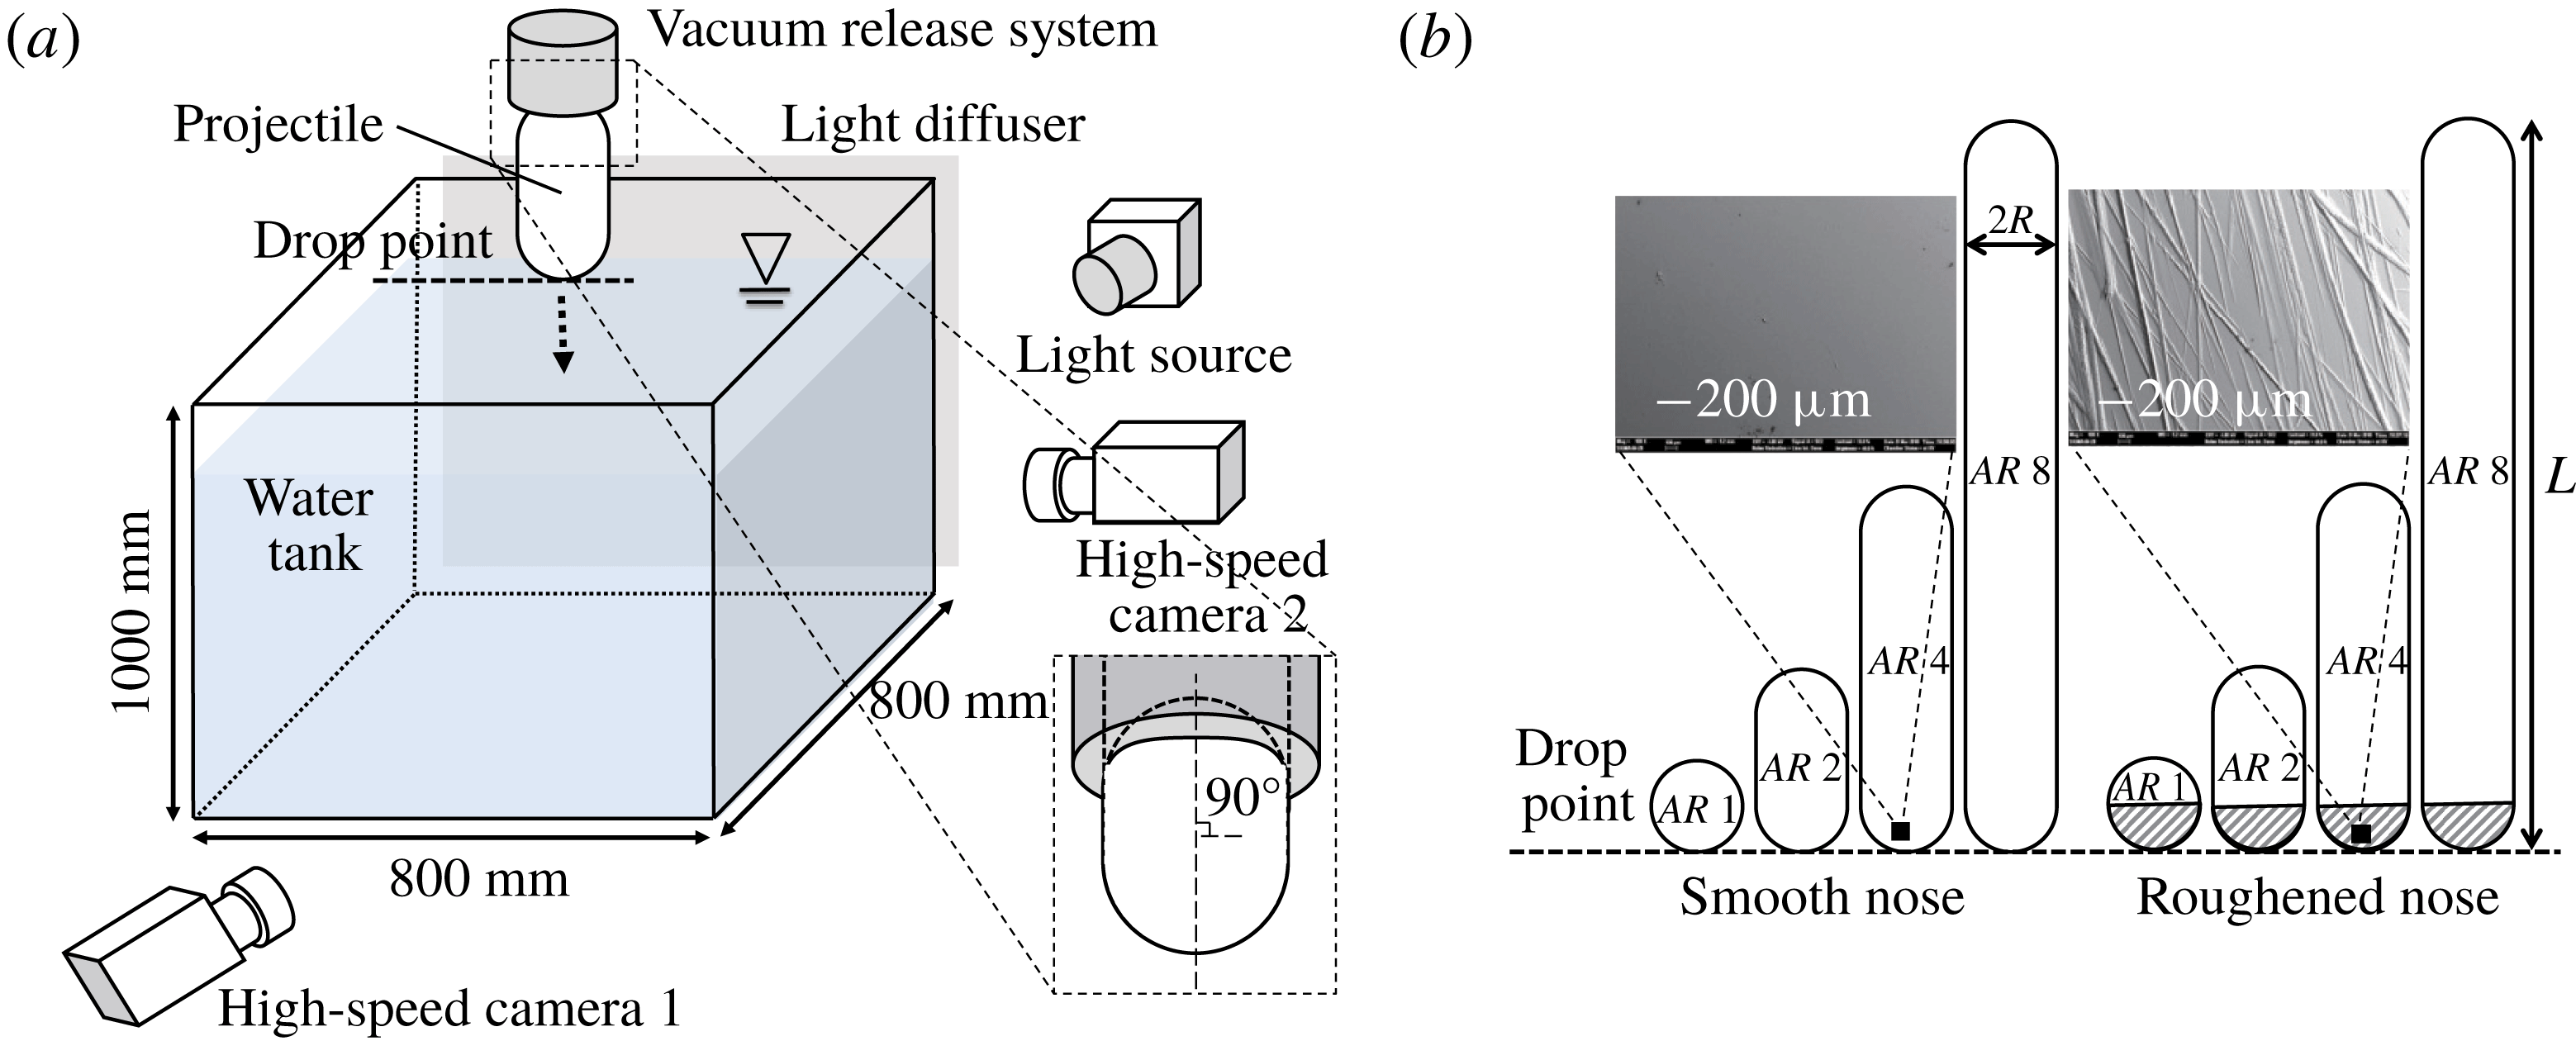
Figure 1. (a) Experimental set-up for measuring the water entry of a projectile via high-speed imaging. (b) Geometry of the projectiles used in the present study.
 $AR$
is varied as 1.0, 2.0, 4.0 and 8.0, and two types of surfaces (smooth and rough) are used for the nose part. In (b), the insets are the scanning electron microscopy (SEM) images of the smooth and rough surfaces.
$AR$
is varied as 1.0, 2.0, 4.0 and 8.0, and two types of surfaces (smooth and rough) are used for the nose part. In (b), the insets are the scanning electron microscopy (SEM) images of the smooth and rough surfaces.
To control the cavity formation, we roughened the nose (front hemispherical part) of each projectile with sandpaper (grit number 60). Previously, Zhao et al. (Reference Zhao, Chen and Wang2014) showed that the critical impact velocity for cavity formation dramatically decreases when the surface of an impacting body is rough. Scanning electron microscopy (SEM) images of smooth and rough surfaces were taken (see the insets in figure 1
b) and conventional binarization (Otsu Reference Otsu1979) was applied to quantify the roughness. We calculated the mean roughness (
 $R_{a}$
), which is defined as the sum of the vertical deviations divided by the sample length, and was equal to
$R_{a}$
), which is defined as the sum of the vertical deviations divided by the sample length, and was equal to
 $0.26~\unicode[STIX]{x03BC}\text{m}$
and
$0.26~\unicode[STIX]{x03BC}\text{m}$
and
 $12.98~\unicode[STIX]{x03BC}\text{m}$
for the smooth and rough surfaces, respectively. In total, eight different projectiles were tested (figure 1
b). To achieve the free fall of each projectile, it was first attached to an in-house vacuum release system, which was positioned directly above the centre of the water tank. The set-up was designed such that the release height could be adjusted to change the impact speed at the free surface. To guarantee the vertical fall of each body, a hollow cylinder (supporting jig) with an inner diameter equal to the projectile size was fitted on the outer surface of the projectile (see figure 1
a for details) when it was held by a vacuum pump (Rocker 300, Rocker) that could de-pressurize below 90 kPa (
$12.98~\unicode[STIX]{x03BC}\text{m}$
for the smooth and rough surfaces, respectively. In total, eight different projectiles were tested (figure 1
b). To achieve the free fall of each projectile, it was first attached to an in-house vacuum release system, which was positioned directly above the centre of the water tank. The set-up was designed such that the release height could be adjusted to change the impact speed at the free surface. To guarantee the vertical fall of each body, a hollow cylinder (supporting jig) with an inner diameter equal to the projectile size was fitted on the outer surface of the projectile (see figure 1
a for details) when it was held by a vacuum pump (Rocker 300, Rocker) that could de-pressurize below 90 kPa (
 ${\sim}90\,\%$
of atmospheric pressure). Before release, the jig was adjusted to align the projectile normal to the water surface; the jig was removed before release so as not to interfere with the falling projectile. During the measurements, it was also visually confirmed that the major axis of the projectile was normal to the water surface at the instant of impact (deviation within
${\sim}90\,\%$
of atmospheric pressure). Before release, the jig was adjusted to align the projectile normal to the water surface; the jig was removed before release so as not to interfere with the falling projectile. During the measurements, it was also visually confirmed that the major axis of the projectile was normal to the water surface at the instant of impact (deviation within
 $0.53^{\circ }$
from the vertical axis). For each projectile, the vertical position of the drop point was matched with the front stagnation point (figure 1) such that the nose tip travelled the same distance before impact, regardless of
$0.53^{\circ }$
from the vertical axis). For each projectile, the vertical position of the drop point was matched with the front stagnation point (figure 1) such that the nose tip travelled the same distance before impact, regardless of
 $AR$
. In addition to
$AR$
. In addition to
 $AR$
, we also varied the impact speed (
$AR$
, we also varied the impact speed (
 $U_{\circ }$
), setting it equal to
$U_{\circ }$
), setting it equal to
 $2.5$
and
$2.5$
and
 $4.2~\text{m}~\text{s}^{-1}$
. The corresponding non-dimensional variables are summarized in table 1.
$4.2~\text{m}~\text{s}^{-1}$
. The corresponding non-dimensional variables are summarized in table 1.
Table 1. Dimensionless variables corresponding to tested conditions. The experiments are conducted with tap water (
 $\unicode[STIX]{x1D70C}=1000~\text{kg}~\text{m}^{-3}$
,
$\unicode[STIX]{x1D70C}=1000~\text{kg}~\text{m}^{-3}$
,
 $\unicode[STIX]{x1D70E}=0.0725~\text{N}~\text{m}^{-1}$
,
$\unicode[STIX]{x1D70E}=0.0725~\text{N}~\text{m}^{-1}$
,
 $\unicode[STIX]{x1D708}=10^{-6}~\text{m}^{2}~\text{s}^{-1}$
and
$\unicode[STIX]{x1D708}=10^{-6}~\text{m}^{2}~\text{s}^{-1}$
and
 $\unicode[STIX]{x1D707}=0.001~\text{N}~\text{s}~\text{m}^{-2}$
) and
$\unicode[STIX]{x1D707}=0.001~\text{N}~\text{s}~\text{m}^{-2}$
) and
 $g=9.81~\text{m}~\text{s}^{-2}$
.
$g=9.81~\text{m}~\text{s}^{-2}$
.
To measure the free-surface deformation, we used one or two high-speed cameras (SpeedSense M310, Dantec Dynamics) that could capture images at 3200 f.p.s. (
 $1280~\text{pixel}\times 800~\text{pixel}$
) and 10 000 f.p.s. (
$1280~\text{pixel}\times 800~\text{pixel}$
) and 10 000 f.p.s. (
 $560~\text{pixel}\times 448~\text{pixel}$
). Tungsten lamps (Openface 750W, ARRI) were used as light sources. The camera, equipped with a 105 mm lens (Nikon), was moved in the vertical direction to measure the flow structures above and below the water surface. To obtain statistically meaningful data, more than 10 independent measurements were performed and analysed for each projectile. The temperature in the laboratory was maintained at approximately
$560~\text{pixel}\times 448~\text{pixel}$
). Tungsten lamps (Openface 750W, ARRI) were used as light sources. The camera, equipped with a 105 mm lens (Nikon), was moved in the vertical direction to measure the flow structures above and below the water surface. To obtain statistically meaningful data, more than 10 independent measurements were performed and analysed for each projectile. The temperature in the laboratory was maintained at approximately
 $25\,^{\circ }\text{C}$
, and a break of more than 30 min was included between individual measurements to avoid any disturbance from the previous measurement. With the present set-up, the spatial and temporal resolutions of the measurements were
$25\,^{\circ }\text{C}$
, and a break of more than 30 min was included between individual measurements to avoid any disturbance from the previous measurement. With the present set-up, the spatial and temporal resolutions of the measurements were
 $0.005D$
and
$0.005D$
and
 $0.03D/U_{\circ }$
, respectively, which are believed to be sufficient to capture the phenomena. Once the high-speed images of the deformed free surface were obtained, they were processed further to detect and track their profiles. We used Matlab code written in-house to obtain the statistical data from the raw images. If necessary, image filters embedded in Matlab, such as a Wiener filter, were used to enhance the signal-to-noise ratio of the data. To track the trajectory of each descending body, we used a Hough function to detect the centre of a sphere (
$0.03D/U_{\circ }$
, respectively, which are believed to be sufficient to capture the phenomena. Once the high-speed images of the deformed free surface were obtained, they were processed further to detect and track their profiles. We used Matlab code written in-house to obtain the statistical data from the raw images. If necessary, image filters embedded in Matlab, such as a Wiener filter, were used to enhance the signal-to-noise ratio of the data. To track the trajectory of each descending body, we used a Hough function to detect the centre of a sphere (
 $AR=1$
). For
$AR=1$
). For
 $AR>1$
, we tracked the midpoints of the centres of the hemispherical head and tail parts of the projectile.
$AR>1$
, we tracked the midpoints of the centres of the hemispherical head and tail parts of the projectile.
To support our analysis, if necessary, we measured the velocity field in the gas (air) and liquid (water) phases induced by the entry of the projectile, via high-speed particle image velocimetry. A green laser sheet (532 nm wavelength) from a continuous-wave laser (RayPower 5000, Dantec Dynamics) illuminated the region around the falling body. As tracers, we used
 $10~\unicode[STIX]{x03BC}\text{m}$
-sized hollow glass spheres (110P8, Potters Industries Inc.) for the liquid phase and oil droplets (approximately
$10~\unicode[STIX]{x03BC}\text{m}$
-sized hollow glass spheres (110P8, Potters Industries Inc.) for the liquid phase and oil droplets (approximately
 $1~\unicode[STIX]{x03BC}\text{m}$
in size) produced by a fog generator (Safex, Dantec Dynamics) for the gas phase. While evaluating the velocity field, a moving mask was applied to the area occupied by the falling body. The raw image was first binarized to eliminate the particle images, thereby highlighting the outer profile of the projectile. Then, the data obtained by applying cross-correlation to the raw particle image were masked. In taking particle images for the gas phase, the pixel intensity of the falling object differed noticeably from that of the background, but the splash could distort the particle images captured through the liquid sheet. Therefore, the splash was masked in the same way as done for the moving projectile. Spurious vectors were replaced by interpolation via the Gaussian weight kernel method (Agüí & Jiménez Reference Agüí and Jiménez1987; Landreth & Adrian Reference Landreth and Adrian1990). The spatial resolution of the velocity measurements was approximately
$1~\unicode[STIX]{x03BC}\text{m}$
in size) produced by a fog generator (Safex, Dantec Dynamics) for the gas phase. While evaluating the velocity field, a moving mask was applied to the area occupied by the falling body. The raw image was first binarized to eliminate the particle images, thereby highlighting the outer profile of the projectile. Then, the data obtained by applying cross-correlation to the raw particle image were masked. In taking particle images for the gas phase, the pixel intensity of the falling object differed noticeably from that of the background, but the splash could distort the particle images captured through the liquid sheet. Therefore, the splash was masked in the same way as done for the moving projectile. Spurious vectors were replaced by interpolation via the Gaussian weight kernel method (Agüí & Jiménez Reference Agüí and Jiménez1987; Landreth & Adrian Reference Landreth and Adrian1990). The spatial resolution of the velocity measurements was approximately
 $0.025D$
.
$0.025D$
.
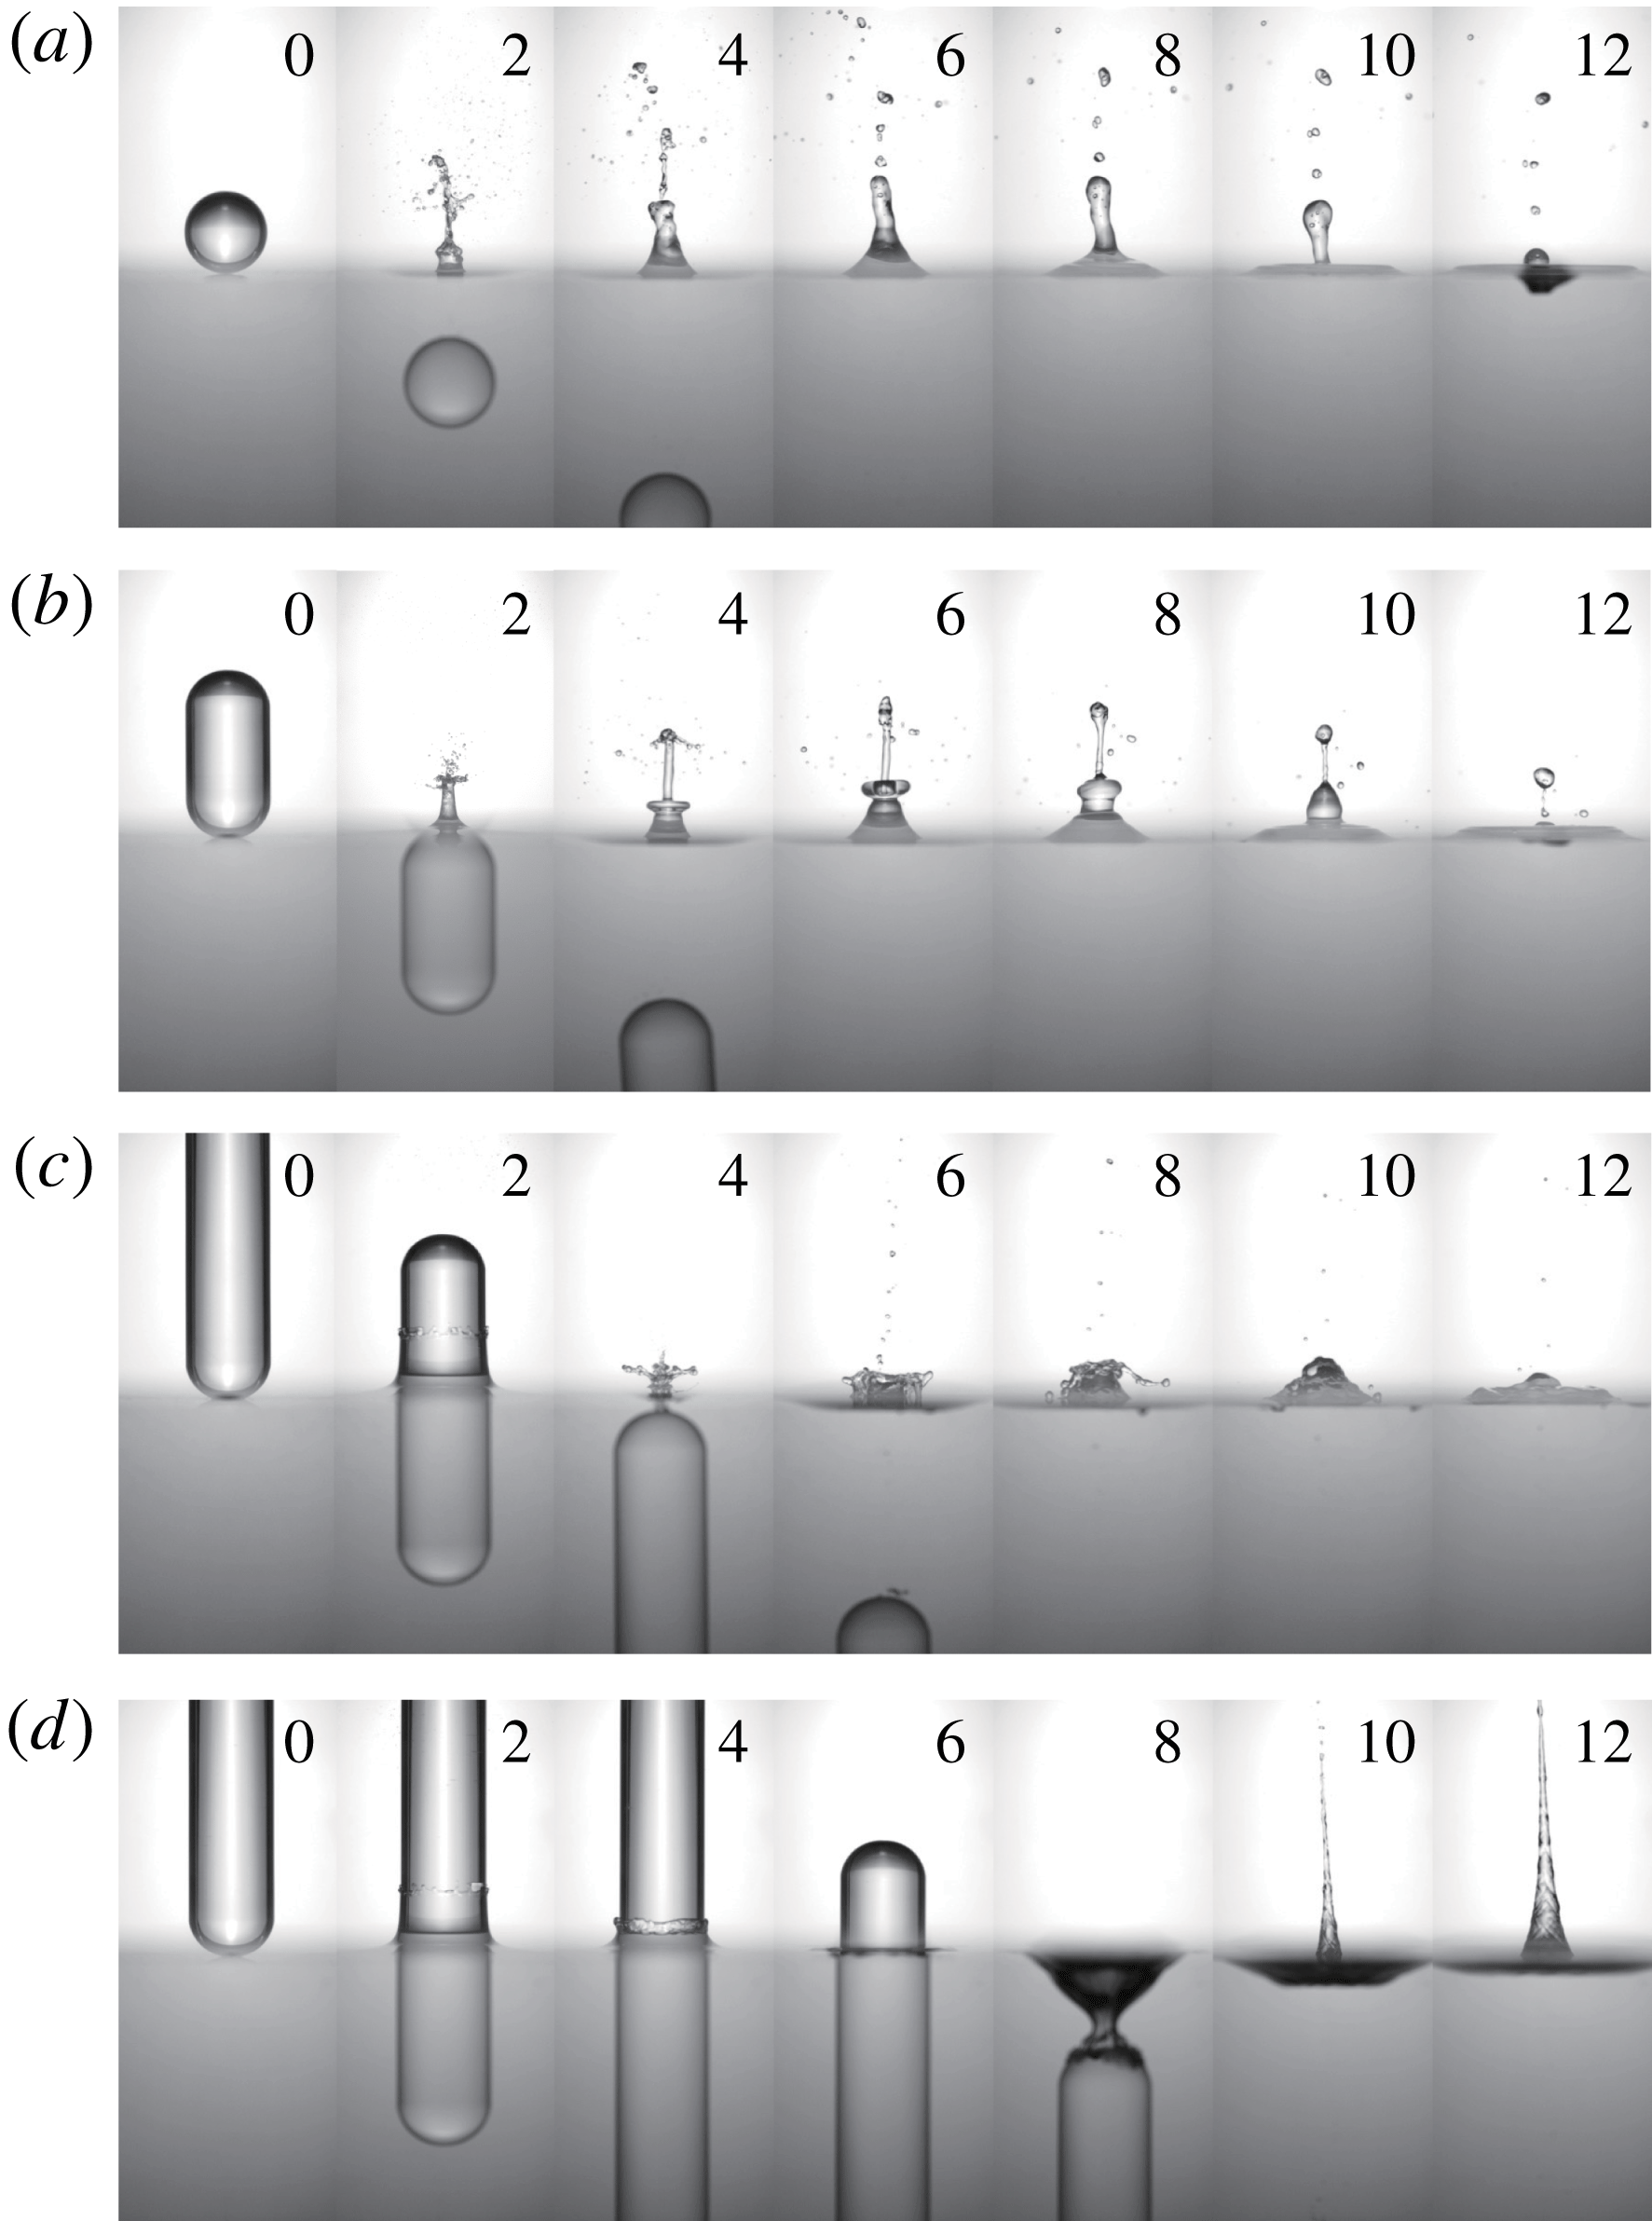
Figure 2. Free-surface deformation by the water entry of a body with a smooth surface at
 $U_{\circ }=2.5~\text{m}~\text{s}^{-1}$
: (a)
$U_{\circ }=2.5~\text{m}~\text{s}^{-1}$
: (a)
 $AR=1.0$
, (b) 2.0, (c) 4.0, (d) 8.0. The numbers in each image denote the dimensionless time (
$AR=1.0$
, (b) 2.0, (c) 4.0, (d) 8.0. The numbers in each image denote the dimensionless time (
 $t^{\ast }=tU_{\circ }/D$
) elapsed after impact (
$t^{\ast }=tU_{\circ }/D$
) elapsed after impact (
 $t=0$
).
$t=0$
).

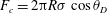
Figure 3. Free-surface deformation by the water entry of a body with a smooth surface at
 $U_{\circ }=4.2~\text{m}~\text{s}^{-1}$
: (a)
$U_{\circ }=4.2~\text{m}~\text{s}^{-1}$
: (a)
 $AR=1.0$
, (b) 2.0, (c) 4.0, (d) 8.0. The numbers in each image denote
$AR=1.0$
, (b) 2.0, (c) 4.0, (d) 8.0. The numbers in each image denote
 $t^{\ast }$
.
$t^{\ast }$
.
3 Water entry of a projectile without a cavity
3.1 Overall description of the free-surface deformation
Figures 2 and 3 show the overall flow structures above and below the free surface, induced by the water entry of a projectile (smooth surface) with different
 $AR$
, impacting at
$AR$
, impacting at
 $U_{\circ }=2.5~\text{m}~\text{s}^{-1}$
and
$U_{\circ }=2.5~\text{m}~\text{s}^{-1}$
and
 $4.2~\text{m}~\text{s}^{-1}$
, respectively (see also supplementary movie S1 available at https://doi.org/10.1017/jfm.2018.1026). Since the smooth acrylic surface had a static contact angle smaller than
$4.2~\text{m}~\text{s}^{-1}$
, respectively (see also supplementary movie S1 available at https://doi.org/10.1017/jfm.2018.1026). Since the smooth acrylic surface had a static contact angle smaller than
 $90^{\circ }$
and the capillary number was less than 0.1, the typical low-speed cavity whose boundary is attached to the nose of the body is not observable (Truscott et al.
Reference Truscott, Epps and Belden2014). Rather than a splash accompanied by a cavity, jet flow is evident above the free surface. For the cases of
$90^{\circ }$
and the capillary number was less than 0.1, the typical low-speed cavity whose boundary is attached to the nose of the body is not observable (Truscott et al.
Reference Truscott, Epps and Belden2014). Rather than a splash accompanied by a cavity, jet flow is evident above the free surface. For the cases of
 $AR$
1–4 (at both
$AR$
1–4 (at both
 $U_{\circ }=2.5$
and
$U_{\circ }=2.5$
and
 $4.2~\text{m}~\text{s}^{-1}$
), a vertical jet appears immediately after the projectile is fully submerged (e.g. at
$4.2~\text{m}~\text{s}^{-1}$
), a vertical jet appears immediately after the projectile is fully submerged (e.g. at
 $t^{\ast }=2.0$
in figures 2
b and 3
b), which breaks up into small droplets later. Here, the dimensionless time is defined as
$t^{\ast }=2.0$
in figures 2
b and 3
b), which breaks up into small droplets later. Here, the dimensionless time is defined as
 $t^{\ast }=tU_{\circ }/D$
and the instant of impact is set to
$t^{\ast }=tU_{\circ }/D$
and the instant of impact is set to
 $t=0$
. As the jet falls, the free surface slightly sags, which is clearer for the higher
$t=0$
. As the jet falls, the free surface slightly sags, which is clearer for the higher
 $U_{\circ }$
of
$U_{\circ }$
of
 $4.2~\text{m}~\text{s}^{-1}$
(at
$4.2~\text{m}~\text{s}^{-1}$
(at
 $t^{\ast }=25.0$
in figure 3
b), in which case the contribution of inertia is greater. As
$t^{\ast }=25.0$
in figure 3
b), in which case the contribution of inertia is greater. As
 $AR$
increases, the maximum jet height tends to decrease, except when
$AR$
increases, the maximum jet height tends to decrease, except when
 $AR=8.0$
. As shown in figure 2(d), the water film that rises along the surface of the projectile (
$AR=8.0$
. As shown in figure 2(d), the water film that rises along the surface of the projectile (
 $AR$
8) does not converge to form a jet, but rather descends together with the body. As the body passes the free surface, it is dragged further downward due to surface tension to form a shallow cavity in the wake behind the projectile (
$AR$
8) does not converge to form a jet, but rather descends together with the body. As the body passes the free surface, it is dragged further downward due to surface tension to form a shallow cavity in the wake behind the projectile (
 $t^{\ast }=8.0$
in figure 2
d). This behaviour is consistent with the description provided by Aristoff & Bush (Reference Aristoff and Bush2009), who explained that the free surface is attached to the rear edge of a cylinder as it enters water and is pulled down to form a cavity. The radial size of this cavity is similar to the cylinder diameter, and cavity pinch-off occurs when the cylinder base reaches a depth equal to the capillary length. This type of cavity is called a quasi-static cavity and has quite low air entrainment. Quasi-static cavities are not created until the tail of the body is fully submerged and are different from those formed by the entry of a body with a roughened front part, as we will discuss in § 4. After the shallow cavity detaches from the body tail, a long jet is induced due to the high pressure in the collapsing cavity (
$t^{\ast }=8.0$
in figure 2
d). This behaviour is consistent with the description provided by Aristoff & Bush (Reference Aristoff and Bush2009), who explained that the free surface is attached to the rear edge of a cylinder as it enters water and is pulled down to form a cavity. The radial size of this cavity is similar to the cylinder diameter, and cavity pinch-off occurs when the cylinder base reaches a depth equal to the capillary length. This type of cavity is called a quasi-static cavity and has quite low air entrainment. Quasi-static cavities are not created until the tail of the body is fully submerged and are different from those formed by the entry of a body with a roughened front part, as we will discuss in § 4. After the shallow cavity detaches from the body tail, a long jet is induced due to the high pressure in the collapsing cavity (
 $t^{\ast }=10.0$
in figure 2
d). Thus, this jet has a different origin from those appearing at smaller
$t^{\ast }=10.0$
in figure 2
d). Thus, this jet has a different origin from those appearing at smaller
 $AR$
. When
$AR$
. When
 $U_{\circ }=4.2~\text{m}~\text{s}^{-1}$
, the same flow structures (jet and quasi-static cavity) are induced but the cavity shape for
$U_{\circ }=4.2~\text{m}~\text{s}^{-1}$
, the same flow structures (jet and quasi-static cavity) are induced but the cavity shape for
 $AR$
8 is more distorted due to the increased inertia (after the collapse, most of the cavity bubble descends with the body being attached to it) and thus the jet induced by the collapsing cavity is not well established and becomes shorter (figure 3
d).
$AR$
8 is more distorted due to the increased inertia (after the collapse, most of the cavity bubble descends with the body being attached to it) and thus the jet induced by the collapsing cavity is not well established and becomes shorter (figure 3
d).

Figure 4. Jet formation by the water entry of a body with a smooth surface at
 $U_{\circ }=2.5~\text{m}~\text{s}^{-1}$
(a–c) and
$U_{\circ }=2.5~\text{m}~\text{s}^{-1}$
(a–c) and
 $4.2~\text{m}~\text{s}^{-1}$
(d–f): (a,d)
$4.2~\text{m}~\text{s}^{-1}$
(d–f): (a,d)
 $AR=1.0$
, (b,e) 2.0, (c,f) 4.0. The numbers in each image denote
$AR=1.0$
, (b,e) 2.0, (c,f) 4.0. The numbers in each image denote
 $t^{\ast }$
.
$t^{\ast }$
.

Figure 5. Formation of thin and thick jets due to the water entry of a body with a smooth surface.
Figure 4 shows the sequence of jet formation for the cases of
 $AR$
1–4 and demonstrates that jet formation can be understood as a two-step process, i.e. the formation of thin and thick jets. This behaviour is clearly visible for the cases with
$AR$
1–4 and demonstrates that jet formation can be understood as a two-step process, i.e. the formation of thin and thick jets. This behaviour is clearly visible for the cases with
 $AR$
1–2 at
$AR$
1–2 at
 $U_{\circ }=2.5~\text{m}~\text{s}^{-1}$
(figure 4
a,b), and the
$U_{\circ }=2.5~\text{m}~\text{s}^{-1}$
(figure 4
a,b), and the
 $AR$
4 case shows a more complex jet (breakdown into crown-like droplets and another jet due to the collapse of a shallow cavity) (figure 4
c). The formation of thin and thick jets in the water entry of a sphere was previously mentioned by Kuwabara et al. (Reference Kuwabara, Tanba and Kono1987) and is similar to the behaviour occurring in granular impacts (Marston et al.
Reference Marston, Seville, Cheun, Ingram, Decent and Simmons2008; Royer et al.
Reference Royer, Corwin, Conyers, Flior, Rivers, Eng and Jaeger2008) and laser-induced jets (Chen et al.
Reference Chen, Yu, Su, Chen and Chen2013), but their mechanisms have not been addressed in detail. Figure 5 illustrates the sequential process of thin and thick jet formation. As we will explain in § 3.2, the water film first rises along the body surface after impact and converges at the rear pole to form a thin jet. As the body sinks, the surrounding water is pushed and dragged around the body tail to induce a stagnation point below the free surface. From this stagnation point, vertical flow is generated and the upward component forms a thick jet over the free surface (§ 3.3).
$AR$
4 case shows a more complex jet (breakdown into crown-like droplets and another jet due to the collapse of a shallow cavity) (figure 4
c). The formation of thin and thick jets in the water entry of a sphere was previously mentioned by Kuwabara et al. (Reference Kuwabara, Tanba and Kono1987) and is similar to the behaviour occurring in granular impacts (Marston et al.
Reference Marston, Seville, Cheun, Ingram, Decent and Simmons2008; Royer et al.
Reference Royer, Corwin, Conyers, Flior, Rivers, Eng and Jaeger2008) and laser-induced jets (Chen et al.
Reference Chen, Yu, Su, Chen and Chen2013), but their mechanisms have not been addressed in detail. Figure 5 illustrates the sequential process of thin and thick jet formation. As we will explain in § 3.2, the water film first rises along the body surface after impact and converges at the rear pole to form a thin jet. As the body sinks, the surrounding water is pushed and dragged around the body tail to induce a stagnation point below the free surface. From this stagnation point, vertical flow is generated and the upward component forms a thick jet over the free surface (§ 3.3).
3.2 Water film rise and thin jet formation
Figure 6 shows the sequential movement of a thin water film along the smooth surface of a projectile with different
 $AR$
at
$AR$
at
 $U_{\circ }=2.5~\text{m}~\text{s}^{-1}$
. For
$U_{\circ }=2.5~\text{m}~\text{s}^{-1}$
. For
 $AR~1$
, the ascending film gathers at the rear pole and forms a thin, long jet over the free surface (figure 6
a), which will be referred to as a thin jet. Similar apex jet formation upon the impact of a viscous glycerin droplet onto a lower viscosity liquid was reported previously by Marston & Thoroddsen (Reference Marston and Thoroddsen2008). They explained that the impact speed directly determines the rise speed of a liquid film and it should be sufficiently fast to give momentum to the liquid film to ascend to the pole, but not so much as to cause separation from the surface. When
$AR~1$
, the ascending film gathers at the rear pole and forms a thin, long jet over the free surface (figure 6
a), which will be referred to as a thin jet. Similar apex jet formation upon the impact of a viscous glycerin droplet onto a lower viscosity liquid was reported previously by Marston & Thoroddsen (Reference Marston and Thoroddsen2008). They explained that the impact speed directly determines the rise speed of a liquid film and it should be sufficiently fast to give momentum to the liquid film to ascend to the pole, but not so much as to cause separation from the surface. When
 $AR=2.0$
, the water film still receives enough momentum to meet at the rear pole and generate a thin jet before the projectile fully submerges (figure 6
b). The time taken for jet formation increases as
$AR=2.0$
, the water film still receives enough momentum to meet at the rear pole and generate a thin jet before the projectile fully submerges (figure 6
b). The time taken for jet formation increases as
 $AR$
increases, because it takes longer for the projectile to submerge. When
$AR$
increases, because it takes longer for the projectile to submerge. When
 $AR$
increases to 4.0, the water film rises along the side wall of the projectile, stays at a constant height for some time and then falls together with the body (figure 6
c). In this case, the convergence of the water film is delayed. Since the water film cannot meet at the apex of the projectile, the thin jet formation is not as organized as in the cases of
$AR$
increases to 4.0, the water film rises along the side wall of the projectile, stays at a constant height for some time and then falls together with the body (figure 6
c). In this case, the convergence of the water film is delayed. Since the water film cannot meet at the apex of the projectile, the thin jet formation is not as organized as in the cases of
 $AR$
1–2, but the water film breaks into a finger-like shape (
$AR$
1–2, but the water film breaks into a finger-like shape (
 $t^{\ast }=3.6$
in figure 6
c). Below the free surface, a shallow (quasi-static) cavity is formed, and its collapse induces another jet emerging through the water fingers (figure 4
c). For the highest
$t^{\ast }=3.6$
in figure 6
c). Below the free surface, a shallow (quasi-static) cavity is formed, and its collapse induces another jet emerging through the water fingers (figure 4
c). For the highest
 $AR$
of 8.0, similar to the case of
$AR$
of 8.0, similar to the case of
 $AR~4$
, the water film stays at a constant height but falls into the free surface before the projectile submerges completely (figure 6
d). Thus, it is understood that at higher
$AR~4$
, the water film stays at a constant height but falls into the free surface before the projectile submerges completely (figure 6
d). Thus, it is understood that at higher
 $AR\;({>}4.0)$
, the water film does not fully converge at the pole, leaving a sagging space (i.e. cavity) under the free surface.
$AR\;({>}4.0)$
, the water film does not fully converge at the pole, leaving a sagging space (i.e. cavity) under the free surface.

Figure 6. Movement of a thin water film along the body surface (smooth) after impact (
 $U_{\circ }=2.5~\text{m}~\text{s}^{-1}$
): (a)
$U_{\circ }=2.5~\text{m}~\text{s}^{-1}$
): (a)
 $AR~1$
; (b)
$AR~1$
; (b)
 $AR~2$
; (c)
$AR~2$
; (c)
 $AR~4$
; (d)
$AR~4$
; (d)
 $AR~8$
. The numbers in each image denote
$AR~8$
. The numbers in each image denote
 $t^{\ast }$
.
$t^{\ast }$
.

Figure 7. Temporal variation of the position of the end of a water film: (a)
 $U_{\circ }=2.5~\text{m}~\text{s}^{-1}$
; (b)
$U_{\circ }=2.5~\text{m}~\text{s}^{-1}$
; (b)
 $4.2~\text{m}~\text{s}^{-1}$
. ●,
$4.2~\text{m}~\text{s}^{-1}$
. ●,
 $AR~1$
; ○,
$AR~1$
; ○,
 $AR~2$
; ▫,
$AR~2$
; ▫,
 $AR~4$
; ♢,
$AR~4$
; ♢,
 $AR~8$
. The origin is defined as the location on the undisturbed free surface that the nose of the body first contacts, and the data are plotted with a time interval
$AR~8$
. The origin is defined as the location on the undisturbed free surface that the nose of the body first contacts, and the data are plotted with a time interval
 $\unicode[STIX]{x0394}t^{\ast }$
of
$\unicode[STIX]{x0394}t^{\ast }$
of
 $0.05$
.
$0.05$
.

Figure 8. Temporal variation of the liquid film height (
 $h^{\ast }=h/D$
) from the free surface: (a)
$h^{\ast }=h/D$
) from the free surface: (a)
 $U_{\circ }=2.5~\text{m}~\text{s}^{-1}$
; (b)
$U_{\circ }=2.5~\text{m}~\text{s}^{-1}$
; (b)
 $4.2~\text{m}~\text{s}^{-1}$
. ●,
$4.2~\text{m}~\text{s}^{-1}$
. ●,
 $AR~1$
; ○,
$AR~1$
; ○,
 $AR~2$
; ▫,
$AR~2$
; ▫,
 $AR~4$
; ♢,
$AR~4$
; ♢,
 $AR~8$
. The solid lines denote the present estimates (for
$AR~8$
. The solid lines denote the present estimates (for
 $AR~8$
) (see figure 9 and (3.5)).
$AR~8$
) (see figure 9 and (3.5)).
Figure 7 tracks the end of a water film (i.e. three-phase contact point) while rising along the body surface. Here,
 $r$
and
$r$
and
 $z$
denote the radial and vertical directions, respectively, and the origin is defined as the point on the undisturbed free surface that the nose of the body first contacts. The raw images were binarized (Otsu Reference Otsu1979) to distinguish the interfaces between the ambient air, water film and solid surface before measuring the position of the water film. For both
$z$
denote the radial and vertical directions, respectively, and the origin is defined as the point on the undisturbed free surface that the nose of the body first contacts. The raw images were binarized (Otsu Reference Otsu1979) to distinguish the interfaces between the ambient air, water film and solid surface before measuring the position of the water film. For both
 $U_{\circ }=2.5$
and
$U_{\circ }=2.5$
and
 $4.2~\text{m}~\text{s}^{-1}$
, the water film follows the surface of the falling projectile and converges near the rear pole (
$4.2~\text{m}~\text{s}^{-1}$
, the water film follows the surface of the falling projectile and converges near the rear pole (
 $z/D\simeq 0.5$
) for the cases of
$z/D\simeq 0.5$
) for the cases of
 $AR~1{-}2$
. For
$AR~1{-}2$
. For
 $AR~4$
, the last location of the film end is around
$AR~4$
, the last location of the film end is around
 $z/D=0.2{-}0.3$
, which corresponds to the root of a finger-like jet (
$z/D=0.2{-}0.3$
, which corresponds to the root of a finger-like jet (
 $t^{\ast }=3.6$
in figure 6
c). Thus, the complete convergence of the water film as a jet is not achieved before the body submerges. The water film rises and then simply falls down vertically, for the case of
$t^{\ast }=3.6$
in figure 6
c). Thus, the complete convergence of the water film as a jet is not achieved before the body submerges. The water film rises and then simply falls down vertically, for the case of
 $AR~8$
. The initial speed of the water film is not affected much by variations of
$AR~8$
. The initial speed of the water film is not affected much by variations of
 $AR$
and
$AR$
and
 $U_{\circ }$
, but its descending speed later changes considerably (figure 7). In addition, the maximum height of the water film is independent of
$U_{\circ }$
, but its descending speed later changes considerably (figure 7). In addition, the maximum height of the water film is independent of
 $AR$
when it is sufficiently high that the water film cannot converge completely before the projectile fully submerges. To investigate this feature further, the liquid film height (
$AR$
when it is sufficiently high that the water film cannot converge completely before the projectile fully submerges. To investigate this feature further, the liquid film height (
 $h/D$
), i.e. the
$h/D$
), i.e. the
 $z$
-position in figure 7, is shown as a function of time in figure 8. For both
$z$
-position in figure 7, is shown as a function of time in figure 8. For both
 $U_{\circ }$
values, the general trend of the variation of
$U_{\circ }$
values, the general trend of the variation of
 $h/D$
with
$h/D$
with
 $AR$
is similar. That is, the initial speed (at
$AR$
is similar. That is, the initial speed (at
 $t^{\ast }<1.0$
) of a rising film is almost identical (
$t^{\ast }<1.0$
) of a rising film is almost identical (
 $\unicode[STIX]{x2202}h^{\ast }/\unicode[STIX]{x2202}t^{\ast }\simeq 0.7$
and 0.6 for
$\unicode[STIX]{x2202}h^{\ast }/\unicode[STIX]{x2202}t^{\ast }\simeq 0.7$
and 0.6 for
 $U_{\circ }=2.5~\text{m}~\text{s}^{-1}$
and
$U_{\circ }=2.5~\text{m}~\text{s}^{-1}$
and
 $4.2~\text{m}~\text{s}^{-1}$
, respectively) for all
$4.2~\text{m}~\text{s}^{-1}$
, respectively) for all
 $AR$
values, but the slope during the falling stage is different. After the maximum height, the falling velocity decreases with increasing
$AR$
values, but the slope during the falling stage is different. After the maximum height, the falling velocity decreases with increasing
 $AR$
;
$AR$
;
 $\unicode[STIX]{x2202}h^{\ast }/\unicode[STIX]{x2202}t^{\ast }=-0.51$
,
$\unicode[STIX]{x2202}h^{\ast }/\unicode[STIX]{x2202}t^{\ast }=-0.51$
,
 $-0.44$
,
$-0.44$
,
 $-0.21$
and
$-0.21$
and
 $-0.17$
for
$-0.17$
for
 $U_{\circ }=2.5~\text{m}~\text{s}^{-1}$
, and
$U_{\circ }=2.5~\text{m}~\text{s}^{-1}$
, and
 $-0.61$
,
$-0.61$
,
 $-0.52$
,
$-0.52$
,
 $-0.20$
and
$-0.20$
and
 $-0.10$
for
$-0.10$
for
 $U_{\circ }=4.2~\text{m}~\text{s}^{-1}$
when
$U_{\circ }=4.2~\text{m}~\text{s}^{-1}$
when
 $AR=1.0$
, 2.0, 4.0 and 8.0, respectively. The maximum height of the water film remains constant at
$AR=1.0$
, 2.0, 4.0 and 8.0, respectively. The maximum height of the water film remains constant at
 $h/D\simeq 0.8$
. For
$h/D\simeq 0.8$
. For
 $AR~1{-}2$
, the film height decreases sharply after the water film closes at the rear pole of the projectile; thus, the maximum height is less than
$AR~1{-}2$
, the film height decreases sharply after the water film closes at the rear pole of the projectile; thus, the maximum height is less than
 $0.8D$
(figure 8). As
$0.8D$
(figure 8). As
 $AR$
increases to 4.0,
$AR$
increases to 4.0,
 $h/D$
increases to the maximum of 0.8 and then decreases gradually. At
$h/D$
increases to the maximum of 0.8 and then decreases gradually. At
 $t^{\ast }\simeq 3.5$
, similar to the cases with lower
$t^{\ast }\simeq 3.5$
, similar to the cases with lower
 $AR$
values, the water film experiences a sharp fall after it gathers around the rear pole. For
$AR$
values, the water film experiences a sharp fall after it gathers around the rear pole. For
 $AR~8$
, the water film falls down to the free surface at a constant rate after reaching the maximum height of
$AR~8$
, the water film falls down to the free surface at a constant rate after reaching the maximum height of
 $0.8D$
. Interestingly, the critical non-dimensional time for classifying these different rising water film behaviours depending on the
$0.8D$
. Interestingly, the critical non-dimensional time for classifying these different rising water film behaviours depending on the
 $AR$
is similar even if the impact velocity increases to
$AR$
is similar even if the impact velocity increases to
 $4.2~\text{m}~\text{s}^{-1}$
(figure 8
b).
$4.2~\text{m}~\text{s}^{-1}$
(figure 8
b).

Figure 9. Schematic diagram of the ascending water film on the surface of an impacting body:
 $h$
is measured from the undisturbed free surface. The thickness of the water film is defined as
$h$
is measured from the undisturbed free surface. The thickness of the water film is defined as
 $e$
.
$e$
.
If a thin jet is not formed through water film convergence at the rear pole, the maximum height of a water film is fixed at
 $h/D\simeq 0.8$
. To study this behaviour, we simplified the problem of a water film rise along the surface of an impacting body (figure 9). As shown, it is assumed that the water film rises along the body surface with a constant thickness (
$h/D\simeq 0.8$
. To study this behaviour, we simplified the problem of a water film rise along the surface of an impacting body (figure 9). As shown, it is assumed that the water film rises along the body surface with a constant thickness (
 $e$
), which is very thin compared to the body size (
$e$
), which is very thin compared to the body size (
 $D=2R$
), while the body moves downward at
$D=2R$
), while the body moves downward at
 $U_{\circ }$
. The distance to the end of water film from the undisturbed free surface is defined as
$U_{\circ }$
. The distance to the end of water film from the undisturbed free surface is defined as
 $h$
. In this situation, the inertia transferred from the impacting body drives the motion and the capillary (
$h$
. In this situation, the inertia transferred from the impacting body drives the motion and the capillary (
 $F_{c}$
), viscous (
$F_{c}$
), viscous (
 $F_{v}$
) and gravitational (
$F_{v}$
) and gravitational (
 $F_{g}$
) forces resist it (3.1):
$F_{g}$
) forces resist it (3.1):
 $$\begin{eqnarray}\frac{\text{d}}{\text{d}t}\left(m_{f}\frac{\text{d}h}{\text{d}t}\right)=F_{c}-F_{v}-F_{g}.\end{eqnarray}$$
Here,
 $m_{f}$
is the mass of the water film, and the capillary and gravitational forces are given by
$m_{f}$
is the mass of the water film, and the capillary and gravitational forces are given by
 $F_{c}=2\unicode[STIX]{x03C0}R\unicode[STIX]{x1D70E}\cos \unicode[STIX]{x1D703}_{D}$
and
$F_{c}=2\unicode[STIX]{x03C0}R\unicode[STIX]{x1D70E}\cos \unicode[STIX]{x1D703}_{D}$
and
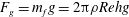 $F_{g}=m_{f}g=2\unicode[STIX]{x03C0}\unicode[STIX]{x1D70C}Rehg$
, respectively (
$F_{g}=m_{f}g=2\unicode[STIX]{x03C0}\unicode[STIX]{x1D70C}Rehg$
, respectively (
 $\unicode[STIX]{x1D70E}$
: surface tension,
$\unicode[STIX]{x1D70E}$
: surface tension,
 $\unicode[STIX]{x1D703}_{D}$
: dynamic contact angle,
$\unicode[STIX]{x1D703}_{D}$
: dynamic contact angle,
 $g$
: gravitational acceleration). To calculate the viscous force, it is necessary to know the velocity distribution inside the water film. Since the water film is quite thin, it is assumed that the vertical (
$g$
: gravitational acceleration). To calculate the viscous force, it is necessary to know the velocity distribution inside the water film. Since the water film is quite thin, it is assumed that the vertical (
 $z$
) component of the velocity (
$z$
) component of the velocity (
 $v=v(x)$
) is dominant. We also consider that the film flow on a moving surface is fully developed, with boundary conditions of
$v=v(x)$
) is dominant. We also consider that the film flow on a moving surface is fully developed, with boundary conditions of
 $v(0)=-U_{\circ }$
and
$v(0)=-U_{\circ }$
and
 $\text{d}v/\text{d}x(e)=0$
. Thus, the water film velocity at the interface to the ambient air is considered to be the same as the velocity at which the water film rises (similar to a Couette flow). The velocity distribution inside the water film and the corresponding viscous force at the body surface are given by (3.2) and (3.3), respectively:
$\text{d}v/\text{d}x(e)=0$
. Thus, the water film velocity at the interface to the ambient air is considered to be the same as the velocity at which the water film rises (similar to a Couette flow). The velocity distribution inside the water film and the corresponding viscous force at the body surface are given by (3.2) and (3.3), respectively:
 $$\begin{eqnarray}\displaystyle & \displaystyle v(x)=\left(\frac{\text{d}h}{\text{d}t}+U_{\circ }\right)\left(2-\frac{x}{e}\right)\frac{x}{e}-U_{\circ }, & \displaystyle\end{eqnarray}$$
 $$\begin{eqnarray}\displaystyle & \displaystyle F_{v}=\int \unicode[STIX]{x1D70F}_{w}=a_{1}\frac{4\unicode[STIX]{x03C0}R\unicode[STIX]{x1D707}}{e}h\frac{\text{d}h}{\text{d}t}+a_{2}\frac{4\unicode[STIX]{x03C0}R\unicode[STIX]{x1D707}U_{\circ }}{e}h. & \displaystyle\end{eqnarray}$$
Here, the pre-factors of
 $a_{1}$
and
$a_{1}$
and
 $a_{2}$
are introduced to compensate for the possible deviations from the assumptions of fully developed flow and constant water film thickness. Das et al. (Reference Das, Chanda, Eijkel, Tas, Chakraborty and Mitra2014) used similar pre-factors to compensate for the deviations of the velocity profiles from the assumed one in the capillary rise of an electrolytic solution. These pre-factors play the role of fitting parameters in actual application, and they were determined by the least square error method. Collecting these relations, equation (3.1) can be written as (3.4):
$a_{2}$
are introduced to compensate for the possible deviations from the assumptions of fully developed flow and constant water film thickness. Das et al. (Reference Das, Chanda, Eijkel, Tas, Chakraborty and Mitra2014) used similar pre-factors to compensate for the deviations of the velocity profiles from the assumed one in the capillary rise of an electrolytic solution. These pre-factors play the role of fitting parameters in actual application, and they were determined by the least square error method. Collecting these relations, equation (3.1) can be written as (3.4):
 $$\begin{eqnarray}\frac{\text{d}^{2}h}{\text{d}t^{2}}=\left(\frac{\unicode[STIX]{x1D70E}\cos \unicode[STIX]{x1D703}_{D}}{\unicode[STIX]{x1D70C}e}\right)\frac{1}{h}-a_{1}\frac{2\unicode[STIX]{x1D707}}{\unicode[STIX]{x1D70C}e^{2}}\left(\frac{\text{d}h}{\text{d}t}\right)-\left(a_{2}\frac{2\unicode[STIX]{x1D707}U_{\circ }}{\unicode[STIX]{x1D70C}e^{2}}+g\right)-\frac{1}{h}\left(\frac{\text{d}h}{\text{d}t}\right)^{2}.\end{eqnarray}$$
This equation can be further normalized for the dimensionless height (
 $h^{\ast }=h/D$
) as
$h^{\ast }=h/D$
) as
 $$\begin{eqnarray}\frac{\text{d}^{2}h^{\ast }}{{\text{d}t^{\ast }}^{2}}=\left(\frac{\unicode[STIX]{x1D70E}\cos \unicode[STIX]{x1D703}_{D}}{\unicode[STIX]{x1D70C}e}\right)\frac{1}{U_{\circ }^{2}}\frac{1}{h^{\ast }}-a_{1}\frac{2\unicode[STIX]{x1D707}}{\unicode[STIX]{x1D70C}e^{2}}\frac{D}{U_{\circ }}\left(\frac{\text{d}h^{\ast }}{\text{d}t^{\ast }}\right)-\left(a_{2}\frac{2\unicode[STIX]{x1D707}U_{\circ }}{\unicode[STIX]{x1D70C}e^{2}}+g\right)\frac{D}{U_{\circ }^{2}}-\frac{1}{h^{\ast }}\left(\frac{\text{d}h^{\ast }}{\text{d}t^{\ast }}\right)^{2}.\end{eqnarray}$$
For
 $e$
and
$e$
and
 $\unicode[STIX]{x1D703}_{D}$
, we obtained the values from the measured data. First, we measured the film thickness over time, which was almost constant (
$\unicode[STIX]{x1D703}_{D}$
, we obtained the values from the measured data. First, we measured the film thickness over time, which was almost constant (
 $e/D\simeq 0.02$
) during the rise and got thicker (
$e/D\simeq 0.02$
) during the rise and got thicker (
 $e/D\simeq 0.03$
) as the film fell (see figure S1 in the supplementary material). Based on this, we assumed that
$e/D\simeq 0.03$
) as the film fell (see figure S1 in the supplementary material). Based on this, we assumed that
 $e$
is constant and used a time-averaged thickness of 0.8 mm and 0.11 mm for
$e$
is constant and used a time-averaged thickness of 0.8 mm and 0.11 mm for
 $U_{\circ }=2.5~\text{m}~\text{s}^{-1}$
and
$U_{\circ }=2.5~\text{m}~\text{s}^{-1}$
and
 $4.2~\text{m}~\text{s}^{-1}$
, respectively. On the other hand,
$4.2~\text{m}~\text{s}^{-1}$
, respectively. On the other hand,
 $\unicode[STIX]{x1D703}_{D}$
would change over time as well, but we were not able to measure it accurately (measured values were scattered in the range of
$\unicode[STIX]{x1D703}_{D}$
would change over time as well, but we were not able to measure it accurately (measured values were scattered in the range of
 $110^{\circ }{-}150^{\circ }$
) due to the limited resolution near the contact line. Thus, we measured the static contact angle of a water droplet (
$110^{\circ }{-}150^{\circ }$
) due to the limited resolution near the contact line. Thus, we measured the static contact angle of a water droplet (
 $\unicode[STIX]{x1D703}_{c}=74^{\circ }$
) on the side wall of the
$\unicode[STIX]{x1D703}_{c}=74^{\circ }$
) on the side wall of the
 $AR~8$
projectile, and used a dynamic contact angle model given by
$AR~8$
projectile, and used a dynamic contact angle model given by
 $\unicode[STIX]{x1D703}_{D}^{3}=\unicode[STIX]{x1D703}_{c}^{3}+144Ca$
(Cox Reference Cox1986). As a result,
$\unicode[STIX]{x1D703}_{D}^{3}=\unicode[STIX]{x1D703}_{c}^{3}+144Ca$
(Cox Reference Cox1986). As a result,
 $\unicode[STIX]{x1D703}_{D}$
was estimated as
$\unicode[STIX]{x1D703}_{D}$
was estimated as
 $110^{\circ }$
and
$110^{\circ }$
and
 $125^{\circ }$
for
$125^{\circ }$
for
 $U_{\circ }=2.5~\text{m}~\text{s}^{-1}$
and
$U_{\circ }=2.5~\text{m}~\text{s}^{-1}$
and
 $4.2~\text{m}~\text{s}^{-1}$
, respectively. These values were used as a representative (constant)
$4.2~\text{m}~\text{s}^{-1}$
, respectively. These values were used as a representative (constant)
 $\unicode[STIX]{x1D703}_{D}$
.
$\unicode[STIX]{x1D703}_{D}$
.
Designating
 $t^{\ast }=0$
as the instant at which the rise of the water film can first be distinguished visually, the initial conditions of
$t^{\ast }=0$
as the instant at which the rise of the water film can first be distinguished visually, the initial conditions of
 $h^{\ast }(0)$
and
$h^{\ast }(0)$
and
 $\text{d}h^{\ast }/\text{d}t^{\ast }(0)$
were calculated from the measured data. These initial conditions were found to have positive values, indicating that the initial driving force of the film rise is the strong inertia transferred from the impacting body. After putting these empirical values into (3.5), it was numerically solved using the fourth-order Runge–Kutta method. The pre-factors were found to be
$\text{d}h^{\ast }/\text{d}t^{\ast }(0)$
were calculated from the measured data. These initial conditions were found to have positive values, indicating that the initial driving force of the film rise is the strong inertia transferred from the impacting body. After putting these empirical values into (3.5), it was numerically solved using the fourth-order Runge–Kutta method. The pre-factors were found to be
 $(a1,a2)=(15,2.8)$
and
$(a1,a2)=(15,2.8)$
and
 $(77,5.6)$
for
$(77,5.6)$
for
 $U_{\circ }=2.5~\text{m}~\text{s}^{-1}$
and
$U_{\circ }=2.5~\text{m}~\text{s}^{-1}$
and
 $4.2~\text{m}~\text{s}^{-1}$
, respectively. The results of the estimated water film height for the case of
$4.2~\text{m}~\text{s}^{-1}$
, respectively. The results of the estimated water film height for the case of
 $AR~8$
are plotted together in figure 8, in which the present estimates show reasonable agreement with the measured water film heights. This also indicates that our assumptions are reasonable. As the impact velocity increases, the deviation between the measurement and estimate slightly increases. Since we assumed a constant film thickness, the effect of a curved edge near the free surface would be non-negligible with increasing inertia of the projectile. The first, second, third and fourth terms on the right-hand side of (3.5), on the other hand, represent the contributions of surface tension, viscosity, gravity and added water film mass from the pool, respectively. After comparing the magnitudes of these components, it was found that the inertia drives the initial motion at
$AR~8$
are plotted together in figure 8, in which the present estimates show reasonable agreement with the measured water film heights. This also indicates that our assumptions are reasonable. As the impact velocity increases, the deviation between the measurement and estimate slightly increases. Since we assumed a constant film thickness, the effect of a curved edge near the free surface would be non-negligible with increasing inertia of the projectile. The first, second, third and fourth terms on the right-hand side of (3.5), on the other hand, represent the contributions of surface tension, viscosity, gravity and added water film mass from the pool, respectively. After comparing the magnitudes of these components, it was found that the inertia drives the initial motion at
 $t^{\ast }<1.0$
, which is counteracted by a capillary force and large initial mass of rising water film. As time progresses, the inertia of the rising water film is reduced, and it is balanced by the surface tension, viscous force and gravity at
$t^{\ast }<1.0$
, which is counteracted by a capillary force and large initial mass of rising water film. As time progresses, the inertia of the rising water film is reduced, and it is balanced by the surface tension, viscous force and gravity at
 $t^{\ast }\simeq 1.2{-}1.5$
. After that, the viscous force (together with gravity) drives the downward fall of the water film (figure 8). Since the inertia dominates the flow for a very short time only during the initial stage, as shown above, the general trend of a moving water film does not vary significantly with
$t^{\ast }\simeq 1.2{-}1.5$
. After that, the viscous force (together with gravity) drives the downward fall of the water film (figure 8). Since the inertia dominates the flow for a very short time only during the initial stage, as shown above, the general trend of a moving water film does not vary significantly with
 $U_{\circ }$
(figures 7 and 8).
$U_{\circ }$
(figures 7 and 8).

Figure 10. Generation of a thick jet (a–d) and the flow structures below the free surface (e–h) at: (a,e)
 $t^{\ast }=0.8$
; (b,f) 1.2; (c,g) 1.6; (d,h) 2.0. The considered case is
$t^{\ast }=0.8$
; (b,f) 1.2; (c,g) 1.6; (d,h) 2.0. The considered case is
 $U_{\circ }=2.5~\text{m}~\text{s}^{-1}$
,
$U_{\circ }=2.5~\text{m}~\text{s}^{-1}$
,
 $AR=1$
with a smooth surface.
$AR=1$
with a smooth surface.
3.3 Thick jet formation
As it is shown most clearly in figure 2(b), a thick jet is induced after thin jet formation. While its shape differs slightly depending on the
 $AR$
, it can be said that the tip of a thick jet tends to collapse into a disk-like shape below the thin jet for
$AR$
, it can be said that the tip of a thick jet tends to collapse into a disk-like shape below the thin jet for
 $AR=1.0{-}4.0$
. When
$AR=1.0{-}4.0$
. When
 $AR=8.0$
, the jet flow originates from a different mechanism, i.e. the collapse of a quasi-static cavity. To understand the process of thick jet formation, we measured the liquid (water) phase velocity below the free surface at the instants at which thick jets were formed above the free surface, using particle image velocimetry. The measured velocity and vorticity fields are shown together with the corresponding jet flow in figures 10–12. As the sphere (
$AR=8.0$
, the jet flow originates from a different mechanism, i.e. the collapse of a quasi-static cavity. To understand the process of thick jet formation, we measured the liquid (water) phase velocity below the free surface at the instants at which thick jets were formed above the free surface, using particle image velocimetry. The measured velocity and vorticity fields are shown together with the corresponding jet flow in figures 10–12. As the sphere (
 $AR~1$
) moves through the water surface, it pushes the surrounding water away (figure 10
e), which turns around toward the rear side as it descends (figure 10
f,g,h). Thus, the water flow induced by the sinking sphere resembles that of a doublet, as mentioned by Kubota & Mochizuki (Reference Kubota and Mochizuki2011). Due to the interaction between this flow structure and a free surface, a stagnation point appears below the free surface (indicated with an arrow in figure 10
h), and substantial upward flow is induced above this point, resulting in a thick (secondary) jet. As shown in the figures, the generation of a thick jet is well synchronized with the appearance of a stagnation point below the free surface. Previously, Kuwabara et al. (Reference Kuwabara, Tanba and Kono1987) observed a similar phenomenon and mentioned that the secondary jet is related to high-speed water flow toward the sphere centre. As this thick jet falls down into the free surface, it forces the free surface to sag (figure 3
a,b). For the cases of
$AR~1$
) moves through the water surface, it pushes the surrounding water away (figure 10
e), which turns around toward the rear side as it descends (figure 10
f,g,h). Thus, the water flow induced by the sinking sphere resembles that of a doublet, as mentioned by Kubota & Mochizuki (Reference Kubota and Mochizuki2011). Due to the interaction between this flow structure and a free surface, a stagnation point appears below the free surface (indicated with an arrow in figure 10
h), and substantial upward flow is induced above this point, resulting in a thick (secondary) jet. As shown in the figures, the generation of a thick jet is well synchronized with the appearance of a stagnation point below the free surface. Previously, Kuwabara et al. (Reference Kuwabara, Tanba and Kono1987) observed a similar phenomenon and mentioned that the secondary jet is related to high-speed water flow toward the sphere centre. As this thick jet falls down into the free surface, it forces the free surface to sag (figure 3
a,b). For the cases of
 $AR~2{-}4$
, the same thick jet formation mechanism is applied as the stagnation point shows up between the free surface and body tail (figures 11
h, 12
h). When
$AR~2{-}4$
, the same thick jet formation mechanism is applied as the stagnation point shows up between the free surface and body tail (figures 11
h, 12
h). When
 $AR=4.0$
, the flow displaced by the front side of the body is not directly connected to the flow toward the rear side (figure 12
e) but the low pressure region in the wake behind the sinking body induces a stagnation point in the flow, resulting in a thick jet (figure 12
b,f,c,g,d,h). Since the motion of a displaced fluid around the front part of the body contributes strongly to the generation of upward flow, it becomes weaker as
$AR=4.0$
, the flow displaced by the front side of the body is not directly connected to the flow toward the rear side (figure 12
e) but the low pressure region in the wake behind the sinking body induces a stagnation point in the flow, resulting in a thick jet (figure 12
b,f,c,g,d,h). Since the motion of a displaced fluid around the front part of the body contributes strongly to the generation of upward flow, it becomes weaker as
 $AR$
increases. Thus, the height of a thick jet decreases with increasing (decreasing)
$AR$
increases. Thus, the height of a thick jet decreases with increasing (decreasing)
 $AR$
(
$AR$
(
 $U_{\circ }$
).
$U_{\circ }$
).
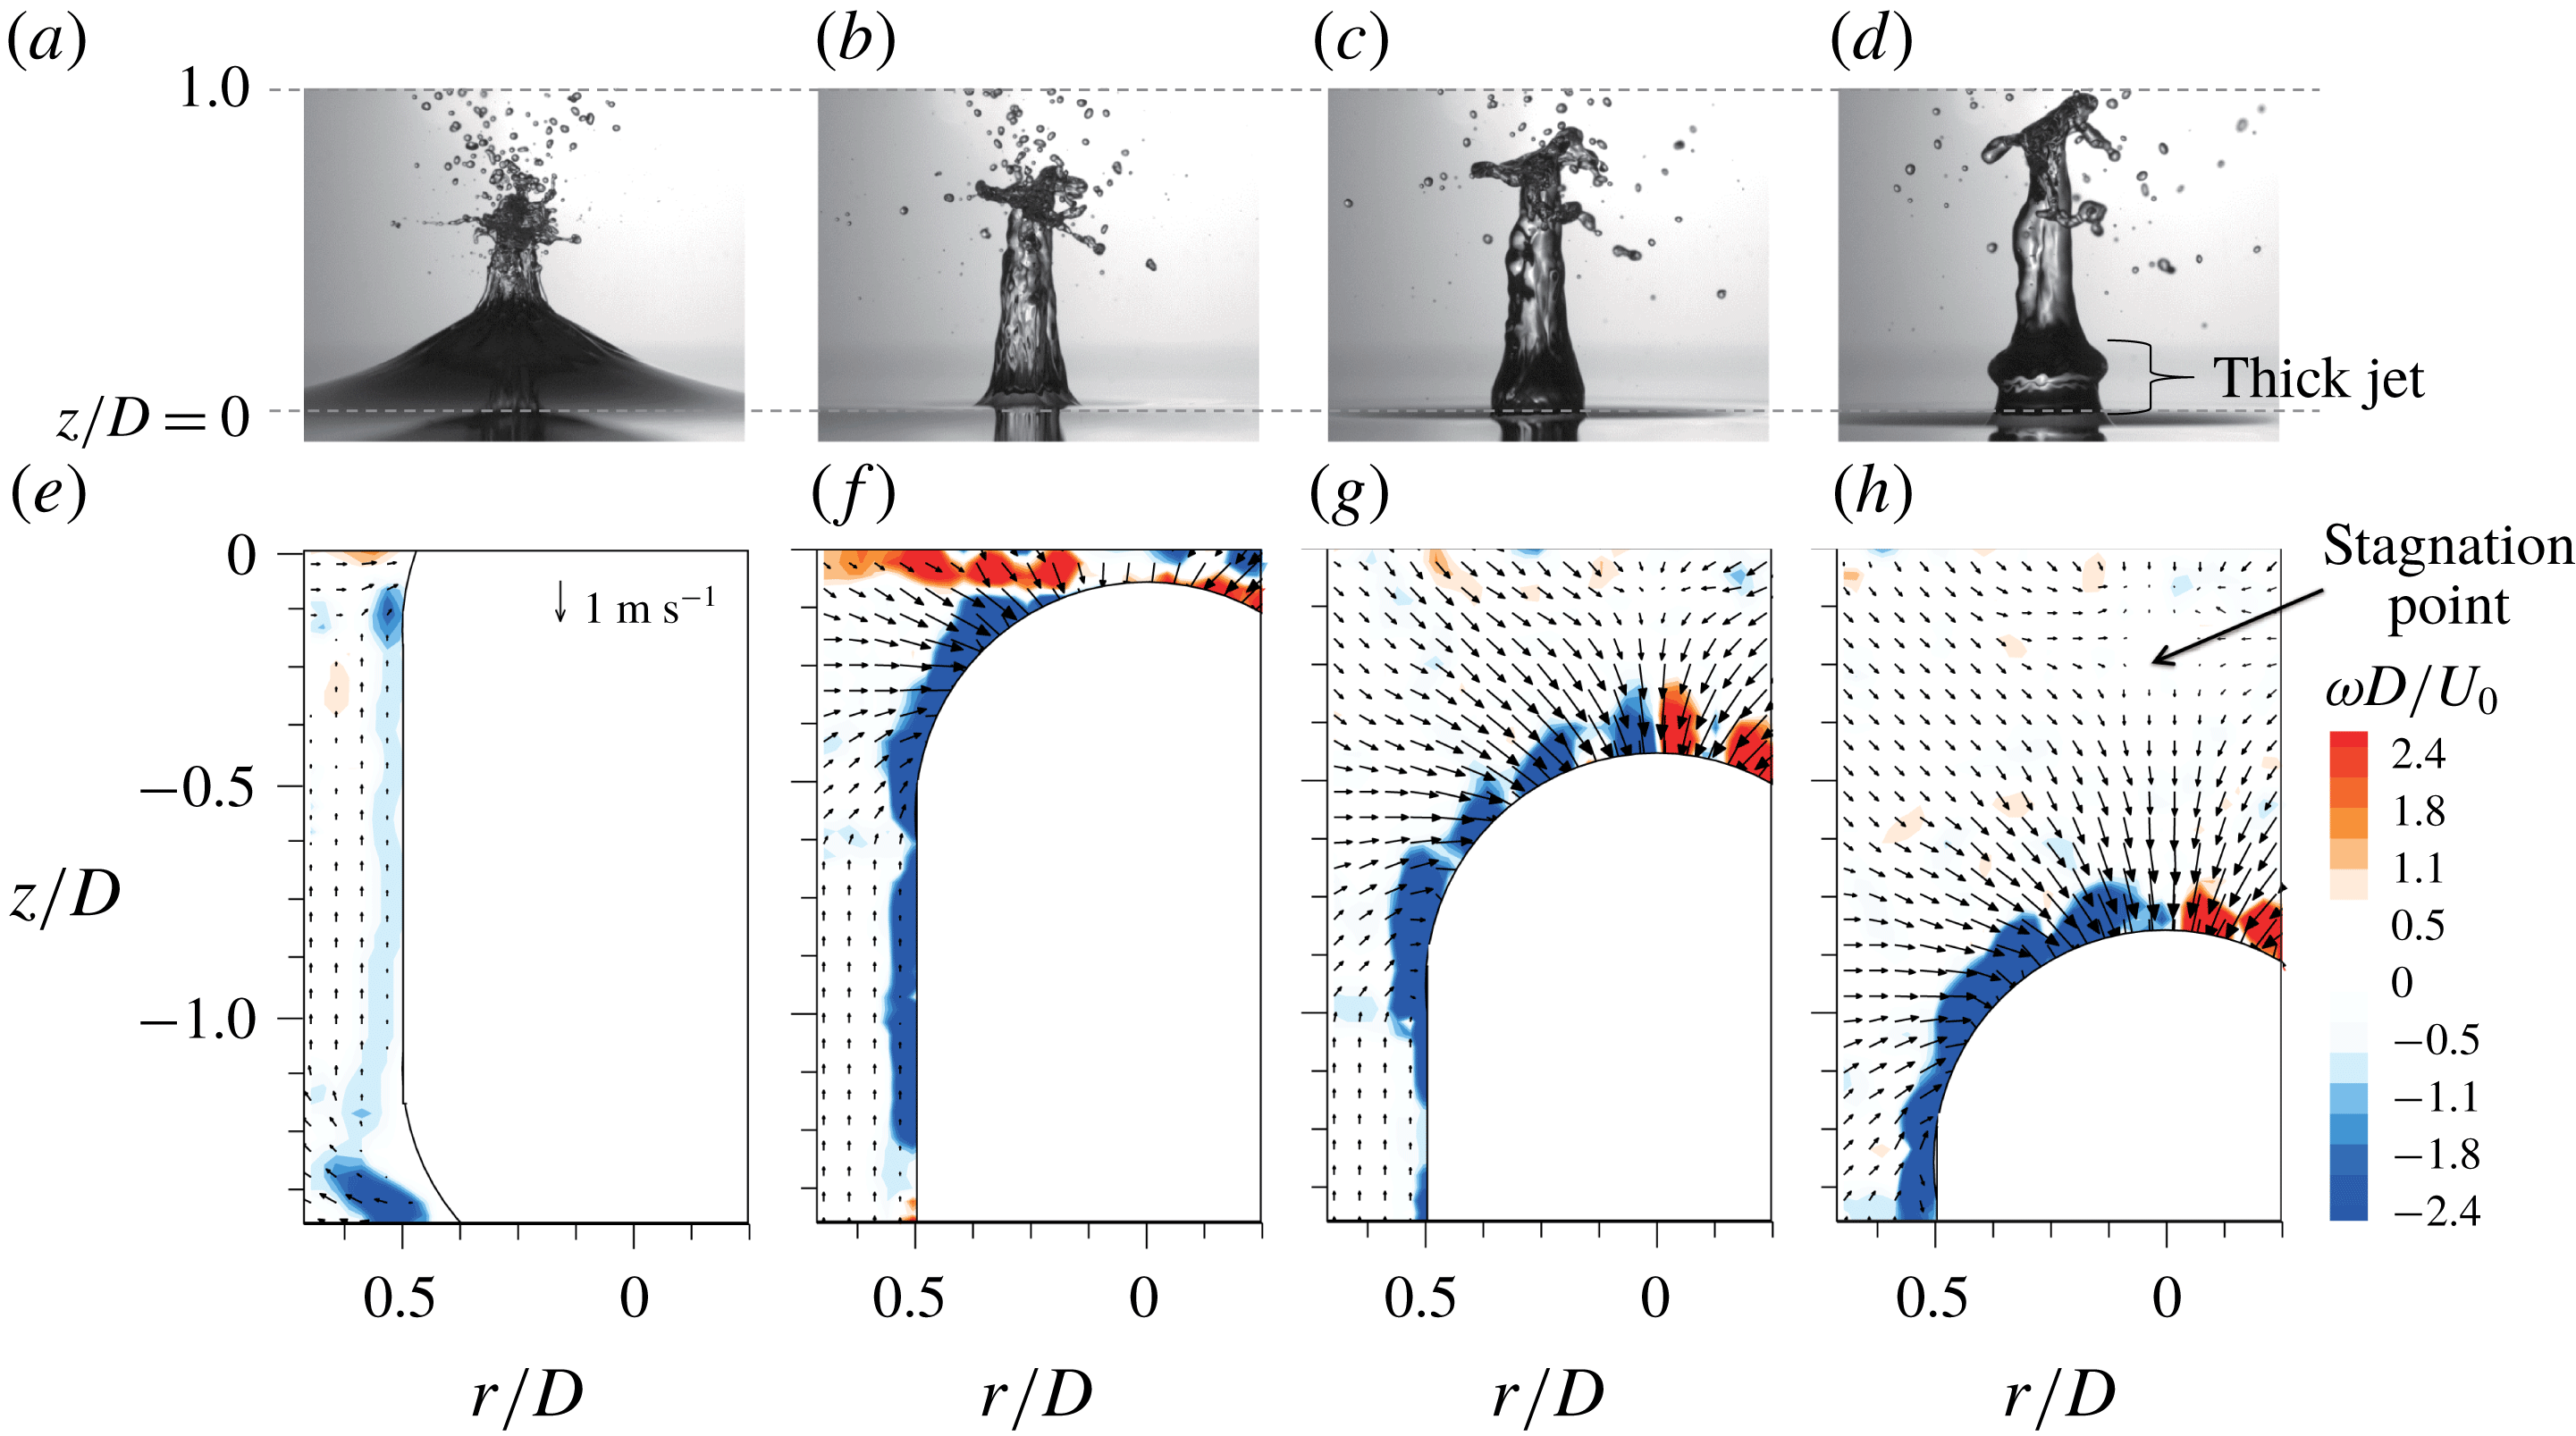
Figure 11. Generation of a thick jet (a–d) and the flow structures below the free surface (e–h) at: (a,e)
 $t^{\ast }=1.8$
; (b,f) 2.2; (c,h) 2.6; (d,h) 3.0. The considered case is
$t^{\ast }=1.8$
; (b,f) 2.2; (c,h) 2.6; (d,h) 3.0. The considered case is
 $U_{\circ }=2.5~\text{m}~\text{s}^{-1}$
,
$U_{\circ }=2.5~\text{m}~\text{s}^{-1}$
,
 $AR=2$
with a smooth surface.
$AR=2$
with a smooth surface.

Figure 12. Generation of a thick jet (a–d) and the flow structures below the free surface (e–h) at: (a,e)
 $t^{\ast }=3.6$
; (b,f) 4.2; (c,g) 4.8; (d,h) 5.4. The considered case is
$t^{\ast }=3.6$
; (b,f) 4.2; (c,g) 4.8; (d,h) 5.4. The considered case is
 $U_{\circ }=2.5~\text{m}~\text{s}^{-1}$
,
$U_{\circ }=2.5~\text{m}~\text{s}^{-1}$
,
 $AR=4$
with a smooth surface.
$AR=4$
with a smooth surface.
3.4 Jet-tip breakdown
So far, we have discussed the processes of thin and thick jet formation. Interestingly, the jet tip breaks down in some cases (figures 2
a,b, and 3
a). When
 $U_{\circ }=2.5~\text{m}~\text{s}^{-1}$
, breakdown occurs for
$U_{\circ }=2.5~\text{m}~\text{s}^{-1}$
, breakdown occurs for
 $AR~1$
and
$AR~1$
and
 $AR~2$
, and it is clearly visible for
$AR~2$
, and it is clearly visible for
 $AR~1$
at
$AR~1$
at
 $U_{\circ }=4.2~\text{m}~\text{s}^{-1}$
. In figure 13, the temporal variation of a continuous (without a breakdown) jet height (
$U_{\circ }=4.2~\text{m}~\text{s}^{-1}$
. In figure 13, the temporal variation of a continuous (without a breakdown) jet height (
 $H_{jet}$
) is plotted. Since the jet flow for the case of
$H_{jet}$
) is plotted. Since the jet flow for the case of
 $AR~8$
has a different origin than that discussed here, it is not included in this figure. Roughly speaking,
$AR~8$
has a different origin than that discussed here, it is not included in this figure. Roughly speaking,
 $H_{jet}$
decreases with increasing
$H_{jet}$
decreases with increasing
 $AR$
, because the momentum of the impacting body is transferred to the jet faster as
$AR$
, because the momentum of the impacting body is transferred to the jet faster as
 $AR$
decreases. For
$AR$
decreases. For
 $AR~1$
, thin jet breakdown occurs at
$AR~1$
, thin jet breakdown occurs at
 $t^{\ast }\simeq 4.0$
and 23.0 for
$t^{\ast }\simeq 4.0$
and 23.0 for
 $U_{\circ }=2.5~\text{m}~\text{s}^{-1}$
and
$U_{\circ }=2.5~\text{m}~\text{s}^{-1}$
and
 $4.2~\text{m}~\text{s}^{-1}$
, respectively (sharp decreases of
$4.2~\text{m}~\text{s}^{-1}$
, respectively (sharp decreases of
 $H_{jet}$
are denoted with star symbols in the figure). For
$H_{jet}$
are denoted with star symbols in the figure). For
 $U_{\circ }=2.5~\text{m}~\text{s}^{-1}$
,
$U_{\circ }=2.5~\text{m}~\text{s}^{-1}$
,
 $H_{jet}$
was measured for thin and thick jets before and after breakdown, respectively. When
$H_{jet}$
was measured for thin and thick jets before and after breakdown, respectively. When
 $U_{\circ }=4.2~\text{m}~\text{s}^{-1}$
, the initial steep slope indicates the rise of a thin jet and the second gentle increases corresponds to the rise of a thick jet (figure 13
b). In the case of
$U_{\circ }=4.2~\text{m}~\text{s}^{-1}$
, the initial steep slope indicates the rise of a thin jet and the second gentle increases corresponds to the rise of a thick jet (figure 13
b). In the case of
 $AR~2$
, distinguishable jet breakdown occurs only when
$AR~2$
, distinguishable jet breakdown occurs only when
 $U_{\circ }=2.5~\text{m}~\text{s}^{-1}$
(at
$U_{\circ }=2.5~\text{m}~\text{s}^{-1}$
(at
 $t^{\ast }\simeq 9.5$
); at
$t^{\ast }\simeq 9.5$
); at
 $U_{\circ }=4.2~\text{m}~\text{s}^{-1}$
, the thin jet breaks into small droplets as soon as it is formed.
$U_{\circ }=4.2~\text{m}~\text{s}^{-1}$
, the thin jet breaks into small droplets as soon as it is formed.

Figure 13. Temporal variation of the continuous jet height (
 $H_{jet}$
) measured from the free surface: (a)
$H_{jet}$
) measured from the free surface: (a)
 $U_{\circ }=2.5~\text{m}~\text{s}^{-1}$
; (b)
$U_{\circ }=2.5~\text{m}~\text{s}^{-1}$
; (b)
 $4.2~\text{m}~\text{s}^{-1}$
. ●,
$4.2~\text{m}~\text{s}^{-1}$
. ●,
 $AR~1$
; ○,
$AR~1$
; ○,
 $AR~2$
; ▫,
$AR~2$
; ▫,
 $AR~4$
. The star symbols denote the breakdown of the corresponding jet.
$AR~4$
. The star symbols denote the breakdown of the corresponding jet.
The necking of liquid jets is well known in relation to the role of surface tension, such that the perturbation on a liquid filament surface grows at a critical condition (Rayleigh–Plateau instability) (Plateau Reference Plateau1873; Rayleigh Reference Rayleigh1878). To assess the breakdown of the present jet flows, the relevant parameters are summarized in table 2. The equivalent radius (
 $R_{t}$
) of the jet tip was measured at the moment that the jet reached the maximum height (
$R_{t}$
) of the jet tip was measured at the moment that the jet reached the maximum height (
 $H_{jet,max}$
). We measured
$H_{jet,max}$
). We measured
 $R_{t}$
by assuming that the jet-tip shape is spherical. The corresponding value of the Ohnesorge number (
$R_{t}$
by assuming that the jet-tip shape is spherical. The corresponding value of the Ohnesorge number (
 $Oh=\unicode[STIX]{x1D707}/(\unicode[STIX]{x1D70C}R_{t}\unicode[STIX]{x1D70E})^{0.5}$
) was obtained in each case, which indicates the ratio of the viscous time scale to the capillary time scale and has been employed as an important variable in the pinch-off of viscous liquid filaments (Notz & Basaran Reference Notz and Basaran2004; Eggers & Villermaux Reference Eggers and Villermaux2008; Driessen et al.
Reference Driessen, Jeurissen, Wijshoff, Toschi and Lohse2013). As
$Oh=\unicode[STIX]{x1D707}/(\unicode[STIX]{x1D70C}R_{t}\unicode[STIX]{x1D70E})^{0.5}$
) was obtained in each case, which indicates the ratio of the viscous time scale to the capillary time scale and has been employed as an important variable in the pinch-off of viscous liquid filaments (Notz & Basaran Reference Notz and Basaran2004; Eggers & Villermaux Reference Eggers and Villermaux2008; Driessen et al.
Reference Driessen, Jeurissen, Wijshoff, Toschi and Lohse2013). As
 $AR$
increases,
$AR$
increases,
 $Oh$
tends to decrease for both impact velocities (table 2).
$Oh$
tends to decrease for both impact velocities (table 2).
Finally, the aspect ratio of a jet is defined as
 $L_{\circ }=H_{jet,max}/(2R_{t})$
. Notz & Basaran (Reference Notz and Basaran2004) investigated the critical condition of liquid filament breakup and found that the critical
$L_{\circ }=H_{jet,max}/(2R_{t})$
. Notz & Basaran (Reference Notz and Basaran2004) investigated the critical condition of liquid filament breakup and found that the critical
 $L_{\circ }$
for jet breakdown increases with increasing
$L_{\circ }$
for jet breakdown increases with increasing
 $Oh$
, below which the liquid film does not break. They reported that the critical
$Oh$
, below which the liquid film does not break. They reported that the critical
 $L_{\circ }$
is
$L_{\circ }$
is
 $5.5\pm 0.5$
for
$5.5\pm 0.5$
for
 $Oh\simeq 0.001$
. In the present results, jet pinch-off occurred in the cases of
$Oh\simeq 0.001$
. In the present results, jet pinch-off occurred in the cases of
 $AR~1{-}2$
when
$AR~1{-}2$
when
 $U_{\circ }=2.5~\text{m}~\text{s}^{-1}$
and
$U_{\circ }=2.5~\text{m}~\text{s}^{-1}$
and
 $AR~1$
when
$AR~1$
when
 $U_{\circ }=4.2~\text{m}~\text{s}^{-1}$
, in which cases
$U_{\circ }=4.2~\text{m}~\text{s}^{-1}$
, in which cases
 $L_{\circ }$
is larger than about
$L_{\circ }$
is larger than about
 $5.0$
and
$5.0$
and
 $Oh$
is slightly larger than 0.001 (table 2). As shown in figure 4, the present breakdown occurs mostly in the form of end pinching (jet-tip breakdown) (Stone, Bentley & Leal Reference Stone, Bentley and Leal1986), which has been suggested as a main cause at
$Oh$
is slightly larger than 0.001 (table 2). As shown in figure 4, the present breakdown occurs mostly in the form of end pinching (jet-tip breakdown) (Stone, Bentley & Leal Reference Stone, Bentley and Leal1986), which has been suggested as a main cause at
 $Oh\lesssim 0.1$
(Driessen et al.
Reference Driessen, Jeurissen, Wijshoff, Toschi and Lohse2013). Thus, it is understood that the viscosity influenced the jet breakdown in the present cases. At
$Oh\lesssim 0.1$
(Driessen et al.
Reference Driessen, Jeurissen, Wijshoff, Toschi and Lohse2013). Thus, it is understood that the viscosity influenced the jet breakdown in the present cases. At
 $Oh\gtrsim 0.1$
, breakdown will occur due to the Rayleigh–Plateau instability. The existence of a critical aspect ratio also indicates that there is a relation between the inertia and capillary forces. That is,
$Oh\gtrsim 0.1$
, breakdown will occur due to the Rayleigh–Plateau instability. The existence of a critical aspect ratio also indicates that there is a relation between the inertia and capillary forces. That is,
 $R_{t}$
is associated with the capillary force and
$R_{t}$
is associated with the capillary force and
 $H_{jet,max}$
is related to the lifetime (inertia) of a jet. As
$H_{jet,max}$
is related to the lifetime (inertia) of a jet. As
 $AR$
increases,
$AR$
increases,
 $R_{t}$
increases and the jet rise velocity decreases. As
$R_{t}$
increases and the jet rise velocity decreases. As
 $R_{t}$
decreases, the jet becomes more susceptible to breakdown. Jet pinch-off was not observed for
$R_{t}$
decreases, the jet becomes more susceptible to breakdown. Jet pinch-off was not observed for
 $AR\geqslant 4.0$
and
$AR\geqslant 4.0$
and
 $AR\geqslant 2.0$
when
$AR\geqslant 2.0$
when
 $U_{\circ }=2.5~\text{m}~\text{s}^{-1}$
and
$U_{\circ }=2.5~\text{m}~\text{s}^{-1}$
and
 $4.2~\text{m}~\text{s}^{-1}$
, respectively, which supports this interpretation.
$4.2~\text{m}~\text{s}^{-1}$
, respectively, which supports this interpretation.
Table 2. Measurement of
 $R_{t}$
at
$R_{t}$
at
 $H_{jet,max}$
. The corresponding values of
$H_{jet,max}$
. The corresponding values of
 $Oh$
and
$Oh$
and
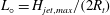 $L_{\circ }=H_{jet,max}/(2R_{t})$
were calculated.
$L_{\circ }=H_{jet,max}/(2R_{t})$
were calculated.

4 Water entry of a projectile with a cavity
4.1 Overall description of the free-surface deformation
In this section, we describe the water entry of a projectile with a rough front. Except the roughness (figure 1
b), the other conditions were same as those considered in § 3. The representative temporal evolutions of a splash (jet) and cavity are shown for
 $U_{\circ }=2.5~\text{m}~\text{s}^{-1}$
(figure 14) and
$U_{\circ }=2.5~\text{m}~\text{s}^{-1}$
(figure 14) and
 $4.2~\text{m}~\text{s}^{-1}$
(figure 15). Compared to the case with a smooth front part (figures 2 and 3), the differences in the free-surface deformation are clear in terms of an underwater cavity and a splash above the free surface. For the cases considered, a splash is generally formed after impact (
$4.2~\text{m}~\text{s}^{-1}$
(figure 15). Compared to the case with a smooth front part (figures 2 and 3), the differences in the free-surface deformation are clear in terms of an underwater cavity and a splash above the free surface. For the cases considered, a splash is generally formed after impact (
 $t^{\ast }<1.0$
and
$t^{\ast }<1.0$
and
 $t^{\ast }<2.0$
for
$t^{\ast }<2.0$
for
 $U_{\circ }=2.5~\text{m}~\text{s}^{-1}$
and
$U_{\circ }=2.5~\text{m}~\text{s}^{-1}$
and
 $4.2~\text{m}~\text{s}^{-1}$
, respectively) (figures 14 and 15), which developed from horizontal ejecta, as explained by Truscott et al. (Reference Truscott, Epps and Belden2014). As time progresses, the splash evolves further and converges into a dome, followed by the necking (or pinch-off) of an underwater cavity. For the case of
$4.2~\text{m}~\text{s}^{-1}$
, respectively) (figures 14 and 15), which developed from horizontal ejecta, as explained by Truscott et al. (Reference Truscott, Epps and Belden2014). As time progresses, the splash evolves further and converges into a dome, followed by the necking (or pinch-off) of an underwater cavity. For the case of
 $AR~8$
, the projectile itself interferes with the processes of dome closure and cavity pinch-off (figures 14
d, 15
d). The cavity pinch-off induces two vertical jets: one is forced upward through the dome and the other is ejected downward toward the falling projectile. Later, the splash and upward jet break down in a complex manner. Compared to the case of
$AR~8$
, the projectile itself interferes with the processes of dome closure and cavity pinch-off (figures 14
d, 15
d). The cavity pinch-off induces two vertical jets: one is forced upward through the dome and the other is ejected downward toward the falling projectile. Later, the splash and upward jet break down in a complex manner. Compared to the case of
 $U_{\circ }=4.2~\text{m}~\text{s}^{-1}$
(figure 15), the shapes of the splash and cavity, for
$U_{\circ }=4.2~\text{m}~\text{s}^{-1}$
(figure 15), the shapes of the splash and cavity, for
 $U_{\circ }=2.5~\text{m}~\text{s}^{-1}$
, are less organized (i.e. axisymmetry is disturbed and the dome closure is not completed); thus, their volumes are reduced at a lower
$U_{\circ }=2.5~\text{m}~\text{s}^{-1}$
, are less organized (i.e. axisymmetry is disturbed and the dome closure is not completed); thus, their volumes are reduced at a lower
 $U_{\circ }$
(figure 14).
$U_{\circ }$
(figure 14).

Figure 14. Splash and cavity formation by the water entry of a body with a rough surface at
 $U_{\circ }=2.5~\text{m}~\text{s}^{-1}$
: (a)
$U_{\circ }=2.5~\text{m}~\text{s}^{-1}$
: (a)
 $AR=1.0$
; (b) 2.0; (c) 4.0 and (d) 8.0. The numbers in each image denote
$AR=1.0$
; (b) 2.0; (c) 4.0 and (d) 8.0. The numbers in each image denote
 $t^{\ast }$
.
$t^{\ast }$
.

Figure 15. Splash and cavity formation by the water entry of a body with a rough surface at
 $U_{\circ }=4.2~\text{m}~\text{s}^{-1}$
: (a)
$U_{\circ }=4.2~\text{m}~\text{s}^{-1}$
: (a)
 $AR=1.0$
; (b) 2.0; (c) 4.0 and (d) 8.0. The numbers in each image denote
$AR=1.0$
; (b) 2.0; (c) 4.0 and (d) 8.0. The numbers in each image denote
 $t^{\ast }$
.
$t^{\ast }$
.
In figure 16, the process of splash formation for the case of
 $AR~1$
is shown for both impact velocities. With a smooth surface, the water film rises along the body surface and converges at the rear pole (figure 6); however, it cannot move along the rough surface and instead separates early to create a splash shortly after the projectile impacts the free surface. It should be noted that the separation of a water film also occurs from a smooth body surface if the inertia of the impacting body is sufficiently large (Thoroddsen et al.
Reference Thoroddsen, Etoh, Takehara and Takano2004). Latka et al. (Reference Latka, Strandburg-Peshkin, Driscoll, Stevens and Nagel2012) performed an experiment in which a liquid droplet impacted a rough surface, producing a splash immediately after the collision. As the roughness increases, droplets are strongly prevented from transforming into thin liquid sheets and early splashing at the advancing contact line is encouraged. This phenomenon has been attributed to a large force required for the liquid to penetrate into the voids between roughness features while climbing the body surface (Kubiak et al.
Reference Kubiak, Wilson, Mathia and Carval2011). Similarly, in the present case, the roughness of the sphere surface prevents water from forming a stable liquid film on it but encourages an early separation to create a splash. On the other hand, the speed of a water film is lower at a lower impact velocity, enabling it to move further along the body surface without being affected by the surface roughness (figure 16
a). Zhao et al. (Reference Zhao, Chen and Wang2014) reported that a splash is not formed in the water entry of a sphere even when the surface is rough if the impact velocity is sufficiently low that the water film can fully fill the voids between roughness features. Since we applied randomly distributed roughness features, the separation position of a water film differs locally around the periphery (figure 16
a). This non-uniformity of the roughness causes asymmetry of the splash (and underwater cavity), which decreases with increasing
$AR~1$
is shown for both impact velocities. With a smooth surface, the water film rises along the body surface and converges at the rear pole (figure 6); however, it cannot move along the rough surface and instead separates early to create a splash shortly after the projectile impacts the free surface. It should be noted that the separation of a water film also occurs from a smooth body surface if the inertia of the impacting body is sufficiently large (Thoroddsen et al.
Reference Thoroddsen, Etoh, Takehara and Takano2004). Latka et al. (Reference Latka, Strandburg-Peshkin, Driscoll, Stevens and Nagel2012) performed an experiment in which a liquid droplet impacted a rough surface, producing a splash immediately after the collision. As the roughness increases, droplets are strongly prevented from transforming into thin liquid sheets and early splashing at the advancing contact line is encouraged. This phenomenon has been attributed to a large force required for the liquid to penetrate into the voids between roughness features while climbing the body surface (Kubiak et al.
Reference Kubiak, Wilson, Mathia and Carval2011). Similarly, in the present case, the roughness of the sphere surface prevents water from forming a stable liquid film on it but encourages an early separation to create a splash. On the other hand, the speed of a water film is lower at a lower impact velocity, enabling it to move further along the body surface without being affected by the surface roughness (figure 16
a). Zhao et al. (Reference Zhao, Chen and Wang2014) reported that a splash is not formed in the water entry of a sphere even when the surface is rough if the impact velocity is sufficiently low that the water film can fully fill the voids between roughness features. Since we applied randomly distributed roughness features, the separation position of a water film differs locally around the periphery (figure 16
a). This non-uniformity of the roughness causes asymmetry of the splash (and underwater cavity), which decreases with increasing
 $U_{\circ }$
(figure 16
b).
$U_{\circ }$
(figure 16
b).
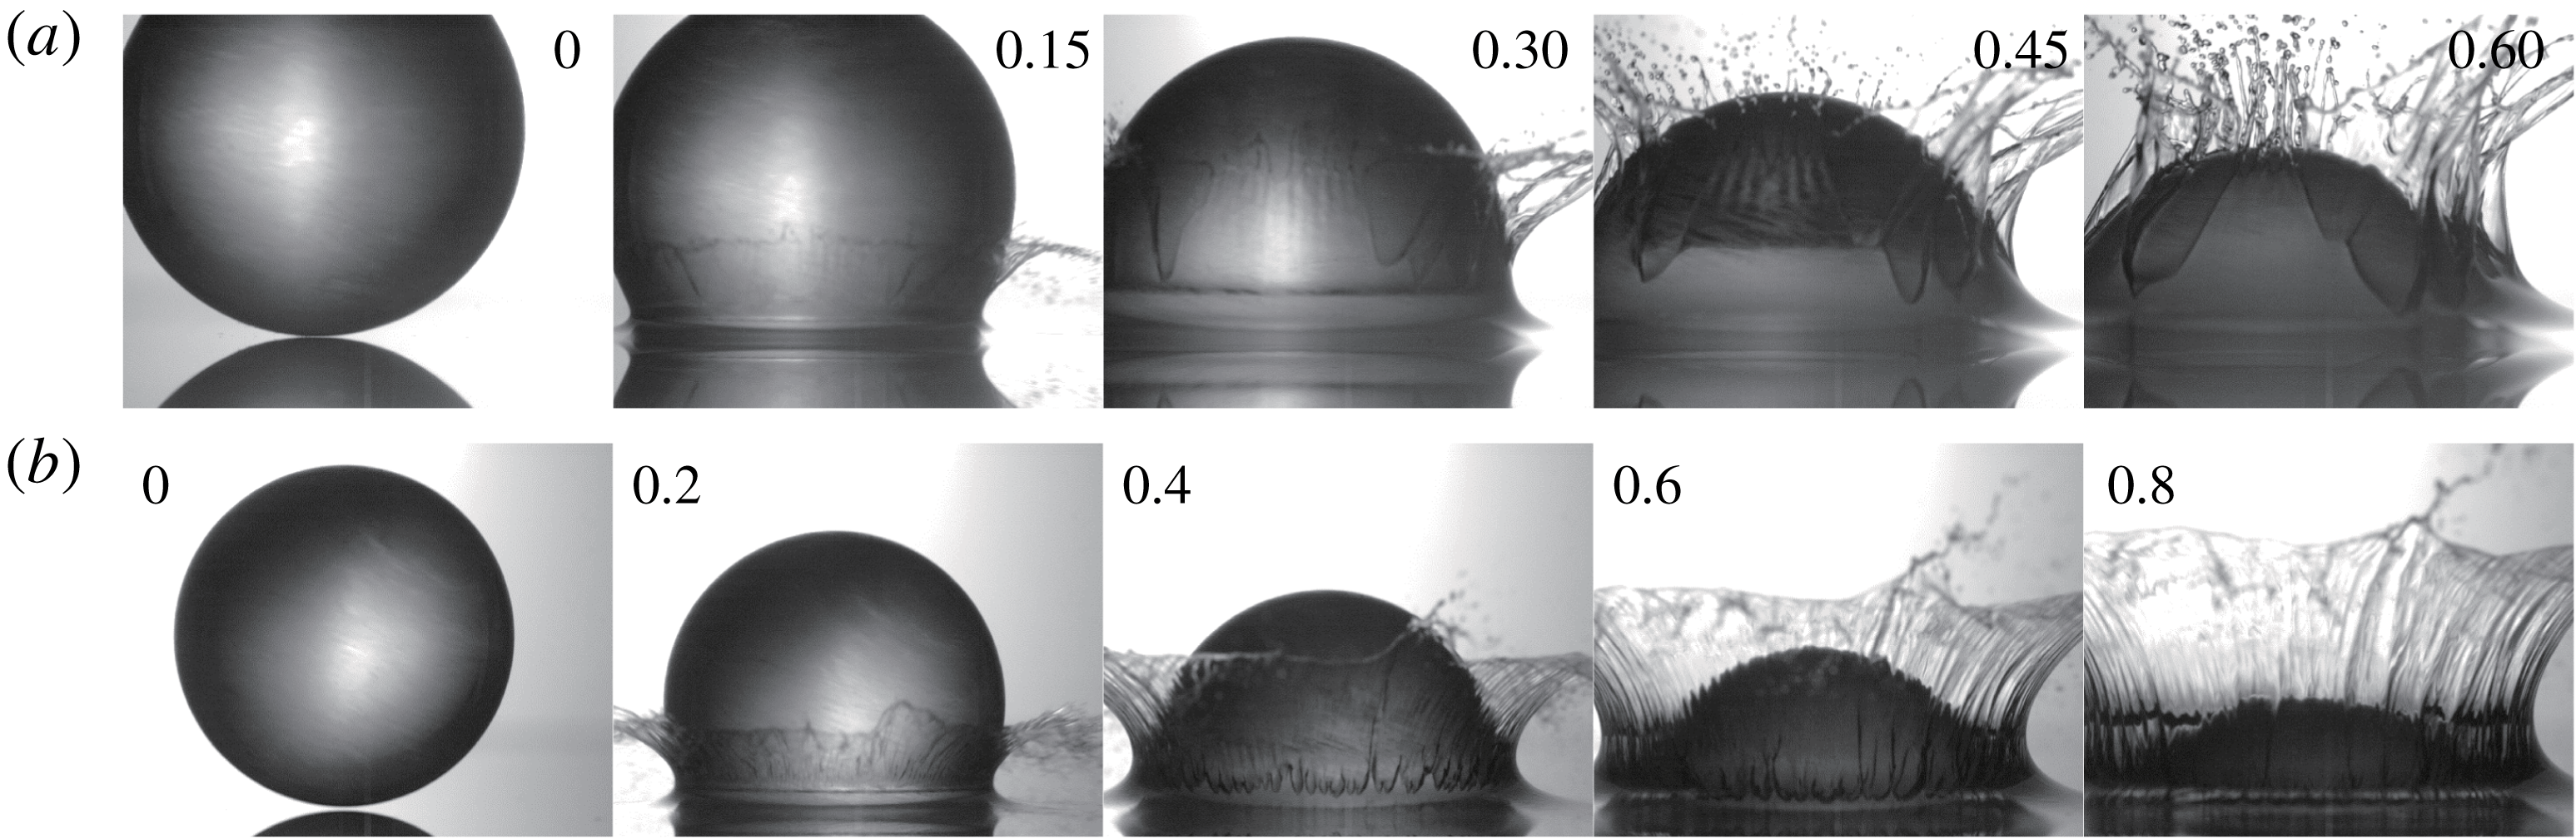
Figure 16. Splash formation above a free surface upon the water entry of a body (with a rough surface) at (a)
 $U_{o}=2.5~\text{m}~\text{s}^{-1}$
and (b)
$U_{o}=2.5~\text{m}~\text{s}^{-1}$
and (b)
 $4.2~\text{m}~\text{s}^{-1}$
. The numbers in each image denotes
$4.2~\text{m}~\text{s}^{-1}$
. The numbers in each image denotes
 $t^{\ast }$
.
$t^{\ast }$
.
Figure 17. Temporal variation of
 $H_{s}$
: (a)
$H_{s}$
: (a)
 $U_{\circ }=2.5~\text{m}~\text{s}^{-1}$
; (b)
$U_{\circ }=2.5~\text{m}~\text{s}^{-1}$
; (b)
 $4.2~\text{m}~\text{s}^{-1}$
. ●,
$4.2~\text{m}~\text{s}^{-1}$
. ●,
 $AR~1$
; ○,
$AR~1$
; ○,
 $AR~2$
; ▫,
$AR~2$
; ▫,
 $AR~4$
; ♢,
$AR~4$
; ♢,
 $AR~8$
.
$AR~8$
.
4.2 Splash and underwater cavity formation
To quantity the effects of
 $AR$
and
$AR$
and
 $U_{\circ }$
on splash and cavity formation, the temporal variations of the height (
$U_{\circ }$
on splash and cavity formation, the temporal variations of the height (
 $H_{s}$
) and width (
$H_{s}$
) and width (
 $W_{s}$
) of a splash are plotted in figures 17 and 18, respectively. Here, we used the portion of a continuously connected water film in a splash, detected by applying a binarization and a Wiener filter to the raw images.
$W_{s}$
) of a splash are plotted in figures 17 and 18, respectively. Here, we used the portion of a continuously connected water film in a splash, detected by applying a binarization and a Wiener filter to the raw images.
 $H_{s}$
is defined as the vertical distance from the free surface to the highest position in the detected water film and the horizontal distance between them was designated as
$H_{s}$
is defined as the vertical distance from the free surface to the highest position in the detected water film and the horizontal distance between them was designated as
 $W_{s}$
(see the insets in figures 17 and 18). After dome closure, the positions at which the Worthington jet crosses the dome are used to determine
$W_{s}$
(see the insets in figures 17 and 18). After dome closure, the positions at which the Worthington jet crosses the dome are used to determine
 $H_{s}$
, and
$H_{s}$
, and
 $W_{s}$
is measured until the dome is closed. The splash size tends to increase with increasing
$W_{s}$
is measured until the dome is closed. The splash size tends to increase with increasing
 $AR$
for lower
$AR$
for lower
 $U_{\circ }=2.5~\text{m}~\text{s}^{-1}$
(figures 17
a, 18
a), but the tendency is reversed for
$U_{\circ }=2.5~\text{m}~\text{s}^{-1}$
(figures 17
a, 18
a), but the tendency is reversed for
 $U_{\circ }=4.2~\text{m}~\text{s}^{-1}$
(figures 17
b, 18
b). As mentioned above, the water film separates later by filling some of the voids between roughness features when
$U_{\circ }=4.2~\text{m}~\text{s}^{-1}$
(figures 17
b, 18
b). As mentioned above, the water film separates later by filling some of the voids between roughness features when
 $U_{\circ }$
is low. Since the sinking velocity of a projectile increases with increasing
$U_{\circ }$
is low. Since the sinking velocity of a projectile increases with increasing
 $AR$
(see figure 23), there is not enough time for the liquid film to fill the voids on a rough surface. The downward velocity of a nose immediately after impact (
$AR$
(see figure 23), there is not enough time for the liquid film to fill the voids on a rough surface. The downward velocity of a nose immediately after impact (
 $t^{\ast }<5.0$
) exhibits the same trend as that shown in figure 23. Consequently, the separation occurs earlier and the splash volume increases. Thus, the case of
$t^{\ast }<5.0$
) exhibits the same trend as that shown in figure 23. Consequently, the separation occurs earlier and the splash volume increases. Thus, the case of
 $AR~1$
has the shortest splash height and width when
$AR~1$
has the shortest splash height and width when
 $U_{\circ }=2.5~\text{m}~\text{s}^{-1}$
. At this
$U_{\circ }=2.5~\text{m}~\text{s}^{-1}$
. At this
 $U_{\circ }$
, the splash height increases to a peak and then decreases (figure 17
a). The maximum height increases with increasing
$U_{\circ }$
, the splash height increases to a peak and then decreases (figure 17
a). The maximum height increases with increasing
 $AR$
and becomes almost the same for
$AR$
and becomes almost the same for
 $AR~4$
and
$AR~4$
and
 $AR~8$
.
$AR~8$
.
 $W_{s}$
follows a trend similar to that of
$W_{s}$
follows a trend similar to that of
 $H_{s}$
and remains constant at later times (figure 18
a). The maximum width also increases with increasing
$H_{s}$
and remains constant at later times (figure 18
a). The maximum width also increases with increasing
 $AR$
. When
$AR$
. When
 $U_{\circ }=4.2~\text{m}~\text{s}^{-1}$
, on the other hand, the water film separates earlier and thus the splash size increases sharply at
$U_{\circ }=4.2~\text{m}~\text{s}^{-1}$
, on the other hand, the water film separates earlier and thus the splash size increases sharply at
 $t^{\ast }<3.0$
. The variation among
$t^{\ast }<3.0$
. The variation among
 $AR$
values is negligible, indicating that the separation position of the water film is not affected, and the splash grows to almost the same maximum height and width (figures 17
b, 18
b). After the splash converges into a dome, its height decreases (
$AR$
values is negligible, indicating that the separation position of the water film is not affected, and the splash grows to almost the same maximum height and width (figures 17
b, 18
b). After the splash converges into a dome, its height decreases (
 $5.0\lesssim t^{\ast }\lesssim 7.0$
). Subsequently, the upward Worthington jet is ejected to the free surface due to the pinch-off of an underwater cavity, by which the air contained in the cavity pops up, resulting in a slight increase of
$5.0\lesssim t^{\ast }\lesssim 7.0$
). Subsequently, the upward Worthington jet is ejected to the free surface due to the pinch-off of an underwater cavity, by which the air contained in the cavity pops up, resulting in a slight increase of
 $H_{s}$
at
$H_{s}$
at
 $t^{\ast }=7.0{-}15.0$
. In figure 15 (at
$t^{\ast }=7.0{-}15.0$
. In figure 15 (at
 $t^{\ast }=9.0$
and 14.0), the air inside the upper cavity after the pinch-off moves together with the vertical jet and the dome expands. The Worthington jet also exists at
$t^{\ast }=9.0$
and 14.0), the air inside the upper cavity after the pinch-off moves together with the vertical jet and the dome expands. The Worthington jet also exists at
 $U_{\circ }=2.5~\text{m}~\text{s}^{-1}$
, but no secondary peak of
$U_{\circ }=2.5~\text{m}~\text{s}^{-1}$
, but no secondary peak of
 $H_{s}$
exists (figure 17
a) due to the incomplete dome closure (figure 14). Finally,
$H_{s}$
exists (figure 17
a) due to the incomplete dome closure (figure 14). Finally,
 $H_{s}$
decreases as the dome collapses at
$H_{s}$
decreases as the dome collapses at
 $t^{\ast }>15.0$
. In the case of
$t^{\ast }>15.0$
. In the case of
 $AR~8$
, the secondary peak is not clearly observable and its magnitude is smaller than it is in the other cases. As shown in figure 15(d), the long projectile shape disturbs the completion of dome closure (and cavity pinch-off). However, the increase in jet height at
$AR~8$
, the secondary peak is not clearly observable and its magnitude is smaller than it is in the other cases. As shown in figure 15(d), the long projectile shape disturbs the completion of dome closure (and cavity pinch-off). However, the increase in jet height at
 $t^{\ast }=19.0$
(figure 15
d) is attributed to the annular jet caused by the entry of a long cylindrical body. On the other hand, the slopes of decreasing
$t^{\ast }=19.0$
(figure 15
d) is attributed to the annular jet caused by the entry of a long cylindrical body. On the other hand, the slopes of decreasing
 $H_{s}$
are almost the same for all
$H_{s}$
are almost the same for all
 $AR$
values (figure 17
b). As the splash forms,
$AR$
values (figure 17
b). As the splash forms,
 $W_{s}$
increases to the maximum (again the ascending slopes are not affected by
$W_{s}$
increases to the maximum (again the ascending slopes are not affected by
 $AR$
) and then decreases to form a dome (figure 18
b). As
$AR$
) and then decreases to form a dome (figure 18
b). As
 $AR$
increases, it takes less time to form a dome (i.e.
$AR$
increases, it takes less time to form a dome (i.e.
 $W_{s}/D=0$
). Since the splash impacts the side wall of the projectile while it transforms into a dome, the splash width saturates to
$W_{s}/D=0$
). Since the splash impacts the side wall of the projectile while it transforms into a dome, the splash width saturates to
 $W_{s}/D=1.0$
for the case of
$W_{s}/D=1.0$
for the case of
 $AR~8$
.
$AR~8$
.

Figure 18. Temporal variation of
 $W_{s}$
corresponding to
$W_{s}$
corresponding to
 $H_{s}$
: (a)
$H_{s}$
: (a)
 $U_{\circ }=2.5~\text{m}~\text{s}^{-1}$
; (b)
$U_{\circ }=2.5~\text{m}~\text{s}^{-1}$
; (b)
 $4.2~\text{m}~\text{s}^{-1}$
. ●,
$4.2~\text{m}~\text{s}^{-1}$
. ●,
 $AR~1$
; ○,
$AR~1$
; ○,
 $AR~2$
; ▫,
$AR~2$
; ▫,
 $AR~4$
; ♢,
$AR~4$
; ♢,
 $AR~8$
.
$AR~8$
.

Figure 19. Process of a cavity pinch-off behind a body with a rough front surface at (a–d)
 $U_{\circ }=2.5~\text{m}~\text{s}^{-1}$
and (e–h)
$U_{\circ }=2.5~\text{m}~\text{s}^{-1}$
and (e–h)
 $4.2~\text{m}~\text{s}^{-1}$
: (a,e)
$4.2~\text{m}~\text{s}^{-1}$
: (a,e)
 $AR~1$
, (b,f)
$AR~1$
, (b,f)
 $AR~2$
, (c,g)
$AR~2$
, (c,g)
 $AR~4$
, (d,h)
$AR~4$
, (d,h)
 $AR~8$
. The numbers in each image denote
$AR~8$
. The numbers in each image denote
 $t^{\ast }$
.
$t^{\ast }$
.

Figure 20. Temporal variation of
 $V_{c}$
: (a)
$V_{c}$
: (a)
 $U_{\circ }=2.5~\text{m}~\text{s}^{-1}$
; (b)
$U_{\circ }=2.5~\text{m}~\text{s}^{-1}$
; (b)
 $4.2~\text{m}~\text{s}^{-1}$
. ●,
$4.2~\text{m}~\text{s}^{-1}$
. ●,
 $AR~1$
; ○,
$AR~1$
; ○,
 $AR~2$
; ▫,
$AR~2$
; ▫,
 $AR~4$
; ♢,
$AR~4$
; ♢,
 $AR~8$
.
$AR~8$
.
Under the free surface, cavity pinch-off occurs, as shown in figure 19 (see supplementary movie S2 as well). A typical deep seal is observable for
 $AR~1{-}2$
, but an additional pinch-off occurs first at the side wall of the projectile for
$AR~1{-}2$
, but an additional pinch-off occurs first at the side wall of the projectile for
 $AR\geqslant 4.0$
. As
$AR\geqslant 4.0$
. As
 $U_{\circ }$
increases, the cavity formation and subsequent pinch-off process occur symmetrically. Figure 20 depicts the cavity volume (
$U_{\circ }$
increases, the cavity formation and subsequent pinch-off process occur symmetrically. Figure 20 depicts the cavity volume (
 $V_{c}$
) calculated by assuming its axisymmetry; that is, the outer profiles of the cavity and projectile were revolved and their volumes were subtracted to obtain these values (see the inset in figure 20). The projectiles of
$V_{c}$
) calculated by assuming its axisymmetry; that is, the outer profiles of the cavity and projectile were revolved and their volumes were subtracted to obtain these values (see the inset in figure 20). The projectiles of
 $AR~4{-}8$
at
$AR~4{-}8$
at
 $U_{\circ }=2.5~\text{m}~\text{s}^{-1}$
have very small (and almost constant) cavity sizes initially, but the size suddenly increases (figure 20
a). In these cases, the low impact velocity provides a momentum that is insufficient to create a well-defined cavity; thus, the initial cavity is small. As the cavity shrinks after the pinch-off, a portion of air bubble sticks to the tail, which is dragged by the falling body (at
$U_{\circ }=2.5~\text{m}~\text{s}^{-1}$
have very small (and almost constant) cavity sizes initially, but the size suddenly increases (figure 20
a). In these cases, the low impact velocity provides a momentum that is insufficient to create a well-defined cavity; thus, the initial cavity is small. As the cavity shrinks after the pinch-off, a portion of air bubble sticks to the tail, which is dragged by the falling body (at
 $t^{\ast }=4.0{-}4.6$
in figure 19
c). Consequently, the cavity size appears to increase suddenly. On the other hand, the projectiles of
$t^{\ast }=4.0{-}4.6$
in figure 19
c). Consequently, the cavity size appears to increase suddenly. On the other hand, the projectiles of
 $AR~1{-}2$
have much larger cavities, which increase in size from the beginning. In these cases, the body occupies smaller portions of the cavity than in the cases of
$AR~1{-}2$
have much larger cavities, which increase in size from the beginning. In these cases, the body occupies smaller portions of the cavity than in the cases of
 $AR~4{-}8$
. For
$AR~4{-}8$
. For
 $AR~1{-}2$
, the cavity expands to the peak, after which the air pressure becomes lower than the hydrostatic pressure of the surrounding water, and then shrinks gradually and necking occurs (figure 20
a). When
$AR~1{-}2$
, the cavity expands to the peak, after which the air pressure becomes lower than the hydrostatic pressure of the surrounding water, and then shrinks gradually and necking occurs (figure 20
a). When
 $AR=1.0$
, the cavity is larger and necking occurs earlier than
$AR=1.0$
, the cavity is larger and necking occurs earlier than
 $AR~2$
.
$AR~2$
.
When
 $U_{\circ }=4.2~\text{m}~\text{s}^{-1}$
(figure 20
b), the initial (
$U_{\circ }=4.2~\text{m}~\text{s}^{-1}$
(figure 20
b), the initial (
 $t^{\ast }\lesssim 3.5$
) cavity size is almost the same. At
$t^{\ast }\lesssim 3.5$
) cavity size is almost the same. At
 $t^{\ast }>4.0$
, the
$t^{\ast }>4.0$
, the
 $V_{c}$
increases as
$V_{c}$
increases as
 $AR$
increases (except
$AR$
increases (except
 $AR~8$
), because the additional air is pushed down to the cavity while the dome is formed above a free surface. As shown in figure 17(b),
$AR~8$
), because the additional air is pushed down to the cavity while the dome is formed above a free surface. As shown in figure 17(b),
 $H_{s}$
decreases at
$H_{s}$
decreases at
 $t^{\ast }=4.0{-}7.0$
, while the splash crown collapses into a dome. As the splash converges, air is pushed around inside the cavity.
$t^{\ast }=4.0{-}7.0$
, while the splash crown collapses into a dome. As the splash converges, air is pushed around inside the cavity.
 $H_{s}$
decreases with increasing
$H_{s}$
decreases with increasing
 $AR$
, inducing cavity expansion. For the largest
$AR$
, inducing cavity expansion. For the largest
 $AR$
of 8.0, both dome closure and cavity pinch-off occur on the side wall of the body, indicating that they occur earlier than they do with the other
$AR$
of 8.0, both dome closure and cavity pinch-off occur on the side wall of the body, indicating that they occur earlier than they do with the other
 $AR$
values. Consequently, the cavity with
$AR$
values. Consequently, the cavity with
 $AR~8$
is less developed and small. The cavity is the smallest when
$AR~8$
is less developed and small. The cavity is the smallest when
 $AR=1.0$
, because dome closure occurs the latest among the test cases, and the cavity contraction due to hydrostatic pressure is stronger than the expansion due to the dragged air.
$AR=1.0$
, because dome closure occurs the latest among the test cases, and the cavity contraction due to hydrostatic pressure is stronger than the expansion due to the dragged air.
Meanwhile, the instant at which the cavity size reaches the maximum occurs earlier as
 $AR$
decreases, except for
$AR$
decreases, except for
 $AR~8$
, agreeing with the observation that cavity contraction and pinch-off occur earlier as
$AR~8$
, agreeing with the observation that cavity contraction and pinch-off occur earlier as
 $AR$
decreases. After the cavity pinch-off, the Worthington jet pops up and the splash height increases (
$AR$
decreases. After the cavity pinch-off, the Worthington jet pops up and the splash height increases (
 $t^{\ast }=7.0{-}13.0$
in figure 17
b). In particular, the domes are considerably larger for
$t^{\ast }=7.0{-}13.0$
in figure 17
b). In particular, the domes are considerably larger for
 $AR~2{-}4$
, because the cavity below the free surface is larger (figure 20
b). This finding agrees with the fact that
$AR~2{-}4$
, because the cavity below the free surface is larger (figure 20
b). This finding agrees with the fact that
 $H_{s}$
increases to almost the same position at
$H_{s}$
increases to almost the same position at
 $t^{\ast }=12.5$
in figure 17(b) when
$t^{\ast }=12.5$
in figure 17(b) when
 $AR=1.0{-}4.0$
. To support this observation, we calculated the sum of the cavity and dome volumes,
$AR=1.0{-}4.0$
. To support this observation, we calculated the sum of the cavity and dome volumes,
 $V_{c}/D^{3}$
and
$V_{c}/D^{3}$
and
 $V_{d}/D^{3}$
, respectively, at
$V_{d}/D^{3}$
, respectively, at
 $t^{\ast }=5.0$
, which has similar values of 11.0–12.5 for
$t^{\ast }=5.0$
, which has similar values of 11.0–12.5 for
 $AR~1{-}4$
.
$AR~1{-}4$
.

Figure 21. Airflow above a free surface during splash formation by a sphere when
 $U_{\circ }=2.5~\text{m}~\text{s}^{-1}$
. The splash has been masked, and the numbers in each image denote
$U_{\circ }=2.5~\text{m}~\text{s}^{-1}$
. The splash has been masked, and the numbers in each image denote
 $t^{\ast }$
.
$t^{\ast }$
.
Table 3. Measured values of
 $t_{d}$
,
$t_{d}$
,
 $t_{p}$
,
$t_{p}$
,
 $H_{p}$
,
$H_{p}$
,
 $H$
and
$H$
and
 $H_{p}/H$
when
$H_{p}/H$
when
 $U_{\circ }=4.2~\text{m}~\text{s}^{-1}$
.
$U_{\circ }=4.2~\text{m}~\text{s}^{-1}$
.

Since the measurement repeatability was better for
 $U_{\circ }=4.2~\text{m}~\text{s}^{-1}$
, it was analysed further. We measured the instants of the dome closure (
$U_{\circ }=4.2~\text{m}~\text{s}^{-1}$
, it was analysed further. We measured the instants of the dome closure (
 $t_{d}$
) and cavity pinch-off (
$t_{d}$
) and cavity pinch-off (
 $t_{p}$
). The positions of cavity pinch-off (
$t_{p}$
). The positions of cavity pinch-off (
 $H_{p}$
) and the centre of the hemispherical head (
$H_{p}$
) and the centre of the hemispherical head (
 $H$
), both measured from the free surface, and their ratio (
$H$
), both measured from the free surface, and their ratio (
 $H_{p}/H$
) were also calculated (table 3). For
$H_{p}/H$
) were also calculated (table 3). For
 $AR~1{-}4$
, dome closure occurs earlier but cavity pinch-off is delayed as
$AR~1{-}4$
, dome closure occurs earlier but cavity pinch-off is delayed as
 $AR$
increases. Since the underwater speed of a sinking projectile increases with increasing
$AR$
increases. Since the underwater speed of a sinking projectile increases with increasing
 $AR$
(see figure 23),
$AR$
(see figure 23),
 $H$
increases, resulting in a decrease of
$H$
increases, resulting in a decrease of
 $H_{p}/H$
. This behaviour is the same as that resulting from increasing the density of a sphere, as reported by Aristoff et al. (Reference Aristoff, Truscott, Techet and Bush2010). They showed that cavity pinch-off occurs faster and closer to the free surface as the sphere density decreases. Thus, it is understood that the effective density of a projectile increases with increasing
$H_{p}/H$
. This behaviour is the same as that resulting from increasing the density of a sphere, as reported by Aristoff et al. (Reference Aristoff, Truscott, Techet and Bush2010). They showed that cavity pinch-off occurs faster and closer to the free surface as the sphere density decreases. Thus, it is understood that the effective density of a projectile increases with increasing
 $AR$
. For
$AR$
. For
 $AR~1{-}4$
, only the nose of the projectile touches the cavity, but the effective mass increases with increasing
$AR~1{-}4$
, only the nose of the projectile touches the cavity, but the effective mass increases with increasing
 $AR$
. For
$AR$
. For
 $AR~8$
,
$AR~8$
,
 $t_{d}$
and
$t_{d}$
and
 $t_{p}$
are strongly disturbed by the projectiles and are therefore the shortest. Since the dome and cavity dynamics are affected by the surrounding pressure, we measured the air velocity induced by the entry of a sphere (
$t_{p}$
are strongly disturbed by the projectiles and are therefore the shortest. Since the dome and cavity dynamics are affected by the surrounding pressure, we measured the air velocity induced by the entry of a sphere (
 $AR~1$
) above the free surface (figure 21). It can be seen that a substantial amount of the surrounding air is dragged into the splash, due to the cavity expansion. Likewise, the velocity of the entrained air (
$AR~1$
) above the free surface (figure 21). It can be seen that a substantial amount of the surrounding air is dragged into the splash, due to the cavity expansion. Likewise, the velocity of the entrained air (
 $v_{a}$
) was measured (immediately above the splash) for other
$v_{a}$
) was measured (immediately above the splash) for other
 $AR$
values when the body tail passed the end of a splash. When averaged for
$AR$
values when the body tail passed the end of a splash. When averaged for
 $-0.35\leqslant r/D\leqslant 0.35$
,
$-0.35\leqslant r/D\leqslant 0.35$
,
 $v_{a}/U_{\circ }$
was found to be 0.14, 0.20 and 0.27 for
$v_{a}/U_{\circ }$
was found to be 0.14, 0.20 and 0.27 for
 $AR~1$
,
$AR~1$
,
 $AR~2$
and
$AR~2$
and
 $AR~4$
, respectively. According to the Bernoulli equation, the increased
$AR~4$
, respectively. According to the Bernoulli equation, the increased
 $v_{a}$
induces a lower pressure, i.e. a greater pressure difference across the splash crown; thus, the dome closure is accelerated, as discussed by Marston et al. (Reference Marston, Truscott, Speirs, Mansoor and Thoroddsen2016).
$v_{a}$
induces a lower pressure, i.e. a greater pressure difference across the splash crown; thus, the dome closure is accelerated, as discussed by Marston et al. (Reference Marston, Truscott, Speirs, Mansoor and Thoroddsen2016).

Figure 22. Temporal variation of the vertical (
 $z$
) position of the centre of mass of the body: (a)
$z$
) position of the centre of mass of the body: (a)
 $U_{\circ }=2.5~\text{m}~\text{s}^{-1}$
; (b)
$U_{\circ }=2.5~\text{m}~\text{s}^{-1}$
; (b)
 $4.2~\text{m}~\text{s}^{-1}$
. The open and closed symbols correspond to smooth and rough surfaces, respectively.
$4.2~\text{m}~\text{s}^{-1}$
. The open and closed symbols correspond to smooth and rough surfaces, respectively.
 $z=0$
denotes the position of the undisturbed free surface.
$z=0$
denotes the position of the undisturbed free surface.
5 Effects of a cavity on the dynamics of a sinking projectile
In this section, we further assess the effects of cavity dynamics, which strongly affect the trajectory (i.e. hydrodynamic force) of the body (Truscott et al.
Reference Truscott, Epps and Techet2012; Shepard et al.
Reference Shepard, Abraham, Schwalbach, Kane, Siglin and Harrington2014; Mansoor et al.
Reference Mansoor, Vakarelski, Marston, Truscott and Thoroddsen2017; Vakarelski et al.
Reference Vakarelski, Klaseboer, Jetly, Mansoor, Aguirre-Pablo, Chan and Thoroddsen2017). Figure 22 shows the vertical (
 $z$
) position of the centre of mass of each projectile, which was measured as a midpoint between the centres of the spherical front and rear parts. To find these points, we binarized the raw images and applied a Wiener filter to highlight the outer profile. Then, we used a circle Hough transform to find the positions at which the probability of locating a circle was the highest. While matching to the size of the present projectile, the positions with the first and second highest probabilities were matched with the front and rear parts of the projectile. The velocity and acceleration of the projectile in the vertical direction are shown in figures 23 and 24, respectively. To calculate the velocity (or acceleration), it was first splined with a quintic function and differentiated (Truscott et al.
Reference Truscott, Epps and Techet2012). For the case of
$z$
) position of the centre of mass of each projectile, which was measured as a midpoint between the centres of the spherical front and rear parts. To find these points, we binarized the raw images and applied a Wiener filter to highlight the outer profile. Then, we used a circle Hough transform to find the positions at which the probability of locating a circle was the highest. While matching to the size of the present projectile, the positions with the first and second highest probabilities were matched with the front and rear parts of the projectile. The velocity and acceleration of the projectile in the vertical direction are shown in figures 23 and 24, respectively. To calculate the velocity (or acceleration), it was first splined with a quintic function and differentiated (Truscott et al.
Reference Truscott, Epps and Techet2012). For the case of
 $AR~1$
, the initial sinking speeds of spheres with smooth and rough surfaces are almost the same, but they deviate at
$AR~1$
, the initial sinking speeds of spheres with smooth and rough surfaces are almost the same, but they deviate at
 $t^{\ast }\simeq 10$
(for both
$t^{\ast }\simeq 10$
(for both
 $U_{\circ }$
values) which is the instant at which cavity pinch-off occurs. It is obvious that the body loses its momentum and decelerates due to buoyancy, as it sinks. However, after pinch-off, a downward jet is induced behind the body, which adds momentum; thus, the level of deceleration is less than it is for the smooth counterpart. Afterwards, the sinking slope becomes shallower and the sphere with a cavity travels farther in the vertical direction, while that with a smooth surface lags behind (figure 22). This trend can also be identified from the fact that the sinking velocity of a rough sphere is faster than that of a smooth sphere before it reaches terminal velocity (figure 23) (here the negative values denote downward velocities). Once terminal velocity is achieved, the difference between the two cases becomes small. Interestingly, when there is no cavity, the sinking velocity slightly increases and decreases again before reaching terminal velocity. Truscott et al. (Reference Truscott, Epps and Techet2012) attributed this phenomenon to the momentum transfer from the vortex shedding in the wake (i.e. sort of wake-induced path instability of a falling body Ern et al.
Reference Ern, Risso, Fabre and Magnaudet2012), which is delayed in the cavity-forming case. As shown in figure 25(a), the smooth sphere experiences a transverse movement (while rotating) due to the asymmetry in the wake vortices (since this instability is beyond the scope of this study, we will discuss this effect only briefly). Due to this change, the smooth sphere experiences an acceleration-deceleration stage and then reaches a balanced state (i.e. zero acceleration) (figure 24). However, the sphere with a rough surface reaches terminal velocity without experiencing the additional deceleration stage, because the vortex shedding is suppressed by the cavity. In fact, similar path instability occurs later with a rough surface, indicating that it is delayed due to the underwater cavity.
$U_{\circ }$
values) which is the instant at which cavity pinch-off occurs. It is obvious that the body loses its momentum and decelerates due to buoyancy, as it sinks. However, after pinch-off, a downward jet is induced behind the body, which adds momentum; thus, the level of deceleration is less than it is for the smooth counterpart. Afterwards, the sinking slope becomes shallower and the sphere with a cavity travels farther in the vertical direction, while that with a smooth surface lags behind (figure 22). This trend can also be identified from the fact that the sinking velocity of a rough sphere is faster than that of a smooth sphere before it reaches terminal velocity (figure 23) (here the negative values denote downward velocities). Once terminal velocity is achieved, the difference between the two cases becomes small. Interestingly, when there is no cavity, the sinking velocity slightly increases and decreases again before reaching terminal velocity. Truscott et al. (Reference Truscott, Epps and Techet2012) attributed this phenomenon to the momentum transfer from the vortex shedding in the wake (i.e. sort of wake-induced path instability of a falling body Ern et al.
Reference Ern, Risso, Fabre and Magnaudet2012), which is delayed in the cavity-forming case. As shown in figure 25(a), the smooth sphere experiences a transverse movement (while rotating) due to the asymmetry in the wake vortices (since this instability is beyond the scope of this study, we will discuss this effect only briefly). Due to this change, the smooth sphere experiences an acceleration-deceleration stage and then reaches a balanced state (i.e. zero acceleration) (figure 24). However, the sphere with a rough surface reaches terminal velocity without experiencing the additional deceleration stage, because the vortex shedding is suppressed by the cavity. In fact, similar path instability occurs later with a rough surface, indicating that it is delayed due to the underwater cavity.

Figure 23. Temporal variation of the vertical velocity (
 $v$
) of the body mass centre: (a)
$v$
) of the body mass centre: (a)
 $U_{\circ }=2.5~\text{m}~\text{s}^{-1}$
; (b)
$U_{\circ }=2.5~\text{m}~\text{s}^{-1}$
; (b)
 $4.2~\text{m}~\text{s}^{-1}$
. The open and closed symbols correspond to smooth and rough surfaces, respectively.
$4.2~\text{m}~\text{s}^{-1}$
. The open and closed symbols correspond to smooth and rough surfaces, respectively.

Figure 24. Temporal variation of the vertical acceleration (
 $a$
) of the body mass centre: (a)
$a$
) of the body mass centre: (a)
 $U_{\circ }=2.5~\text{m}~\text{s}^{-1}$
; (b)
$U_{\circ }=2.5~\text{m}~\text{s}^{-1}$
; (b)
 $4.2~\text{m}~\text{s}^{-1}$
. The open and closed symbols correspond to smooth and rough surfaces, respectively. Positive values denote acceleration in the upward direction (i.e. deceleration).
$4.2~\text{m}~\text{s}^{-1}$
. The open and closed symbols correspond to smooth and rough surfaces, respectively. Positive values denote acceleration in the upward direction (i.e. deceleration).

Figure 25. Underwater velocity fields and vorticity contours around a projectile with a smooth surface at
 $U_{\circ }=2.5~\text{m}~\text{s}^{-1}$
: (a)
$U_{\circ }=2.5~\text{m}~\text{s}^{-1}$
: (a)
 $AR~1$
, (b)
$AR~1$
, (b)
 $AR~2$
.
$AR~2$
.
 $z=0$
denotes the position of the undisturbed free surface, and the numbers in each image denote
$z=0$
denotes the position of the undisturbed free surface, and the numbers in each image denote
 $t^{\ast }$
.
$t^{\ast }$
.
Unlike the case of
 $AR~1$
, there are no differences between the vertical position time histories corresponding to the smooth and rough surfaces for
$AR~1$
, there are no differences between the vertical position time histories corresponding to the smooth and rough surfaces for
 $AR~2{-}4$
(figure 22). However, the sinking velocity shows a deviation (figure 23). In the present measurement domain, the sinking velocity decreases earlier and converges, but the achievement of terminal velocity is not captured for
$AR~2{-}4$
(figure 22). However, the sinking velocity shows a deviation (figure 23). In the present measurement domain, the sinking velocity decreases earlier and converges, but the achievement of terminal velocity is not captured for
 $AR\geqslant 2.0$
. For
$AR\geqslant 2.0$
. For
 $AR~2$
, the projectile with a rough surface sinks faster initially but behaves the same as that with a smooth surface later at a lower
$AR~2$
, the projectile with a rough surface sinks faster initially but behaves the same as that with a smooth surface later at a lower
 $U_{\circ }$
. In the early stage, the underwater cavity works to reduce the drag acting on the body, so the rough surface projectile moves faster at
$U_{\circ }$
. In the early stage, the underwater cavity works to reduce the drag acting on the body, so the rough surface projectile moves faster at
 $t^{\ast }<14$
when
$t^{\ast }<14$
when
 $U_{\circ }=2.5~\text{m}~\text{s}^{-1}$
. As the cavity departs away from the body after pinch-off, the sinking speed of the body with a rough surface becomes similar to that of the body with a smooth surface. Similarly to
$U_{\circ }=2.5~\text{m}~\text{s}^{-1}$
. As the cavity departs away from the body after pinch-off, the sinking speed of the body with a rough surface becomes similar to that of the body with a smooth surface. Similarly to
 $AR~1$
, the asymmetry in the wake causes the projectile to tumble, as shown in figure 25(b). In the measurement domain, the projectile with a smooth surface rotates twice during sinking, while that with a rough surface case does so only once (it is delayed due to the cavity). When
$AR~1$
, the asymmetry in the wake causes the projectile to tumble, as shown in figure 25(b). In the measurement domain, the projectile with a smooth surface rotates twice during sinking, while that with a rough surface case does so only once (it is delayed due to the cavity). When
 $U_{\circ }=4.2~\text{m}~\text{s}^{-1}$
, however, the projectile with a rough surface, which initially moves similarly to its smooth counterpart, decelerates more as time progresses (figure 23). In this situation, the projectile with a rough surface rotates once in our field of view as it sinks, while that with a smooth surface rotates three times (see supplementary movie S3). Although it is not clear why this trend is reversed even with the underwater cavity, we think that the relatively large amount of air attached to the body after the cavity pinch-off applies additional form drag to the body. However, this point should be investigated further in a future study. Despite the difference in the sinking-speed trends, for both
$U_{\circ }=4.2~\text{m}~\text{s}^{-1}$
, however, the projectile with a rough surface, which initially moves similarly to its smooth counterpart, decelerates more as time progresses (figure 23). In this situation, the projectile with a rough surface rotates once in our field of view as it sinks, while that with a smooth surface rotates three times (see supplementary movie S3). Although it is not clear why this trend is reversed even with the underwater cavity, we think that the relatively large amount of air attached to the body after the cavity pinch-off applies additional form drag to the body. However, this point should be investigated further in a future study. Despite the difference in the sinking-speed trends, for both
 $U_{\circ }$
values, the body with a rough surface decelerates more (figure 24), because of the large pressure drop in the wake after cavity pinch-off.
$U_{\circ }$
values, the body with a rough surface decelerates more (figure 24), because of the large pressure drop in the wake after cavity pinch-off.
When
 $AR=4.0$
, the body with a smooth surface sinks slightly faster than that with a rough surface at first (
$AR=4.0$
, the body with a smooth surface sinks slightly faster than that with a rough surface at first (
 $t^{\ast }\lesssim 12.0$
) for both
$t^{\ast }\lesssim 12.0$
) for both
 $U_{\circ }$
values, while this tendency is reversed later (figure 23). Similarly to
$U_{\circ }$
values, while this tendency is reversed later (figure 23). Similarly to
 $AR~2$
, this behaviour occurs because the body with a smooth surface rotates (decelerates the body) earlier than that with a rough surface. For the largest
$AR~2$
, this behaviour occurs because the body with a smooth surface rotates (decelerates the body) earlier than that with a rough surface. For the largest
 $AR$
of 8.0, the projectiles sink at constant velocities (within the present measurement region), and that with a rough surface moves slightly faster than that with a smooth surface (figure 23). The acceleration is quite small (almost zero) in both cases (figure 24).
$AR$
of 8.0, the projectiles sink at constant velocities (within the present measurement region), and that with a rough surface moves slightly faster than that with a smooth surface (figure 23). The acceleration is quite small (almost zero) in both cases (figure 24).

Figure 26. Temporal variation of
 $C_{F}$
: (a)
$C_{F}$
: (a)
 $U_{\circ }=2.5~\text{m}~\text{s}^{-1}$
; (b)
$U_{\circ }=2.5~\text{m}~\text{s}^{-1}$
; (b)
 $4.2~\text{m}~\text{s}^{-1}$
. The open and closed symbols correspond to smooth and rough surfaces, respectively. Positive values of
$4.2~\text{m}~\text{s}^{-1}$
. The open and closed symbols correspond to smooth and rough surfaces, respectively. Positive values of
 $C_{F}$
correspond to the upward direction (i.e. drag force on a sinking body).
$C_{F}$
correspond to the upward direction (i.e. drag force on a sinking body).
Based on the vertical acceleration, the force coefficient (
 $C_{F}$
) can be estimated using (5.1) (Mansoor et al.
Reference Mansoor, Vakarelski, Marston, Truscott and Thoroddsen2017):
$C_{F}$
) can be estimated using (5.1) (Mansoor et al.
Reference Mansoor, Vakarelski, Marston, Truscott and Thoroddsen2017):
 $$\begin{eqnarray}C_{F}=\frac{F(t)}{{\textstyle \frac{1}{2}}\unicode[STIX]{x1D70C}Av(t)^{2}}=\frac{ma(t)}{{\textstyle \frac{1}{8}}\unicode[STIX]{x1D70C}\unicode[STIX]{x03C0}D^{2}v(t)^{2}}.\end{eqnarray}$$
Here,
 $m$
is the mass of the projectile. As shown in figure 26, the magnitude and temporal fluctuation of
$m$
is the mass of the projectile. As shown in figure 26, the magnitude and temporal fluctuation of
 $C_{F}$
decrease as
$C_{F}$
decrease as
 $AR$
increases. For
$AR$
increases. For
 $AR~1$
, the body with a rough surface has a smaller
$AR~1$
, the body with a rough surface has a smaller
 $C_{F}$
(i.e. reduced drag) at
$C_{F}$
(i.e. reduced drag) at
 $t^{\ast }\lesssim 14$
and
$t^{\ast }\lesssim 14$
and
 $t^{\ast }\lesssim 17$
at
$t^{\ast }\lesssim 17$
at
 $U_{\circ }=2.5~\text{m}~\text{s}^{-1}$
and
$U_{\circ }=2.5~\text{m}~\text{s}^{-1}$
and
 $4.2~\text{m}~\text{s}^{-1}$
, respectively. After cavity pinch-off,
$4.2~\text{m}~\text{s}^{-1}$
, respectively. After cavity pinch-off,
 $C_{F}$
starts to decrease in both cases and that of the smooth surface shows larger oscillation. At this stage, the body with a smooth surface has a smaller
$C_{F}$
starts to decrease in both cases and that of the smooth surface shows larger oscillation. At this stage, the body with a smooth surface has a smaller
 $C_{F}$
and even has negative values at
$C_{F}$
and even has negative values at
 $22\lesssim t^{\ast }\lesssim 40$
and
$22\lesssim t^{\ast }\lesssim 40$
and
 $25\lesssim t^{\ast }\lesssim 45$
for
$25\lesssim t^{\ast }\lesssim 45$
for
 $U_{\circ }=2.5~\text{m}~\text{s}^{-1}$
and
$U_{\circ }=2.5~\text{m}~\text{s}^{-1}$
and
 $4.2~\text{m}~\text{s}^{-1}$
, respectively. The same trend of
$4.2~\text{m}~\text{s}^{-1}$
, respectively. The same trend of
 $C_{F}$
for an underwater sinking body was previously reported by Truscott et al. (Reference Truscott, Epps and Techet2012). As mentioned earlier, the projectile is locally accelerated by the shed vortices in the wake. After this unstable stage,
$C_{F}$
for an underwater sinking body was previously reported by Truscott et al. (Reference Truscott, Epps and Techet2012). As mentioned earlier, the projectile is locally accelerated by the shed vortices in the wake. After this unstable stage,
 $C_{F}$
increases and approaches zero as terminal velocity is reached. For a rough sphere, this wake-induced instability is delayed (or reduced) due to the cavity and thus
$C_{F}$
increases and approaches zero as terminal velocity is reached. For a rough sphere, this wake-induced instability is delayed (or reduced) due to the cavity and thus
 $C_{F}$
saturates faster than it does for a smooth sphere. When
$C_{F}$
saturates faster than it does for a smooth sphere. When
 $AR=2.0$
, the rough body has a slightly larger (or similar)
$AR=2.0$
, the rough body has a slightly larger (or similar)
 $C_{F}$
than the smooth one due to the increased pressure drag caused by the air bubbles attached to the body after pinch-off. For
$C_{F}$
than the smooth one due to the increased pressure drag caused by the air bubbles attached to the body after pinch-off. For
 $AR~4$
, the delayed rotation of a body with a rough surface results in a smaller
$AR~4$
, the delayed rotation of a body with a rough surface results in a smaller
 $C_{F}$
. Lastly, for
$C_{F}$
. Lastly, for
 $AR~8$
, both the smooth and rough bodies exhibit
$AR~8$
, both the smooth and rough bodies exhibit
 $C_{F}$
values of almost zero. With the present set-up, it is not possible to distinguish differences in the sinking dynamics of projectiles with higher
$C_{F}$
values of almost zero. With the present set-up, it is not possible to distinguish differences in the sinking dynamics of projectiles with higher
 $AR$
(
$AR$
(
 ${\gtrsim}8.0$
), but it would be interesting to work with a larger water tank to investigate these features further.
${\gtrsim}8.0$
), but it would be interesting to work with a larger water tank to investigate these features further.
6 Concluding remarks
In the present study, we experimentally investigated the formation and evolution of jets, splashes and underwater cavities following the water entry of rounded cylindrical bodies while varying aspect ratio as well as the surface conditions and impact speeds of the bodies. The surface condition of the front part governs the global picture of the subsequent phenomena. When it is smooth, the water layer displaced from the projectile rises along the surface of the projectile without separation. Depending on the aspect ratio, the water film may converge at the rear pole to create a jet or simply moves up and down the surface of the falling body. In addition to the apex jet (which we call a thin jet), the stagnation pressure right below the free surface due to the wake behind a body causes the rise of another jet, a thick jet. It was also found that the balance between the viscous force and surface tension determines the conditions under which jet-tip breakdown occurs. On the other hand, the impact speed (within the considered range) does not influence the jet dynamics significantly.
When the front part of a projectile is rough, the water film rise cannot be retained for long and early separation occurs. This behaviour produces a splash and cavity above and below the free surface, respectively. Due to the imbalance of the surrounding forces, the splash shrinks into a dome and cavity pinch-off occurs, but the projectile strongly interferes with this process as aspect ratio increases. The effect of an underwater cavity on the hydrodynamic force on a sinking body shows quite interesting dependencies on the body aspect ratio and impact speed. If the aspect ratio is small and the inertia is sufficiently strong, then a stably formed (i.e. axisymmetric) cavity fully covers the body, forming a boundary between the solid body and surrounding water. In this case, the cavity reduces the drag force on the body. However, if the cavity is unstable due to the reduced inertia or the cavity bubbles partially attach to the body surface after pinch-off, the drag force increases. The drag reduction on the well-defined outer profile of an underwater cavity was recently addressed by Vakarelski et al. (Reference Vakarelski, Klaseboer, Jetly, Mansoor, Aguirre-Pablo, Chan and Thoroddsen2017).
While we focused on the time immediately after impact, e.g. from jet (splash) formation to cavity pinch-off, the wake-induced path instability of a sinking body was also briefly introduced. Furthermore, we demonstrated that this instability is delayed due to cavity formation, which eventually affects the dynamics of a sinking body. It would be interesting to focus on the time ranges when this wake instability starts to appear and to investigate the influence of a cavity. In addition, the detailed mechanism of (or conditions necessary for) early separation of a water film from an impacting body with a rough surface remains to be uncovered. We are currently working on these issues to further our understanding of the water entry problem.
Acknowledgements
This work was supported by a grant (KCG-01-2017-02) through the Disaster and Safety Management Institute and grants (2016R1C1B2012775, 2017R1A4A1015523, 2017M2A8A4018482) through the National Research Foundation (NRF) of Korea, funded by the Korean government (KCG and MSIP, respectively) via SNU-IAMD.
Supplementary movies
Supplementary movies are available at https://doi.org/10.1017/jfm.2018.1026.


