


1. Introduction
Many studies have been carried out for the wake of a bluff body, such as a circular cylinder, a rectangular cylinder, a sphere and so on (Nakaguchi, Hashimoto & Muto Reference Nakaguchi, Hashimoto and Muto1968; Berger, Scholz & Schumm Reference Berger, Scholz and Schumm1990). Flow around a circular cylinder has been studied under a variety of conditions or configurations (Prosser & Smith Reference Prosser and Smith2016; Nagata et al. Reference Nagata, Noguchi, Kusama, Nonomura, Komuro, Ando and Asai2020). One reason for this is that a finite circular cylinder or similar geometries are often found in the industrial field. Applications of a finite circular cylinder include skyscrapers and other buildings, engine canisters (Cicolani et al. Reference Cicolani, Lusardi, Greaves, Robinson, Rosen and Raz2010; Prosser & Smith Reference Prosser and Smith2016), re-entry capsules (Ohmichi, Kobayashi & Kanazaki Reference Ohmichi, Kobayashi and Kanazaki2019), aircraft gears, oil tanks and other transport-related items, as well as fuel rods for nuclear power generation (Iiyama et al. Reference Iiyama, Furuya, Arai, Ui, Okawa, Shirakawa and Shimada2022). The flows they generate are all deeply relevant not only to their own safety and stability but also to their impact on the surrounding environment or structures. However, the understanding of a free-stream-aligned circular cylinder that has an arrangement in which the direction of the free stream and the cylinder axis are parallel is not sufficiently comprehensive. Furthermore, there are few studies on the more practical case, where the cylinder axis has an angle to the free stream. The wake of a circular cylinder when the cylinder axis is parallel or inclined to the free stream has been investigated both numerically (Fabre, Auguste & Magnaudet Reference Fabre, Auguste and Magnaudet2008; Meliga, Chomaz & Sipp Reference Meliga, Chomaz and Sipp2009; Yang et al. Reference Yang, Liu, Wu, Zhong and Zhang2014, Reference Yang, Liu, Wu, Liu and Zhang2015; Prosser Reference Prosser2015; Prosser & Smith Reference Prosser and Smith2016; Tian et al. Reference Tian, Ong, Yang and Myrhaug2016, Reference Tian, Hu, Lu and Yang2017; Gao et al. Reference Gao, Tao, Tian and Yang2018; Chongsiripinyo & Sarkar Reference Chongsiripinyo and Sarkar2020; Nidhan et al. Reference Nidhan, Chongsiripinyo, Schmidt and Sarkar2020; Nekkanti et al. Reference Nekkanti, Nidhan, Schmidt and Sarkar2023) and experimentally (Calvert Reference Calvert1967; Higuchi et al. Reference Higuchi, Van Langen, Sawada and Tinney2006; Johansson & George Reference Johansson and George2006a,Reference Johansson and Georgeb; Higuchi, Sawada & Kato Reference Higuchi, Sawada and Kato2008; Bobinski, Goujon-Durand & Wesfreid Reference Bobinski, Goujon-Durand and Wesfreid2014; Nonomura et al. Reference Nonomura, Sato, Fukata, Nagaike, Okuizumi, Konishi, Asai and Sawada2018; Shinji et al. Reference Shinji, Nagaike, Nonomura, Asai, Okuizumi, Konishi and Sawada2020; Kuwata et al. Reference Kuwata, Abe, Yokota, Nonomura, Sawada, Yakeno, Asai and Obayashi2021; Yokota et al. Reference Yokota, Ochiai, Ozawa, Nonomura and Asai2021; Satheesh et al. Reference Satheesh, Spohn, Kerhervé and Cordier2022; Yokota, Asai & Nonomura Reference Yokota, Asai and Nonomura2022, Reference Yokota, Asai and Nonomura2023; Yokota & Nonomura Reference Yokota and Nonomura2024; Yokota et al. Reference Yokota, Nagata, Kasai, Oka and Nonomura2024). The behaviour of the shear layer formed by flow separation at the leading edge is known to vary with a fineness ratio  $L/D$ (
 $L$: length,
  $D$: diameter) and angle of attack
  $\alpha$.
The flow field around a circular cylinder can be divided into two main categories depending on  $L/D$ when the angle between the free stream and the cylinder axis (angle of attack
  $\alpha$) is 0
 $^\circ$. The shear layer does not reattach to the curved surface of the cylinder when
  $L/D<1.5$, and reattachment occurs when
  $L/D\ge 1.5$. It is classified based on the time-averaged velocity field in the plane through the cylinder axis (Yokota et al. Reference Yokota, Ochiai, Ozawa, Nonomura and Asai2021) and is referred to as a non-reattaching flow and a reattaching flow, respectively. Here, the shear layer reattachment is considered to intermittently appear in the case of
  $L/D\approx 1.5$. The time-averaged drag coefficient is significantly changed by this reattachment of the flow. The drag coefficient decreases gradually with increasing
  $L/D$ for
  $L/D\leq 1.0$, but decreases sharply for
  $1.0\leq L/D\leq 1.5$. Subsequently, it gradually increases with increasing
  $L/D$ for
  $L/D>1.5$ due to viscous drag in the turbulent boundary layer formed on the surface downstream of the reattachment point (Higuchi et al. Reference Higuchi, Sawada and Kato2008). Furthermore, with regard to flow fluctuations, recirculation bubble pumping (
 $St<0.05$) and large-scale vortex shedding (
 $St\approx 0.13$) are more apparent in the case of non-reattaching flow than in the case of reattaching flow, and are associated with aerodynamic force fluctuations in the axial and lateral directions of the cylinder, respectively (Yokota et al. Reference Yokota, Ochiai, Ozawa, Nonomura and Asai2021, Reference Yokota, Nagata, Kasai, Oka and Nonomura2024). Here, the Strouhal number is the dimensionless frequency calculated as
  $St=fD/U$ (
 $\,f$: frequency). Characteristic structures such as an azimuthal shear mode, streaks and double-helix structures have been reported that appear in the wake of the cylinder, although they are considered to be not linked to aerodynamic fluctuations (Yokota & Nonomura Reference Yokota and Nonomura2024). These five characteristic structures are observed not only in the wake of a free-stream-aligned circular cylinder but also in the wake of an axisymmetric bluff body with an elliptical nose in front (Rigas et al. Reference Rigas, Oxlade, Morgans and Morrison2014, Reference Rigas, Morgans, Brackston and Morrison2015; Pavia et al. Reference Pavia, Varney, Passmore and Almond2019; Zhang & Peet Reference Zhang and Peet2023).
The flow fields at  $\alpha \neq 0^\circ$ can be classified into three main types: non-reattaching flow, where the separated shear layer does not reattach to the curved surface; reattaching flow, where it does reattach; and fully attached flow, where no separation is observed. Prosser (Reference Prosser2015) made a classification for flow fields on the curved surface in the range
  $0\leq \alpha \leq 90^\circ$, based on forces and moments calculated from the pressure distribution on the surface. Three different types are observed on the surface for
  $L/D=1.0$, with a clear transition from non-reattaching to reattaching flow at
  $\alpha =10^\circ$ and from reattaching to fully attached flow at 45
 $^\circ$ (figure 1). On the other hand, for
  $L/D=2.0$, only the transition from reattaching flow to fully attached flow at
  $\alpha =10^\circ$ was observed because the reattaching flow was observed at
  $\alpha =0^\circ$, as mentioned above. However,
  $\alpha$ was not set in detail for the vicinity of the transition angle in his study (Prosser Reference Prosser2015). Yokota et al. (Reference Yokota, Asai and Nonomura2023) set
  $\alpha$ in the range up to 15
 $^\circ$ and investigated the transition
  $\alpha$ from the non-reattaching flow to reattaching flow for a circular cylinder with
  $L/D=1.0$ in detail, and visualised the flow field near the curved surface in 1
 $^\circ$ increments of
  $\alpha$ around 10
 $^\circ$ using the two-dimensional two-component particle image velocimetry (PIV). The time-averaged velocity field revealed that reattachment of the flow separated at the leading edge occurs at
  $8\leq \alpha \leq 9^\circ$. The study also showed that the tendency of the time-averaged drag, lift and pitching moment coefficient curves with respect to
  $\alpha$ differs between the cases of the non-reattaching and reattaching flows. In particular, the lift curves show interesting trends. The lift curve exhibits a linear change with a negative gradient in the
  $\alpha$ range of the non-reattaching flow, while it shows a nonlinear change in the reattaching flow. The lift force decreases in the range of
  $9\leq \alpha \leq 11^\circ$, although the change gradually moderates and reaches a minimum value at
  $\alpha =12^\circ$. Intermittent flow reattachment is considered to occur in the range where the lift decreases after the transition to the reattaching flow, and increasing the angle of attack is considered to increase the time for the formation of a separation bubble due to the reattachment, resulting in a decrease in the time-averaged lift coefficient. Steady reattachment is considered to occur at
  $\alpha \ge 12^\circ$, and the negative pressure due to the separation bubble on the curved surface becomes weaker, while at the same time, the pressure recovery due to the flow reattachment turns the gradient positive and the negative lift force becomes smaller (Yokota et al. Reference Yokota, Asai and Nonomura2023).

Figure 1. Schematic of the flow field around a circular cylinder with the angle of attack.
Differences due to the transition of the flow field were observed not only in the time-averaged aerodynamic coefficient but also in the aerodynamic force fluctuations acting in the lateral direction of the cylinder. Yokota et al. (Reference Yokota, Asai and Nonomura2023) showed the power spectral density (PSD) of lift force fluctuations for every 1 $^\circ$ up to
  $\alpha =15^\circ$, and the peak at
  $St\approx 0.125$ observed in the case of the non-reattaching flow is not observed in the case of the reattaching flow. The pressure fluctuations resulting from the large-scale vortex shedding appearing in the wake are considered to be no longer generated or reduced on the curved surface in the case of reattaching flow. However, their report does not clarify whether the large-scale vortex shedding occurs when the reattaching flow is formed, and there are no reports on that in numerical investigations.
The wake of the cylinder with an angle of attack has been investigated for discs with  $L/D=0$ or close to zero (Calvert Reference Calvert1967; Tian et al. Reference Tian, Hu, Lu and Yang2017; Gao et al. Reference Gao, Tao, Tian and Yang2018; Satheesh et al. Reference Satheesh, Spohn, Kerhervé and Cordier2022). Gao et al. (Reference Gao, Tao, Tian and Yang2018) investigated the wake of a disc with
  $L/D=0.02$ for Reynolds numbers between 50 and 300, defined by
  $Re=UD\cos \alpha /\nu$, and
  $\alpha \leq 80^\circ$. They classified the wake in this range into five states: steady state (SS), periodic state (PS), periodic state with a low-frequency modulation (PSL), quasiperiodic (QP) state and chaotic state (CS). One of the most interesting characteristics was shown by CS. Although the aerodynamic forces acting in the lateral direction of the disc appear in only one direction in all states except CS, a helical pattern of vortex shedding position similar to that of a free-stream-aligned circular cylinder (Yokota & Nonomura Reference Yokota and Nonomura2024; Yokota et al. Reference Yokota, Nagata, Kasai, Oka and Nonomura2024) is observed for
  $\alpha =0^\circ$ in CS. The range of the azimuthal position of the vortex shedding gradually narrows as
  $\alpha$ increases, and it is almost fixed at
  $\alpha =30^\circ$ and
  $Re=300$ (Gao et al. Reference Gao, Tao, Tian and Yang2018). Since it is known that the flow field around a free-stream-aligned circular cylinder is similar to that of a disc in the case of a non-reattaching flow (Kuwata et al. Reference Kuwata, Abe, Yokota, Nonomura, Sawada, Yakeno, Asai and Obayashi2021; Yokota et al. Reference Yokota, Ochiai, Ozawa, Nonomura and Asai2021), a tendency in the vortex shedding position versus
  $\alpha$, which is similar to that of CS, is expected for a cylinder with
  $L/D=1.0$ for
  $\alpha \leq 8^\circ$. However, the investigation by Gao et al. (Reference Gao, Tao, Tian and Yang2018) is limited to low Reynolds numbers and vortex shedding positions are not mentioned in the results of PIV measurements of the disc wake at
  $Re_D=10^4 (=UD/\nu )$ order made by Satheesh et al. (Reference Satheesh, Spohn, Kerhervé and Cordier2022). Furthermore, the wake is considered to show more complex behaviour because reattachment is observed only on some parts of the curved surface of the cylinder at
  $9\leq \alpha \leq 15^\circ$, where the reattachment flow is observed.
A fixed circular cylinder with  $\alpha$ has been mainly investigated by numerical studies (Prosser Reference Prosser2015; Prosser & Smith Reference Prosser and Smith2016). This is because stings and struts used as support for the model interfere with the wake or separated shear layer in experimental investigations (Calvert Reference Calvert1967; Satheesh et al. Reference Satheesh, Spohn, Kerhervé and Cordier2022; Tashiro et al. Reference Tashiro, Yokota, Asai and Nonomura2023), which prevents understanding of the phenomenon, especially in the case of an angled cylinder with a strong three-dimensionality of flow. Therefore, Yokota et al. (Reference Yokota, Asai and Nonomura2023) applied a magnetic suspension and balance system (MSBS) to wind tunnel tests and investigated under conditions free from support interference. However, their measurement plane parallel to the free stream through the cylinder axis did not allow the calculation of the wake position. Hence, a velocity field measurement in a plane perpendicular to the free stream would be desirable. Yokota & Nonomura (Reference Yokota and Nonomura2024) have investigated the wake behind a free-stream-aligned circular cylinder by applying stereo-PIV measurements to wind tunnel tests using an MSBS. The experimental system is considered to be a powerful tool towards the comprehension of the flow field around an angled cylinder.
The objective of the present study is to clarify the change in the flow field with respect to the angle of attack, focusing on the transition from the non-reattaching to reattaching flow in the order of  $Re_D=10^4$. The stereo-PIV measurement system used in the investigation of the flow field around a free-stream-aligned circular cylinder (Yokota & Nonomura Reference Yokota and Nonomura2024) was also applied to the present study, and wind tunnel tests were conducted in a supportless condition. This paper presents the basic statistics of the velocity field and then proceeds with a discussion of the fluctuations in the flow field, mainly using spectral proper orthogonal decomposition (SPOD) (Towne, Schmidt & Colonius Reference Towne, Schmidt and Colonius2018). The presence or absence of the large-scale vortex shedding in the reattaching flow, the dependence of the wake position on the angle of attack, the characteristic modes of the wake and the relationship between the phenomena, which could not be clarified in previous studies, will be clarified.
2. Experimental apparatus
2.1. Model
A circular cylinder with  $L/D=1.0$ was used in the present study, where a transition from a non-reattaching flow to a reattaching flow is observed. The structure of the model is the same as that used in Yokota et al. (Reference Yokota, Nagata, Kasai, Oka and Nonomura2024), and the reader should refer to this paper. The model diameter was 50 mm and the blockage ratio in wind tunnel tests was 2.9 % at
  $\alpha =15^\circ$. The models were machined from white polyoxymethylene and a 10 mm wide black band was painted at the
  $L/2$ position on the curved surface. An aluminium disc with a thickness of 2 mm was attached to the base of the model. Light reflection on the model was suppressed as much as possible by mounting a black-painted aluminium disc during stereo-PIV measurements. Two neodymium magnets with an outer diameter of 40 mm, an inner diameter of 5 mm and a length of 20 mm were inserted inside the model.
The coordinate system in the present study, shown in figure 2, is the same as that used in a previous study (Yokota et al. Reference Yokota, Asai and Nonomura2023). The origin is at the centre of the base when  $\alpha =0^\circ$. The
  $x$ axis is defined in the free-stream direction, the
  $z$ axis in the vertical upward direction and the
  $y$ axis so as to form a right-hand coordinate system. The pitch angle
  $\theta$, yaw angle
  $\psi$ and roll angle
  $\phi$ are defined around the
  $y$,
$y$,  $z$ and
  $x$ axes, respectively. The angle of attack is varied by changing the angle of the cylinder axis in the
  $\theta$ direction. In the present study,
  $\alpha$ was set in 5
 $^\circ$ increments in the range of
  $0^\circ- 15^\circ$ with the aim of investigating the flow field in the case without shear layer reattachment (
 $\alpha =0^\circ$ and 5
 $^\circ$), intermittent shear layer reattachment (
 $\alpha =10^\circ$) and steady shear layer reattachment (
 $\alpha =15^\circ$). Here,
  $\alpha$ (=
 $\theta$) is the angle in the
  $xz$ plane where the positive part on the
  $x$ axis is 0
 $^\circ$, and the clockwise direction is positive in the view from the negative
  $y$ side.

Figure 2. The coordinate system based on the cylinder at  $\alpha =0^\circ$.
2.2. Wind tunnel
The present study used Tohoku University–Basic Aerodynamics Research Tunnel (T-BART) for the wind tunnel tests. This wind tunnel is a suction-type wind tunnel and, as in previous studies (Yokota & Nonomura Reference Yokota and Nonomura2024; Yokota et al. Reference Yokota, Nagata, Kasai, Oka and Nonomura2024), a closed test section with a cross-section of  $296\ {\rm mm} \times 300\ {\rm mm}$ was applied. The free-stream velocity
  $U$ can be set in the range 5–60 m s
 $^{-1}$ and it was set to 10.5 m s
 $^{-1}$ for the stereo-PIV measurements in the present study. The Reynolds numbers defined by
  $Re_D=UD/\nu$ were
  $3.46\times 10^4$. The turbulence intensity of the free stream is less than 0.5 % for the velocity, which was confirmed in the previous studies (Yokota & Nonomura Reference Yokota and Nonomura2024).
2.3. Magnetic suspension and balance system
The 0.3-m MSBS at Tohoku University was used as support for the cylindrical model in the test section. The MSBS consists of a sensor subsystem, a coil subsystem and a control subsystem, and can levitate and support a model by the interaction between the magnets built into the model and the magnetic field generated by the coil subsystem. Five charge-coupled-device (CCD) line sensors, nine blue light-emitting-diode (LED) light sources, shortpass optical filters, plano-convex lenses and half-mirrors make up the sensor system.
The surface of the model is illuminated by the LED light sources and the reflected light is captured by the CCD line sensors. The edges of the model and the boundaries of the black band can be detected from the image because it is bright on the surface of the model in the acquired image and dark outside the edges of the model and on the black band. The relationship between the edge/boundary positions on the image and the position/attitude of the model is obtained in advance by a sensor calibration test, and the deviation between the calculated position/attitude of the model and the target value is obtained. The feedback control system determines the electric current applied to each coil based on this deviation to bring the position and posture of the model closer to the target values. The coil system consists of a total of ten coils, eight of which are located on the sides of the test section and are iron-cored coils, while the remaining two, located in the axial direction of the wind tunnel, are air-cored coils. This sequence of processes was performed with 1250 Hz, and the model was supported at a target position. The frequency of fluctuations due to the large-scale vortex shedding, which is the dominant wake structure, is approximately 27 Hz at  $Re_D=3.46\times 10^4$. This means that the control frequency is sufficiently fast compared with the frequency of the phenomena generating the aerodynamic force fluctuations. Refer to the previous study papers (Yokota et al. Reference Yokota, Ochiai, Ozawa, Nonomura and Asai2021, Reference Yokota, Asai and Nonomura2023) for more information on the 0.3-m MSBS and preparation tests.
Controls for six degrees of freedom (DOF) of position and attitude are possible with the 0.3-m MSBS (Tashiro et al. Reference Tashiro, Yokota, Zigunov, Ozawa, Asai and Nonomura2022, Reference Tashiro, Yokota, Asai and Nonomura2023), but control was carried out for the five DOF except for the roll direction as in the previous study (Yokota et al. Reference Yokota, Asai and Nonomura2023). The amplitude of the rolling was small and did not affect the position and attitude in the other five directions. The cylindrical model was supported in the centre of the test section and the wind tunnel tests were carried out. Yokota et al. (Reference Yokota, Asai and Nonomura2023) reported that the fluctuations in the model position and attitude at  $Re_D=6.7\times 10^4$ and
  $\alpha =15^\circ$ were negligibly small.
2.4. Stereo-PIV measurement
Stereo-PIV measurements were performed in a plane perpendicular to the free stream ( $yz$ plane) to investigate the characteristic wake phenomena and vortex shedding positions. Figure 3 shows a schematic of the optical set-up for the stereo-PIV measurements. The optical system for the measurements consisted of two high-speed cameras (SA-X2, Photron), single-focal-length lenses (Micro-Nikkor 105 mm f/2.8), bandpass optical filters (
 $527 \pm 10$ nm, Edmund Optics), single axis scheimpflug mounts (Dantec Dynamics), Nd:YLF laser (LDY-303PIV, Litron) and mirrors (custom made, SIGMAKOKI). Tracer particles were introduced by particulating dioctyl sebacate with Ruskin nozzles and using a seeding rake. The followability of the tracer particles to the flow was confirmed in the previous study (Yokota et al. Reference Yokota, Asai and Nonomura2022). Details of the stereo-PIV measurement system and a camera calibration test are given in Yokota & Nonomura (Reference Yokota and Nonomura2024).

Figure 3. Optical configuration for the measurements of velocity.
The velocity field measurements were made in the  $yz$ plane at
  $x/D=1.0$ and 2.0 for all
  $\alpha$. These positions correspond to the inside and outside of the recirculation region formed downstream of the base of the cylinder, respectively. The measurement frequency was 400 Hz, and five measurements of 4000 sample points (10 s) and one measurement of 10 000 sample points (25 s) were performed in each case. Here, the number of sample points in the stereo-PIV measurement is expressed by
  $N_{PIV}$ in the following. However, the laser light intensity was not sufficient for 0.3 s immediately after the start of the measurement and was therefore not used for analyses.
3. Analysis
3.1. Velocity field estimation
Instantaneous velocity fields were calculated by the analysis software (Dynamic Studio 6.11 and 7.5, Dantec Dynamics) using a conventional spatial correlation method. This method was developed by Willert & Gharib (Reference Willert and Gharib1991) and is widely used. At first, particle images were imported into the software, and a background image consisting of the minimum luminance value of each pixel was created for each run. The effect of laser reflections on the surface of the model was removed by subtracting the background image from the particle image at each time point. Velocity estimation using a recursive correlation method was adapted to the images after the background subtraction, and the displacement vectors of the particles were obtained. The initial interrogation window for the recursive correlation method was  $32 \times 32$ pixels, and it is finally reduced to
  $8 \times 8$ pixels. The processes described above were applied to the particle images acquired by each camera. A two-dimensional three-component velocity field was then obtained from the two displacement vector fields at each time using the results of the camera calibration. The velocity field obtained by applying error vector processing to this was used as the instantaneous velocity field.
3.2. Analysis using SPOD
The turbulent wake of a cylinder with an angle of attack is considered to be very complex, containing many small-scale vortices and having a strong three-dimensionality. Coherent structures of the phenomena could be extracted by modal decomposition from the complex flow field and the characteristic phenomena were investigated. The present study employed SPOD for analyses of velocity fluctuation fields, and discusses them from the obtained eigenspectra and spatial mode. Furthermore, the flow field was reconstructed using the SPOD modes and the relationships between the phenomena were discussed.
3.2.1. Modal decomposition
The spatial modes and eigenvalues of the SPOD were obtained by performing the following analysis on the velocity fluctuation fields. Here, the velocity fluctuations were non-dimensionalised by the free-stream velocity  $U$. Figure 4 illustrates the processing for forming the array in the SPOD analysis. Since the turbulent wake of the cylinder is statistically stationary in the
  $\alpha$ range of the present study, the velocity fluctuation field
  ${\boldsymbol u}'$ was decomposed in the time direction by the Fourier transform:
 \begin{equation} {\boldsymbol{u}}_j'(x; y, z, t) = \sum_f \hat{\boldsymbol{u}}_{j, f}(x; y, z)\, {\rm e}^{{\rm i}2{\rm \pi} ft} (j = x, y, z). \end{equation}
The analysis length of the fast Fourier transform (FFT)  $N_{fft}$ in the present study was set to 400, which corresponds to one second, and the Fourier coefficients in each block were obtained with a 50 % overlap. A Hanning window was applied to the time series data in each block. The frequency resolution is 1 Hz, which gives the resolution of 0.0048 in Strouhal numbers. The matrices
  $\hat {\boldsymbol{\mathsf{U}}}$ were formed from the obtained Fourier coefficients:
 \begin{equation} \hat{\boldsymbol{\mathsf{U}}}_f = \begin{bmatrix} \hat{\boldsymbol{u}}_{x, f}^{(1)}, & \hat{\boldsymbol{u}}_{x, f}^{(2)}, & \hat{\boldsymbol{u}}_{x, f}^{(3)}, & \cdots & \hat{\boldsymbol{u}}_{x, f}^{(N_{blk})}\\ \hat{\boldsymbol{u}}_{y, f}^{(1)}, & \hat{\boldsymbol{u}}_{y, f}^{(2)}, & \hat{\boldsymbol{u}}_{y, f}^{(3)}, & \cdots & \hat{\boldsymbol{u}}_{y, f}^{(N_{blk})}\\ \hat{\boldsymbol{u}}_{z, f}^{(1)}, & \hat{\boldsymbol{u}}_{z, f}^{(2)}, & \hat{\boldsymbol{u}}_{z, f}^{(3)}, & \cdots & \hat{\boldsymbol{u}}_{z, f}^{(N_{blk})}\\ \end{bmatrix}, \end{equation}
where  $N_{blk}$ is the number of FFT analysis blocks obtained in one run, and is 17 and 47 for 9.7 and 24.7 s data, respectively. The results of the analysis for the convergence of spatial modes with respect to
  $N_{blk}$ are presented in the Appendix. Since a cylinder with a pitch angle to the free stream is symmetric with respect to
  $y=0$, symmetric or antisymmetric modes with
  $y=0$ as the plane of symmetry should appear. Therefore, the matrix
  $\hat {\boldsymbol{\mathsf{U}}}_{f,flip}$ was created in the same way for the velocity field flipped for
  $y=0$. The eigenfunctions and square roots of the eigenvalues of the POD modes at each frequency were then obtained using singular value decomposition:
 \begin{equation} [\hat{\boldsymbol{\mathsf{U}}}_f, \hat{\boldsymbol{\mathsf{U}}}_{f,flip}] = {\boldsymbol{\mathsf{U}}}_{f}{\boldsymbol{\mathsf{S}}}_{f}{\boldsymbol{\mathsf{V}}}_{f}^*. \end{equation}
Here notation  $\circ ^*$ means that the matrix takes its complex conjugate transpose. The results of the SPOD are shown in § 4.2. Although modes are obtained as many as
  $N_{blk}$ in a normal SPOD, double the number of modes are obtained in the present study because
  $\hat {\boldsymbol{\mathsf{U}}}_{f,flip}$ is concatenated. The spatial modes have a symmetric or antisymmetric distribution of velocity fluctuations with respect to
  $y=0$. The present study refers to them as symmetric and antisymmetric modes based on the distribution of velocity fluctuations, satisfying the conditions given in (3.4) and (3.5), respectively:
 $$\begin{gather} {\mathsf{U}}_{j, f}^{(n_{POD})}(x; y, z) = {\mathsf{U}}_{j, f}^{(n_{POD})}(x; -y, z), \end{gather}$$
 $$\begin{gather}{\mathsf{U}}_{j, f}^{(n_{POD})}(x; y, z) ={-}{\mathsf{U}}_{j, f}^{(n_{POD})}(x; -y, z). \end{gather}$$
Figure 4. Schematic of the array forming for SPOD in the present study.
3.2.2. Flow reconstruction using SPOD modes
Nekkanti & Schmidt (Reference Nekkanti and Schmidt2021) proposed reconstructions based on SPOD modes in the frequency and time domain. The velocity fluctuation fields were reconstructed from the SPOD modes by a time-domain method using oblique projection in the present study; see Nekkanti & Schmidt (Reference Nekkanti and Schmidt2021) for more details. First, the matrix  $\tilde {\boldsymbol{\mathsf{U}}}$ was formed:
 \begin{align} \tilde{\boldsymbol{\mathsf{U}}} &=
[\boldsymbol{U}_1^{(1)}, \boldsymbol{U}_1^{(2)}, \ldots, \boldsymbol{U}_1^{(N_{blk})}, \boldsymbol{U}_2^{(1)},
\boldsymbol{U}_2^{(2)}, \ldots, \boldsymbol{U}_2^{(N_{blk})},
\ldots,\boldsymbol{U}_{N_{fft}/2+1}^{(1)},\nonumber\\
&\quad \boldsymbol{U}_{N_{fft}/2+1}^{(2)},
\ldots,
\boldsymbol{U}_{N_{fft}/2+1}^{(N_{blk})}].\end{align}
\begin{align} \tilde{\boldsymbol{\mathsf{U}}} &=
[\boldsymbol{U}_1^{(1)}, \boldsymbol{U}_1^{(2)}, \ldots, \boldsymbol{U}_1^{(N_{blk})}, \boldsymbol{U}_2^{(1)},
\boldsymbol{U}_2^{(2)}, \ldots, \boldsymbol{U}_2^{(N_{blk})},
\ldots,\boldsymbol{U}_{N_{fft}/2+1}^{(1)},\nonumber\\
&\quad \boldsymbol{U}_{N_{fft}/2+1}^{(2)},
\ldots,
\boldsymbol{U}_{N_{fft}/2+1}^{(N_{blk})}].\end{align}
Subsequently, a singular value decomposition is applied to the  $\tilde {\boldsymbol{\mathsf{U}}}$ to obtain the eigenvalue matrix
  $\boldsymbol{\mathsf{\Sigma}}$ and the right singular matrix
  $\boldsymbol{\mathsf{\Psi}}$ as follows:
 \begin{equation} \tilde{\boldsymbol{\mathsf{U}}} = {{\boldsymbol{\mathsf{\Phi}}}}{{\boldsymbol{\mathsf{\Sigma}}}}{{\boldsymbol{\mathsf{\Psi}}}}^*. \end{equation}
Nekkanti & Schmidt (Reference Nekkanti and Schmidt2021) used a truncation with a threshold, but no truncation was used in the present study. Therefore, the reconstructed velocity fluctuation field  $\tilde {\boldsymbol u}'$ is obtained by the following equations:
 \begin{equation} \tilde{\boldsymbol u}' = \tilde{\boldsymbol{\mathsf{U}}}{\boldsymbol{\mathsf{\Psi}}}{\boldsymbol{\mathsf{\Sigma}}}^{{-}1}{\boldsymbol{\mathsf{\Psi}}}^*\tilde{\boldsymbol{\mathsf{U}}}^*{\boldsymbol u}'. \end{equation}
Wake positions are calculated and discussed in § 4.3 using the velocity fluctuation fields reconstructed from the SPOD modes of  $n_{POD}=1\unicode{x2013}4$ at
  $0.01\le St\le 0.5$ for the purpose of reducing the influence of noise.
4. Results and discussions
4.1. Flow properties
Figure 5 shows time-averaged velocity profiles for  $-1\le z/D\le 1.4, x/D=1.0$, 2.0 and
  $y/D=0$ at each
  $\alpha$. Comparison is made with the time-averaged velocity profile obtained by Yokota et al. (Reference Yokota, Ochiai, Ozawa, Nonomura and Asai2021) only for the case of
  $\alpha =0^\circ$ in figure 5(a,b). The
  $z$ component agrees well at
  $z/D\le 0.5$ regardless of
  $x/D$, but it does not agree outside this region, and the trends are different. This is caused by the problem of particle introduction in the free-stream region in the velocity field measurements of the previous study, which led to the occurrence of no-particle regions sometimes. In addition, the acrylic wall used for the test section wall was scratched and unnatural changes were observed in some areas. The trends in the
  $x$ component agree well, but bias errors are observed in the positive velocity direction. Yokota & Nonomura (Reference Yokota and Nonomura2024) considered that a factor for this bias error was related to the size of the particle on the image. The optical set-up for the stereo-PIV measurements in the present study was the same as in the previous study, and the bias error could be attributed to the same factor. However, the error in the present study was about 6.3 % of the free stream for
  $x/D=1.$0 and
  $z/D=0$, which is smaller than in the previous study.

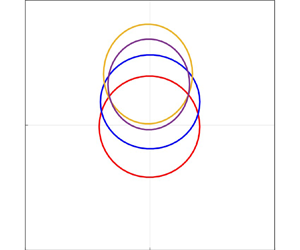
Figure 5. The time-averaged velocity profiles for each component (red:  $x$, blue:
  $y$, yellow:
  $z$) in the case of (a,b)
  $\alpha =0^\circ$, (c,d) 5
 $^\circ$, (e,f) 10
 $^\circ$ and (g,h) 15
 $^\circ$ at (a,c,e,g)
  $x/D=1.0$ and (b,d,f,h) 2.0. The solid lines and the dotted lines represent the results in the present study and the previous study (Yokota et al. Reference Yokota, Ochiai, Ozawa, Nonomura and Asai2021), respectively.
A reverse flow region due to the recirculation region is observed regardless of  $\alpha$ near the centre of the wake at
  $x/D=1.0$. In the following discussion, the positive and negative sides of the
  $z$ axis are referred to as the top and bottom sides, respectively. Figure 5(a,c,e) shows that the position with minimum
  $u_x$ moves in the positive direction of the
  $z$ axis with increasing
  $\alpha$ for the range of 0
 $^\circ$–10
 $^\circ$. A sign switch in
  $u_z$ is observed near the position, indicating that the flow is entrained towards the centre of the wake. The profile also loses symmetry to
  $z/D=0$, especially the weaker reverse flow on the bottom side can be seen at
  $\alpha =10^\circ$. However, the relationship is reversed at
  $\alpha =15^\circ$, where the reverse flow on the bottom side is stronger. Furthermore, the
  $u_z$ profile is also changed, and there is a flow from near the centre of the wake towards the free-stream side. The velocity profile at
  $x/D=2.0$ in figure 5(b,d,f,h), which corresponds to the outside of the recirculation region, shows a similar trend to the case of
  $x/D=1.0$, but the position with minimum
  $u_x$ moves in the positive
  $z$ direction compared with the case of
  $x/D=1.0$. Tian et al. (Reference Tian, Hu, Lu and Yang2017) and Gao et al. (Reference Gao, Tao, Tian and Yang2018) showed that the vortex structures formed in the wake convect away from the
  $x$ axis as
  $x/D$ increases, which is consistent with the results of the present study.
Figure 6 shows the  $z$-direction profile of turbulence statistics. Figure 6(a,c,e,g) shows the turbulent kinetic energy
  $k_{3C}$ and figure 6(b,d,f,h) shows the root-mean-square (RMS) values of velocity fluctuations
  $u_{j,RMS}$ for each component. The calculation is as follows, which is the same as in Yokota & Nonomura (Reference Yokota and Nonomura2024):
 $$\begin{gather} k_{{3C}} = \frac{1}{2}\sum_j(u_{j, {{RMS}}}/U)^2, \end{gather}$$
 $$\begin{gather}u_{j, {{RMS}}} = \sqrt{\frac{1}{N_{PIV}}{\sum_{n=1}^{N_{PIV}}}{u'_{j, n}}^2}. \end{gather}$$
The results of Yokota et al. (Reference Yokota, Ochiai, Ozawa, Nonomura and Asai2021) are plotted in figure 6(b) for comparison, as with the time-averaged velocity.

Figure 6. The profiles of (a,c,e,g) the turbulent kinetic energy  $k_{3C}$ and (b,d,f,h) the RMS of velocity fluctuations
  $u_{j, RMS}$ for each component (red:
  $x$, blue:
  $y$, yellow:
  $z$) in the case of (a,b)
  $\alpha =0^\circ$, (c,d) 5
 $^\circ$, (e,f) 10
 $^\circ$ and (g,h) 15
 $^\circ$. The solid lines and the dotted lines represent the results in the present study and the previous study (Yokota et al. Reference Yokota, Ochiai, Ozawa, Nonomura and Asai2021), respectively.
Figure 6(a) shows that  $k_{3C}$ reaches a maximum around
  $z/D=\pm 0.5$ for
  $\alpha =0^\circ$ and
  $x/D=1.0$. This
  $z$ position is close to the shear layer position as shown in figure 5(a). Large velocity fluctuations associated with the recirculation bubble pumping and the large-scale vortex shedding have been reported near the shear layer in the time-averaged field (Yokota et al. Reference Yokota, Ochiai, Ozawa, Nonomura and Asai2021). This is because the shear layer position fluctuates in the radial direction of the cylinder due to pressure fluctuations caused by the characteristic phenomena, and it experiences high velocities in the free-stream region and low velocity flows inside the recirculation region at that position. The RMS profile of
  $u_x'$ at
  $x/D=1.0$ in figure 6(b) supports this discussion. Moreover, figure 6(a,c,e) shows that the symmetry of the profile at
  $x/D=1.0$ is broken when
  $\alpha$ is increased in the range of
  $0\leq \alpha \leq 10^\circ$, and the position with the maximum
  $k_{3C}$ is on the top side. Furthermore, the maximum
  $k_{3C}$ gradually increases as
  $\alpha$ increases. Within this range of
  $\alpha$, it can be observed that the maximum
  $k_{3C}$ at
  $x/D=2.0$ is near the centre of the wake for a given
  $\alpha$, as shown in figure 6(a,c,e). Similarly, the RMS of the
  $u_y'$ and
  $u_z'$ in figure 6(b,d,f,h) shows an almost constant profile near the wake centre for
  $x/D=1.0$, while they become larger there for
  $x/D=2.0$. In the investigation in the wake of a free-stream-aligned circular cylinder with
  $L/D=1.0$ (Yokota et al. Reference Yokota, Ochiai, Ozawa, Nonomura and Asai2021), the PSD distribution of velocity fluctuations associated with the large-scale vortex shedding showed large
  $u_z'$ at the wake centre in addition to large
  $u_x'$ near the shear layer in the downstream of the recirculation region.
Interesting results at  $\alpha =15^\circ$ are shown as with the time-averaged velocity profiles. Figure 6(g) shows that
  $k_{3C}$ on the top side is smaller, and a comparable magnitude of
  $k_{3C}$ occurs on the bottom side. Yokota & Nonomura (Reference Yokota and Nonomura2024) reported that
  $k_{3C}$ downstream of the cylinder base is generally lower than in the case of non-reattaching flow when the reattachment of the separated shear layer occurs. This was considered to be due to the collapse of the relatively large vortex structure formed before reattachment by impingement on the curved surface and the reduction of the vortex strength by viscous force. A similar trend was observed in the present study for
  $0\leq \alpha \leq 10^\circ$, but the results for
  $\alpha =15^\circ$ show a different trend from this report. On the other hand, the turbulence intensity distribution near the windward curved surface at
  $\alpha =15^\circ$, shown by Yokota et al. (Reference Yokota, Asai and Nonomura2023), decreased downstream from the reattachment point. This result supports the discussions of Yokota & Nonomura (Reference Yokota and Nonomura2024). The strong velocity fluctuations in the bottom side for
  $\alpha =15^\circ$ and
  $x/D=1.0$ are discussed further in § 4.2 with the results of the SPOD analysis.
4.2. Characteristic SPOD modes
The spectra of the field of velocity fluctuation obtained by the SPOD for each  $\alpha$ are shown in figure 7. These spectra were obtained by integrating the eigenspectra of modes
  $n_{POD}=1\unicode{x2013}4$ because the contribution is small for
  $n_{POD}\ge 5$. The red and blue lines in the figure are spectra calculated from the field of velocity fluctuations at
  $x/D=1.0$ and 2.0, respectively. At first, a clear peak is identified from the spectra regardless of
  $\alpha$. The peak frequencies are slightly different for
  $x/D=1.0$ and 2.0, but the peak frequency at
  $x/D=2.0$ is highlighted in the figure with a dashed line. A peak at
  $St=0.129$ is observed in the non-reattaching flow at
  $\alpha =0^\circ$ and 5
 $^\circ$. A peak of velocity fluctuations due to the large-scale vortex shedding at
  $St\approx 0.13$ was observed in the previous study on the wake of a free-stream-aligned circular cylinder (
 $\alpha =0^\circ$) (Yokota & Nonomura Reference Yokota and Nonomura2024), and the peak at
  $St=0.129$, which appears in the
  $\alpha$ range with the non-reattaching flow in the present study, is considered to be the result of this phenomenon. In the case of a reattaching flow at
  $\alpha =10^\circ$ and 15
 $^\circ$, in contrast, a peak appears at
  $St=0.143$. Calvert (Reference Calvert1967) investigated the change in vortex shedding frequency with respect to
  $\alpha$ in a disc wake and reported that the vortex shedding frequency increases with increasing
  $\alpha$. The same trend is observed in the present study, and the fluctuations at
  $St=0.143$ are also considered to correspond to the large-scale vortex shedding. However, differences in the change in the vortex shedding frequency with respect to
  $\alpha$ are observed between the disc wake and the wake of the cylinder with
  $L/D=1.0$. Calvert (Reference Calvert1967) reported that the vortex shedding frequency of the disc wake increases monotonically as
  $\alpha$ increases, whereas the vortex shedding frequency tends to vary stepwise between the non-reattaching and reattaching flows in the present study. The peak frequency of wake position fluctuations differs in the
  $y$ and
  $z$ directions, as will be discussed in § 4.3, suggesting that the frequency of large-scale vortex shedding depends on the direction. The peak frequency in the
  $y$ position varies little with
  $\alpha$, but the difference of it in the
  $z$ position is large for the non-reattaching and reattaching flows. The peak frequencies in the spectra in figure 7 are approximately between the peak frequencies in each direction, which results in a step-like change in the peak frequency. The velocity fluctuations by the large-scale vortex shedding become smaller as
  $\alpha$ increases, which can be observed in figure 7.

Figure 7. Mode-integrated spectra obtained from velocity fluctuations at  $x/D=1.0$ and 2.0 in the case of (a) 0
 $^\circ$, (b) 5
 $^\circ$, (c) 10
 $^\circ$ and (d) 15
 $^\circ$.
Secondly, the low-frequency region of figure 7 shows larger fluctuations at  $x/D=1.0$ than that at
  $x/D=2.0$ regardless of
  $\alpha$. Here,
  $x/D=1.0$ corresponds to the inside of the recirculation region. Although no distinct peaks appear as with one at the vortex shedding frequency, there is a clear difference in the magnitude of the fluctuations inside and outside the recirculation region, and this characteristic change should be focused upon. Yokota & Nonomura (Reference Yokota and Nonomura2024) identified the
  $m=0$ (
 $m$: azimuthal wavenumber) mode of the recirculation bubble pumping, the
  $m=1$ mode similar to the very-low-frequency (VLF) mode and the
  $m=2$ mode of the streak structure in the low-frequency region of
  $St\le 0.05$. The recirculation bubble pumping is a phenomenon in which the recirculation region expands or contracts in the free-stream direction, and the fluctuations are more noticeable for
  $\alpha =0^\circ$ in the case of a non-reattaching flow. The VLF mode, which has an
  $m=1$ structure inside the recirculation region and transitions to an
  $m=2$ structure near the downstream end of the recirculation region, has been identified in the wake of an axisymmetric bluff body (Zhang & Peet Reference Zhang and Peet2023). The recirculation bubble pumping or
  $m=1$ mode, similar to the VLF mode, shows significant fluctuations inside the recirculation region. The fluctuations in the low-frequency region decrease with increasing
  $\alpha$ in the range of
  $\alpha \leq 10^\circ$, while the fluctuations increase at
  $\alpha =15^\circ$.
The discussions of the fluctuations in the low-frequency region and vortex shedding frequency focused on above are continued with the eigenfunctions at  $x/D=2.0$. The modes in the low-frequency region are discussed first.
Figures 8 and 9 show the real part, amplitude and phase of the spatial mode for  $St=0.019, n_{POD}=1$ at each
  $\alpha$, and the odd and even rows show the
  $u_x'$ and
  $u_z'$, respectively. The figure shows that the modes are symmetric with respect to
  $y=0$ at any
  $\alpha$. Large
  $u_x'$ is observed inside the recirculation region for
  $\alpha =0^\circ$ and 5
 $^\circ$ in figure 8(a,g), with almost axisymmetric fluctuations with respect to the wake centre. Yokota & Nonomura (Reference Yokota and Nonomura2024) showed a similar distribution in the first POD mode with
  $m=0$ in the wake of a cylinder with
  $L/D=1.0$ and
  $\alpha =0^\circ$. They also identified large fluctuations at
  $St\approx 0.024$ in the PSD of mode coefficients and considered that these were caused by the recirculation bubble pumping. Therefore, the large fluctuations in the low-frequency region observed in figure 7 are considered to be related to the recirculation bubble pumping. The recirculation region is shorter/longer in the free-stream direction compared with the mean field when
  $u_x'$ is positive/negative (Yokota et al. Reference Yokota, Ochiai, Ozawa, Nonomura and Asai2021; Yokota & Nonomura Reference Yokota and Nonomura2024).

Figure 8. (a,d,g,j) The real part, (b,e,h,k) amplitude and (c,f,i,l) phase of eigenfunctions of (a–c,g–i)  $u_x$ and (b–f,j–l)
  $u_z$ fluctuations at
  $St=0.019$ for
  $x/D=2.0$ in the case of (a–f) 0
 $^\circ$ and (g–l) 5
 $^\circ$. The white masking is applied at the position where the mode amplitude is less than 0.005 and satisfies
  $\sqrt {(y/D)^2+(z/D)^2}>1$.

Figure 9. (a,d,g,j) The real part, (b,e,h,k) amplitude and (c,f,i,l) phase of eigenfunctions of (a–c,g–i)  $u_x$ and (b–f,j–l)
  $u_z$ fluctuations at
  $St=0.019$ for
  $x/D=2.0$ in the case of (a–f) 10
 $^\circ$ and (g–l) 15
 $^\circ$. The white masking is applied at the position where the mode amplitude is less than 0.005 and satisfies
  $\sqrt {(y/D)^2+(z/D)^2}>1$.
A similar structure can be observed for  $\alpha =10^\circ$ as shown in figure 9(a), but the phase difference between the fluctuations at the top and bottom sides is larger, which suggests that the timing of expansion and contraction of the recirculation region at the top and bottom sides is different. In addition, the spatial pattern of
  $u_x'$ on the top side does not take a maximum at
  $y=0$ for
  $\alpha =15^\circ$. Moreover,
  $u_z'$ comparable to
  $u_x'$ is found between the top and bottom sides with the recirculation region scaling, which is apparent in figure 9(d,j). The strong fluctuations appearing at
  $y/D=\pm 1.0$ are ignored in the discussion because they are caused by the error vectors due to the reflected laser light on the model during the stereo-PIV measurements. Although similar
  $u_z'$ is also found for
  $\alpha =5^\circ$, the magnitude of the fluctuations is smaller relative to
  $u_x'$ for
  $\alpha =10^\circ$ and 15
 $^\circ$. This
  $u_z'$ is not present for
  $\alpha =0^\circ$. Therefore, this
  $u_z'$ is present at
  $\alpha \neq 0^\circ$ and is considered to be more apparent when a reattaching flow is formed. The cause of the
  $u_z'$ can be explained by the phase difference between the expansion and contraction of the recirculation flow on the top and bottom sides. Figure 10 shows the schematics of the change in the recirculation bubble pumping by
  $\alpha$. Figure 10(a) illustrates the recirculation bubble pumping at
  $\alpha =0^\circ$. Since the recirculation flow on the top and bottom side contracts simultaneously, the equivalent entrainment occurs symmetrically towards the cylinder axis behind the recirculation region. As a result,
  $u_z'$ becomes zero at the downstream end of the recirculation region due to the balance of the flow. On the other hand, in the case of
  $\alpha \neq 0^\circ$, the recirculation flow is asymmetric to the
  $xy$ plane, resulting in a difference in the entrainment strength in the
  $z$ direction, as shown in figure 10(b). From the above reasons,
  $u_z'$ shown in the figures 8(j) and 9(d,j) is considered to appear.

Figure 10. The schematic of the recirculation bubble pumping at (a)  $\alpha =0^\circ$ and (b)
  $\alpha \neq 0^\circ$.
Modes with vortex shedding frequencies are discussed next. Figure 11 shows the spatial modes of each velocity component at  $St=0.129$ and
  $n_{POD}=1\unicode{x2013}4$ for
  $\alpha =0^\circ$. Figure 11(a,b) shows large
  $u_x'$ distributions that are symmetric and antisymmetric with respect to
  $y=0$, respectively. These modes correspond to vortex shedding in the
  $z$ and
  $y$ directions, respectively, and the negative
  $u_x'$ region is considered to correspond to the vortex shedding position. A similar
  $u_x'$ distribution appears in the first POD mode with
  $m=1$ in the investigation of Yokota & Nonomura (Reference Yokota and Nonomura2024). They also reported that the flow appears near the wake centre from the positive
  $u_x'$ region to the negative
  $u_x'$ region and vice versa outside, from the negative
  $u_x'$ region to the positive
  $u_x'$ region. In other words, vortices with positive and negative streamwise vorticity are observed for
  $y>0$ and
  $y<0$, respectively, in the case of the
  $u_x'$ distribution shown in figure 11(a). These vortices are represented by the
  $u_y'$ and
  $u_z'$ distributions in figure 11(h,i) for the symmetric
  $u_x'$ distribution and in figure 11(g,j) for the antisymmetric
  $u_x'$ distribution. The reason why the distribution showing these vortices cannot be represented by a single mode is that the decomposition into symmetric and antisymmetric modes results in a symmetric or antisymmetric distribution of fluctuations in all velocity components for a single mode.

Figure 11. Eigenfunctions of (a–d)  $u_x$, (e–h)
  $u_y$ and (i–l)
  $u_z$ fluctuations of the (a,e,i) first, (b,f,j) second, (c,g,k) third and (d,h,l) fourth modes at
  $St=0.129$ for
  $\alpha =0^\circ$ and
  $x/D=2.0$.
The shape of the mode pattern changes with  $\alpha$ when it is not 0
 $^\circ$, but a structure is basically similar in the
  $\alpha$ range of the present study. Figures 12 and 13 show the symmetric and antisymmetric
  $u_x'$ modes at the vortex shedding frequencies, respectively. The width in the
  $y$ direction of the region with large fluctuations varies with
  $\alpha$. The width is wide on the top side when
  $\alpha >0^\circ$, while the width is narrow on the bottom side. The phase distributions in figure 12(f,i) indicate that spatial pattern shifts in the positive
  $z$ direction in the symmetric mode for
  $\alpha =5^\circ$ and 10
 $^\circ$. Here, a pattern shift occurs in the direction of phase decrease. These are more noticeable for
  $\alpha =10^\circ$. However, the shift is observed only on the top side for
  $\alpha =15^\circ$, i.e. not on the bottom side. Instead of this, a shift to the positive
  $z$ direction is observed on the bottom side of the antisymmetric mode at this
  $\alpha$. Although not shown in the paper, the trend in the spatial patterns of
  $u_y'$ and
  $u_z'$ in figure 11(e–l) is similar to that of
  $u_x'$, where the width in the
  $y$ direction of the region with large fluctuations expands/shrinks at the top/bottom sides as
  $\alpha$ increases.

Figure 12. (a,d,g,j) The real part, (b,e,h,k) amplitude and (c,f,i,l) phase of eigenfunctions of  $u_x$ fluctuations symmetric to
  $y=0$ at the peak frequency for
  $x/D=2.0$ in the case of (a–c) 0
 $^\circ$, (d–f) 5
 $^\circ$, (g–i) 10
 $^\circ$ and (j–l) 15
 $^\circ$. The white masking is applied at the position where the mode amplitude is less than 0.005 and satisfies
  $\sqrt {(y/D)^2+(z/D)^2}>1$.

Figure 13. (a,d,g,j) The real part, (b,e,h,k) amplitude and (c,f,i,l) phase of eigenfunctions of  $u_x$ fluctuations antisymmetric to
  $y=0$ at the peak frequency for
  $x/D=2.0$ in the case of (a–c) 0
 $^\circ$, (d–f) 5
 $^\circ$, (g–i) 10
 $^\circ$ and (j–l) 15
 $^\circ$. The white masking is applied at the position where the mode amplitude is less than 0.005 and satisfies
  $\sqrt {(y/D)^2+(z/D)^2}>1$.
The large  $k_{3C}$ on the bottom side appearing for
  $\alpha =15^\circ$ shown in figure 6(g) is discussed here. This large fluctuation on the bottom side is highly contributed by
  $u_x'$, which is evident from figure 6(h). The distributions of
  $u_x'$ due to the recirculation bubble pumping and the large-scale vortex shedding have been presented in this section. The mode of
  $u_x'$ at the vortex shedding frequency shows comparable magnitudes on the top and bottom sides, which is shown in figure 12(k). Furthermore, the fluctuations at the vortex shedding frequencies decrease monotonically with increasing
  $\alpha$, as shown in figure 7. In contrast, the
  $u_x'$ on
  $y=0$ by the bubble pumping in figure 9(h) is larger on the bottom side and smaller on the top side. The low-frequency fluctuations are larger for 15
 $^\circ$ when comparing
  $\alpha =10^\circ$ and 15
 $^\circ$, which is discussed above. From the above, it is considered that the reason for the large fluctuations on the bottom side for
  $\alpha =15^\circ$ is the low-frequency expansion and contraction of the recirculation region on the bottom side.
4.3. Behaviour of wake position
Investigations on the wake and vortex shedding position in the flow around a bluff body have been carried out for various geometries (Grandemange, Gohlke & Cadot Reference Grandemange, Gohlke and Cadot2013; Rigas et al. Reference Rigas, Oxlade, Morgans and Morrison2014, Reference Rigas, Morgans, Brackston and Morrison2015; Yang et al. Reference Yang, Liu, Wu, Zhong and Zhang2014; Zhang & Peet Reference Zhang and Peet2023; Yokota & Nonomura Reference Yokota and Nonomura2024). Yokota & Nonomura (Reference Yokota and Nonomura2024) investigated the large-scale vortex shedding in the wake of a free-stream-aligned circular cylinder and clarified that vortex shedding patterns can be roughly classified into the following three types: anticlockwise/clockwise circular and flapping patterns. A trend in the distance from the wake centre to the vortex shedding position depending on the vortex shedding pattern was also suggested, and it was found that the distance is stabilised at a certain distance when the vortex shedding exhibits a circular pattern. Furthermore, low-frequency fluctuations in the distance were related to the recirculation bubble pumping. In this section, the change in the vortex shedding position with respect to  $\alpha$ is investigated.
The previous studies (Grandemange et al. Reference Grandemange, Gohlke and Cadot2013; Yang et al. Reference Yang, Liu, Wu, Zhong and Zhang2014; Yokota & Nonomura Reference Yokota and Nonomura2024) assumed the barycentre of momentum deficit calculated from the velocity distribution in the free-stream direction (before Reynolds decomposition) as the wake position. However, as mentioned above, error vectors caused by laser reflections on the model appeared in the present study. Not shown in the paper, the time-averaged velocity field is particularly affected by reflected light. The wake positions calculated by the equations used in previous studies are determined by fluctuations from the time-averaged velocity field, with greater weights for positions with negative velocity fluctuations. Therefore, the positions calculated from the region with negative velocity fluctuations are considered to be available for qualitative discussions. The present study calculates the barycentre of the region with negative velocity fluctuations from the instantaneous velocity fluctuation field reconstructed from the SPOD modes using the following equation and treats this as the wake position:
 $$\begin{gather} y_m(t) = \frac{\displaystyle \int yu'(y, z, t)/U \,{\rm d}S}{\displaystyle \int u'(y, z, t)/U \,{\rm d}S}, \end{gather}$$
 $$\begin{gather}z_m(t) = \frac{\displaystyle \int zu'(y, z, t)/U \,{\rm d}S}{\displaystyle \int u'(y, z, t)/U\, {\rm d}S}, \end{gather}$$
 $$\begin{gather}u'(y, z, t) =
\begin{cases} 0 & \text{if }\widetilde{u'_x}(y, z, t)\ge0,
\\
\widetilde{u'_x}(y, z, t) & \text{if
}\widetilde{u'_x}(y, z, t)<0. \\
\end{cases} \end{gather}$$
$$\begin{gather}u'(y, z, t) =
\begin{cases} 0 & \text{if }\widetilde{u'_x}(y, z, t)\ge0,
\\
\widetilde{u'_x}(y, z, t) & \text{if
}\widetilde{u'_x}(y, z, t)<0. \\
\end{cases} \end{gather}$$
Here the examined area was set as  $-1.2\leq y/D\leq 1.2$ and
  $-1.2\leq z/D\leq 1.4$.
Figure 14 illustrates the wake position for 24.7 s at  $x/D=2.0$ for each
  $\alpha$. Figure 14(c,d) shows that the range of it in the
  $y$ direction is narrower for
  $\alpha =10^\circ$ and 15
 $^\circ$ than for 0
 $^\circ$ and 5
 $^\circ$. Gao et al. (Reference Gao, Tao, Tian and Yang2018) reported that the vortex shedding position appears helical for small
  $\alpha$ when the disc wake is CS, but a flapping pattern appears when
  $\alpha$ is increased. The disc is rotated around the
  $z$ axis in the previous study, and a plot of the aerodynamic force coefficients
  $C_y$ and
  $C_z$ acting on the disc is observed such that the fluctuations of
  $C_z$ become smaller as
  $\alpha$ increases. Since the cylinder was angled around the
  $y$ axis in the present study, the trend of the range of the wake position with
  $\alpha$ is in agreement with the study by Gao et al. (Reference Gao, Tao, Tian and Yang2018).

Figure 14. The wake position at  $x/D=2.0$ in the case of (a) 0
 $^\circ$, (b) 5
 $^\circ$, (c) 10
 $^\circ$ and (d) 15
 $^\circ$.
The ellipses centred on  $\overline {y_m}$ and
  $\overline {z_m}$ are shown in figure 15(a) with the standard deviations of
  $y_m$ and
  $z_m$ as the major and minor axes, respectively, for ease of understanding the change in the wake position with the angle of attack. Figure 15(b) shows those standard deviations and the variation of
  $\overline {z_m}$ with
  $\alpha$. The figure shows that
  $\overline {z_m}$ moves in the positive
  $z$ direction with increasing
  $\alpha$ in the range of
  $\alpha \leq 10^\circ$, which is consistent with the trend of wake position by changing
  $\alpha$ in the previous studies (Tian et al. Reference Tian, Hu, Lu and Yang2017; Gao et al. Reference Gao, Tao, Tian and Yang2018). The
  $\overline {z_m}$ is closer to the origin at
  $\alpha =15^\circ$ than at 10
 $^\circ$. This is considered to be caused by the greater deceleration of the velocity in the
  $x$ direction at the bottom side (figure 5g,h). Nevertheless, the ellipse at
  $\alpha =15^\circ$ is almost encompassed by the ellipse at 10
 $^\circ$, as shown in figure 15(a), which can be explained by the small fluctuations of the wake position due to the large-scale vortex shedding at 15
 $^\circ$. Yokota et al. (Reference Yokota, Ochiai, Ozawa, Nonomura and Asai2021) investigated the wake of a free-stream-aligned circular cylinder and reported that the velocity fluctuations due to the large-scale vortex shedding were smaller for
  $L/D=2.0$ than for
  $L/D=1.5$. Here, the intermittent reattachment and steady reattachment are considered to occur for
  $L/D=1.5$ and 2.0, respectively. An analogous difference between
  $\alpha =10^\circ$ with intermittent reattachment and 15
 $^\circ$ with steady reattachment is considered to appear. The trend of
  $\sigma _{y_m}$ with respect to
  $\alpha$ is also consistent with the above observation that the range of
  $y_m$ is narrower.

Figure 15. (a) The ellipse drawn by  $\overline {y_m}, \overline {z_m}, \sigma _{y_m}$ and
  $\sigma _{z_m}$ at
  $x/D=2.0$ for each
  $\alpha$ and (b) the change of them except with
  $\overline {y_m}$ by
  $\alpha$.
The wake position in the polar coordinate system is then calculated from it in the Cartesian coordinate system by the following equation:
 $$\begin{gather} r_m(t) =\sqrt{(y_m(t)-\overline{y_m})^2+ (z_m(t)-\overline{z_m})^2}, \end{gather}$$
 $$\begin{gather}\theta_m(t) = \arctan \frac{z_m(t)-\overline{z_m}}{y_m(t)- \overline{y_m}}(-{\rm \pi}\le\theta_m\le{\rm \pi}). \end{gather}$$
The polar coordinate system introduced by Gao et al. (Reference Gao, Tao, Tian and Yang2018) was based on the origin in a fixed Cartesian coordinate system, which makes investigation difficult with regard to fluctuations in  $r_m$ and
  $\theta _m$ when the wake centre deviates from the origin for
  $\alpha \neq 0^\circ$. Therefore, the present study adopts a polar coordinate system based on the mean wake position, shown in (4.6) and (4.7). Figure 16 shows the PSD calculated from the positional fluctuations of the wake in each direction
  $y_m, z_m, r_m$ and
  $\theta _m$, respectively. Here, five runs of velocity data for 9.7 s each were used for the calculation. First, clear peaks appear in the
  $y_m$ and
  $z_m$ fluctuations regardless of
  $\alpha$. The peak frequencies of
  $y_m$ and
  $z_m$ coincide at
  $St=0.129$ for
  $\alpha =0^\circ$, and the frequencies also coincide with the mode-integrated spectrum in figure 7. On the other hand, the peak frequencies do not coincide for
  $y_m$ and
  $z_m$ when
  $\alpha \neq 0^\circ$. The fluctuation frequency of
  $z_m$ is higher in all
  $\alpha \neq 0^\circ$ cases, and the difference is more apparent for
  $\alpha =10^\circ$ and 15
 $^\circ$ shown in figure 16(a,b). The
  $y_m$ fluctuation frequency shows almost no change with
  $\alpha$. The fluctuation frequency of
  $z_m$ gradually increases in the range of
  $0\leq \alpha \leq 10$, and its frequency does not change after the reattachment. Gao et al. (Reference Gao, Tao, Tian and Yang2018) reported that the dominant frequency of
  $C_y$ fluctuations (corresponding to aerodynamic force fluctuations in the
  $z$ direction in the present study) increases with increasing
  $\alpha$ in the PS state, which is consistent with the results of the present study. The isosurface of streamwise vorticity showed that the streamwise wavelength of the vortex structure becomes short as
  $\alpha$ increases (Gao et al. Reference Gao, Tao, Tian and Yang2018), which may contribute significantly to the increase of the dominant frequency. The peak frequencies in the mode-integrated spectra in figure 7 are approximately in the middle of the peak frequencies of
  $y_m$ and
  $z_m$ fluctuations. The magnitude of the fluctuations at the peak frequency of
  $y_m$ and
  $z_m$ decreases with increasing
  $\alpha$, consistent with the trend observed in the mode-integrated spectra. In particular, the fluctuations at the peak frequency of
  $z_m$ and
  $St=0.01$ are equivalent at
  $\alpha =15^\circ$.

Figure 16. Power spectral densities of fluctuations of (a)  $y_m/D$, (b)
  $z_m/D$, (c)
  $r_m/D$ and (d)
  $\theta _m/2{\rm \pi}$ at
  $x/D=2.0$.
Fluctuations of  $r_m$ and
  $\theta _m$ are discussed next. Figure 16(d) illustrates that the peak frequency of the
  $\theta _m$ fluctuations is the same as the peak frequency of
  $z_m$ regardless of
  $\alpha$. A peak frequency of
  $r_m$ fluctuations is double that of
  $z_m$ at
  $0\leq \alpha \leq 10^{\circ}$, as shown in figure 16(c). Fluctuations are also large at that frequency for
  $\alpha =15^\circ$, but no peaks are observed. There are three vortex shedding patterns in the wake of a free-stream-aligned circular cylinder, as mentioned earlier. Yokota & Nonomura (Reference Yokota and Nonomura2024) discussed that the positional fluctuations of vortex shedding in the azimuthal direction have a peak at the same frequency as the velocity fluctuation peak regardless of the pattern, while the peak frequency of fluctuation in the radial direction is double the peak frequency of the velocity fluctuation when the pattern exhibits a flapping. Therefore, a flapping pattern of wake position is also observed in the case of a cylinder with
  $\alpha$, but the magnitude of the fluctuations decreases with increasing
  $\alpha$. They become comparable to low-frequency fluctuations at
  $\alpha =15^\circ$, which is the reason why the peak is not observed. The
  $r_m$ fluctuations are dominated by low-frequency fluctuations regardless of
  $\alpha$, which was also observed in the study by Yokota & Nonomura (Reference Yokota and Nonomura2024). However, the
  $r_m$ fluctuations at
  $St\approx 0.02$ are smaller for the case of
  $\alpha =10^\circ$ and 15
 $^\circ$ with the reattaching flow than for the case of
  $\alpha =0^\circ$ and 5
 $^\circ$ with the non-reattaching flow. They found that these low-frequency fluctuations at
  $St\approx 0.02$ were related to the recirculation bubble pumping. Low-frequency fluctuations for
  $\alpha \neq 0^\circ$ are also considered to be related to the recirculation bubble pumping, but it has not been clear whether this relationship appears for
  $\alpha =10^\circ$ and 15
 $^\circ$. This relationship is discussed in § 4.4.
Figure 17 shows the probability distribution of  $r_m$ and
  $\theta _m$ at
  $x/D=2.0$ for 24.7 s at each
  $\alpha$. The
  $r_m$ and
  $\theta _m$ used in the calculation of these probability distributions were obtained using (4.6) and (4.7) after bandpass filtering of
  $y_m$ and
  $z_m$ with
  $0.1\le St\le 0.2$ to focus on the large-scale vortex shedding. Figure 17(a,c,e,g) shows that
  $r_m$ does not have a peak at zero regardless of
  $\alpha$. This indicates that the flow field is quasisteady asymmetric, which is in agreement with the results obtained by Yokota & Nonomura (Reference Yokota and Nonomura2024). This has also been observed in the wake of an axisymmetric bluff body (Rigas et al. Reference Rigas, Oxlade, Morgans and Morrison2014, Reference Rigas, Morgans, Brackston and Morrison2015). The
  $r_m$ where the probability distribution is maximum becomes small with increasing
  $\alpha$, which is considered to correspond to a narrower wake width. In contrast, figure 17(b,d,h) shows that the probability distribution for
  $\theta _m$ is almost uniform for
  $\alpha =0^\circ$, 5
 $^\circ$ and 15
 $^\circ$, which implies that there is no bias in the wake position. The number of bins is 40 and the probability in each bin for a uniform distribution is 0.025. The red broken line at this value is overlaid on the probability distribution. On the other hand, the results for
  $\alpha =10^\circ$ shown in figure 17(f) represent that the probability increases around
  $\pm {\rm \pi}/2$. It was expected that vortex shedding would show a flapping pattern for large
  $\alpha$ as reported by Gao et al. (Reference Gao, Tao, Tian and Yang2018) and that the probability would increase around
  $\pm {\rm \pi}/2$. However, such a trend is observed only in the case of
  $\alpha =10^\circ$ in the present study. Although a reattaching flow is formed for
  $\alpha \ge 10^\circ$, no increase in probability is observed around
  $\pm {\rm \pi}/2$ at
  $\alpha =15^\circ$, suggesting that intermittent flow reattachment causes a bias in the azimuthal position of the wake.

Figure 17. The probability distribution of (a,c,e,g)  $r_m/D$ and (b,d,f,h)
  $\theta _m$ at
  $x/D=2.0$ in the case of (a,b) 0
 $^\circ$, (c,d) 5
 $^\circ$, (e,f) 10
 $^\circ$ and (g,h) 15
 $^\circ$. The mean and standard deviation of
  $r_m/D$ are shown in (a,c,e,g).
Yokota & Nonomura (Reference Yokota and Nonomura2024) further reported that the vortex shedding pattern causes a trend in  $r_m$. Figure 18(a) shows the time history of the wake position at
  $\alpha =15^\circ$ for 24.7 s. The irregular switching of the rotational direction can be observed. Here, the bandpass filtering of
  $0.1\le St\le 0.2$ is applied before the calculation of
  $\theta _m$. Figure 18(b–d) focuses on a short-time variation of
  $\theta _m$. The red highlighted points in figure 18(b,c) show that the azimuthal position varies smoothly with a positive or negative gradient, respectively. The wake positions for this time period are plotted in figure 18(e,f), which show that they are circular with different rotational directions. The angular velocity is close to the vortex shedding frequency while
  $r_m$ remains almost constant in this case. On the other hand, the red points in figure 18(d) show step-like changes with near-zero or very large gradients. The change in wake position in figure 18(g) shows a linear trajectory passing near the
  $\overline {y_m}$ and
  $\overline {z_m}$. These circular and linear trajectories are considered to correspond to the circular and flapping patterns of vortex shedding reported in the previous study (Yokota & Nonomura Reference Yokota and Nonomura2024). The trend of
  $\theta _m$ change for each pattern is also similar. Subsequently, using the above features, an analysis of conditional sampling based on the gradient of
  $\theta _m$, i.e. angular velocity, is carried out as in the previous study. The following conditional equations identify the pattern of vortex shedding:
 $$\begin{gather} \text{state is}
\begin{cases} \text{anticlockwise} & \text{if
}\dfrac{\omega_m}{2{\rm \pi}}\ge0, \\ \text{clockwise} &
\text{if }\dfrac{\omega_m}{2{\rm \pi}}<0, \\
\text{anticlockwise
circular} & \text{if }0.1\le\dfrac{\omega_m}{2{\rm \pi}}\le0.2,
\\ \text{clockwise circular} & \text{if
}-0.2\le\dfrac{\omega_m}{2{\rm \pi}}\le-0.1, \\
\text{flapping} & \text{if }\left|\dfrac{\omega_m}{2{\rm \pi}}\right|<0.1\text{
or } \left|\dfrac{\omega_m}{2{\rm \pi}}\right|>0.2,\\
\end{cases} \end{gather}$$
$$\begin{gather} \text{state is}
\begin{cases} \text{anticlockwise} & \text{if
}\dfrac{\omega_m}{2{\rm \pi}}\ge0, \\ \text{clockwise} &
\text{if }\dfrac{\omega_m}{2{\rm \pi}}<0, \\
\text{anticlockwise
circular} & \text{if }0.1\le\dfrac{\omega_m}{2{\rm \pi}}\le0.2,
\\ \text{clockwise circular} & \text{if
}-0.2\le\dfrac{\omega_m}{2{\rm \pi}}\le-0.1, \\
\text{flapping} & \text{if }\left|\dfrac{\omega_m}{2{\rm \pi}}\right|<0.1\text{
or } \left|\dfrac{\omega_m}{2{\rm \pi}}\right|>0.2,\\
\end{cases} \end{gather}$$
 $$\begin{gather}\omega_m = \frac{{\rm d}\theta_m}{{\rm d}(tU/D)}. \end{gather}$$
No adjustment of the conditional equation was made because the range of the peak frequency variation is small, which is in the range of  $0.1\le St\le 0.2$ for all cases, while the peak frequency varies with
  $\alpha$ and a direction as described earlier. This cutoff frequency is the same as that used in the previous study, and a comparison of the wake position change shown in figure 18(b–d) with the wake azimuthal position change shown in figure 18(e–g) was also made in the present study. The sample points were correctly selected to satisfy the conditions.

Figure 18. The temporal variation of the wake position at  $x/D=2.0$ for (a) the whole measurement time and (b–d) the time of trajectories shown in (e–g), respectively. The red dots correspond to the moment of the trajectories.
Figures 19(a,c,e,g) and 19(b,d,f,h) show the probability distributions obtained by sampling  $r_m$ when the vortex shedding pattern exhibits an anticlockwise circular pattern or a flapping pattern, respectively. Here, the blue histogram is the probability distribution calculated from the data for the whole measurement time (24.7 s) and is presented for comparison with the results of the conditional sampling. Figure 19(a,c,e,g) shows that the probability is high around the
  $r_m$ where the blue histogram has a maximum when it shows an anticlockwise circular pattern. In contrast, the probability is low in that region for the flapping patterns in figure 19(b,d,f,h) and is higher in the other regions. Yokota & Nonomura (Reference Yokota and Nonomura2024) suggested that the vortex shedding position follows a Mexican-hat shaped potential field in the wake of a free-stream-aligned circular cylinder, by combining the results of conditional sampling with the discussions in the study of the wake of an axisymmetric bluff body (Rigas et al. Reference Rigas, Morgans, Brackston and Morrison2015). The fluctuations in the
  $r$ position of vortex shedding are small when the vortex shedding follows a circular pattern and is considered to be stable around the potential well. On the other hand, a flapping pattern is considered to appear when the vortex shedding position moves away from the cylinder axis, allowing it to pass through the potential well and also to cross the potential peaks near the cylinder axis. From the above, the same trends as with the 0
 $^\circ$ case are observed for
  $\alpha \neq 0^\circ$ in the range of the present study, and it can be concluded that flow characteristics specific to vortex shedding patterns appear. The results for the clockwise circular pattern are not shown here but are similar to those for the anticlockwise circular pattern.

Figure 19. The probability distribution of  $r_m/D$ obtained by sampling under the condition that the state of vortex shedding is (a,c,e,g) anticlockwise circular and (b,d,f,h) flapping at
  $x/D=2.0$ in the case of (a,b) 0
 $^\circ$, (c,d) 5
 $^\circ$, (e,f) 10
 $^\circ$ and (g,h) 15
 $^\circ$. The red and blue histograms show the results of the conditional sampling and the whole measurement time, respectively. The mean and standard deviation of the conditional sampling results are shown in each subplot.
4.4. Relationships between recirculation bubble pumping and large-scale vortex shedding
The position in  $r$ of the vortex shedding and the streak strength affect the length of the recirculation region in the wake of a free-stream-aligned circular cylinder (Yokota & Nonomura Reference Yokota and Nonomura2024). The correlation between the recirculation bubble pumping and vortex shedding position was particularly high, showing a coherence of approximately 0.75. Although low-frequency fluctuations of
  $r_m$ are also observed in the present study, it is unclear whether this relationship exists for
  $\alpha =10^\circ$ and 15
 $^\circ$, since the fluctuation energy at
  $St\approx 0.02$ is lower in figure 16(c). Therefore, the coherence and phase difference between the reconstructed velocity fluctuation field and
  $r_m$ were calculated by the following equations, and the relationship of those was investigated:
 $$\begin{gather} {\rm Coh}_{XY}(f) = \frac{|\langle X^*(f)Y(f)\rangle|^2}{\langle X^*(f)X(f)\rangle\langle Y^*(f)Y(f)\rangle}, \end{gather}$$
 $$\begin{gather}\theta_{XY}(f) = \arctan\frac{{\rm Im}({\langle X^*(f)Y(f)\rangle})}{{\rm Re}({\langle X^*(f)Y(f)\rangle})} \times \frac{180}{\rm \pi}. \end{gather}$$
Here  $X$ and
  $Y$ are the frequency spectra of the velocity and
  $r_m$ fluctuations, respectively, and the operator
  $\langle \rangle$ denotes the ensemble average. The FFT analysis length and overlap in this calculation were set to 100 and 50 %, respectively.
Figure 20 shows the coherence and phase difference between the  $\widetilde {u'_x}$ and
  $r_m$ fluctuations in the case with
  $St=0.019$ and
  $x/D=2.0$ for each
  $\alpha$. Figure 20(a) illustrates that the coherence is high near the cylinder axis for
  $\alpha =0^\circ$, with a value of approximately 0.55. Moreover, the phase difference is approximately 50
 $^\circ$ in the high coherence region, shown in figure 20(b). The distributions of coherence and phase difference are axisymmetric and similar to the spatial mode pattern related to the recirculation bubble pumping shown in figure 8(a). This indicates that the recirculation bubble pumping is associated with low-frequency fluctuations in
  $r_m$, which is in agreement with the report by Yokota & Nonomura (Reference Yokota and Nonomura2024). The case of
  $\alpha =5^\circ$ in figure 20(c,d) shows the very similar coherence and phase difference distribution as the 0
 $^\circ$ case, but the region with high coherence shifts a bit towards the positive
  $z$ direction. This is consistent with the change in spatial pattern with
  $\alpha$ shown in figure 8. The coherence decreases for
  $\alpha =10^\circ$ in figure 20(e) and is approximately 0.4. In the case of
  $\alpha =15^\circ$ in figure 20(g), the coherence is much lower, approximately 0.2. Yokota & Nonomura (Reference Yokota and Nonomura2024) discussed that the recirculation region is shorter when the mixing caused by the large-scale vortex shedding is strong, while the recirculation region is longer when the mixing is weak. The
  $r_m$ increases when the fluctuations of the large-scale vortex shedding are large. Figures 7 and 16 show that the fluctuations at the peak frequency become small with increasing
  $\alpha$, especially in the case of the reattaching flow. In other words, mixing becomes weak as
  $\alpha$ increases, and the influence of the
  $r_m$ on the state of the recirculation region is considered to be weaker.

Figure 20. (a,c,e,g) Coherence and (b,d,f,h) phase difference between the reconstructed velocity and  $r_m$ fluctuations at
  $St=0.019$ for
  $x/D=2.0$ in the case of (a,b) 0
 $^\circ$, (c,d) 5
 $^\circ$, (e,f) 10
 $^\circ$ and (g,h) 15
 $^\circ$.
5. Conclusions
The present study has focused on the transition from non-reattaching to reattaching flow of a circular cylinder with an angle of attack and has clarified the change of the large-scale wake structures with respect to the angle of attack. The investigation has been conducted using a cylindrical model at  $L/D=1.0$ and a 0.3-m MSBS with stereo-PIV measurements in wind tunnel tests without support interference. At first, the flow properties of time-averaged velocity, turbulent kinetic energy and RMS of velocity fluctuations have been presented to discuss the changes in the flow field due to
  $\alpha$. Subsequently, the results of the SPOD analysis for the velocity fluctuation fields led to discussions on the changes in the large-scale wake structures and the wake position with
  $\alpha$.
The time-averaged velocity profile in the  $z$ direction at
  $y/D=0$ shows that the position with the minimum
  $u_x$ moves toward the positive
  $z$ direction with increasing
  $\alpha$ for
  $\alpha =0^\circ \unicode{x2013}10^\circ$, and the profile is not symmetric at
  $z/D=0$. In particular, the reverse flow on the bottom side is weaker at
  $\alpha =10^\circ$. On the other hand, the relationship is reversed at
  $\alpha =15^\circ$, and the reverse flow on the bottom side is stronger. The symmetry of the profile of turbulent kinetic energy
  $k_{3C}$ is broken as
  $\alpha$ increases in the range
  $\alpha =0^\circ \unicode{x2013}10^\circ$, and the position with the maximum
  $k_{3C}$ is at the top side for
  $x/D=1.0$. Furthermore, the maximum
  $k_{3C}$ gradually increases with
  $\alpha$. In the case of
  $\alpha =15^\circ, k_{3C}$ on the top side is equivalent to it on the bottom side. The large
  $k_{3C}$ on the bottom side are considered to be due to the low-frequency expansion and contraction of the bottom side recirculation flow, based on the mode-integrated spectrum and the eigenfunction of the velocity fluctuations at
  $St=0.019$.
The mode-integrated spectra showed peaks regardless of  $\alpha$ in the range of the present study. The peak frequencies are different for
  $\alpha =0^\circ$ and 5
 $^\circ$, where flow reattachment is not formed, and for
  $\alpha =10^\circ$ and 15
 $^\circ$, where reattachment is formed, and are
  $St=0.129$ and 0.143 for
  $x/D = 2.0$, respectively. The peak frequency in the non-reattaching flow is in good agreement with the fluctuation frequency of large-scale vortex shedding reported in the previous studies (Yokota et al. Reference Yokota, Ochiai, Ozawa, Nonomura and Asai2021; Yokota & Nonomura Reference Yokota and Nonomura2024). The spectra show that the fluctuations are smaller as
  $\alpha$ increases at these vortex shedding frequencies. Nevertheless, fluctuations at the vortex shedding frequency are dominant for all
  $\alpha$, which suggests that the flow field can be represented by a low-dimensional model even in turbulent wake with a relatively high Reynolds number. The eigenfunctions of velocity fluctuations at the vortex shedding frequency show a similar spatial pattern regardless of
  $\alpha$. However, the width in the
  $y$ direction of the region with large fluctuations varies with
  $\alpha$. The width of the top side is wider as
  $\alpha$ increases, while the width of the bottom side is narrower. In addition, the shift of the spatial pattern in the positive
  $z$ direction appears in the mode symmetric or antisymmetric to
  $y/D=0$ when
  $\alpha \neq 0^\circ$.
Fluctuations in the low-frequency region at  $St\le 0.05$ are also observed and are particularly noticeable at
  $x/D=1.0$, which corresponds to the inside of the recirculation region. The fluctuations in this frequency range decrease with increasing
  $\alpha$ in the range 0
 $^\circ$–10
 $^\circ$, but the fluctuations are larger at
  $\alpha =15^\circ$. The eigenfunctions of velocity fluctuations at
  $St=0.019$ show nearly axisymmetric fluctuations at
  $\alpha =0^\circ$, 5
 $^\circ$, which is characteristic of the recirculation bubble pumping. A similar structure is observed for
  $\alpha =10^\circ$ and 15
 $^\circ$, but the phase difference in fluctuations increases between the top and bottom sides, and the timing of expansion and contraction of the recirculation flow on the top and bottom sides is different. The difference in flow entrainment due to this phase difference in expansion and contraction is considered to cause velocity fluctuations in the
  $z$ direction.
The present study has assumed the barycentre of the region with negative  $\widetilde {u'_x}$ as the wake position and has made discussions. The peaks of PSD calculated from the fluctuations of the wake position in the
  $y$ and
  $z$ directions are observed. The peak frequencies for fluctuations in the
  $y$ and
  $z$ directions coincide for
  $\alpha =0^\circ$, but they do not match for
  $\alpha \neq 0^\circ$, and the peak frequency for fluctuations in the
  $z$ direction is higher. The vortex shedding patterns are mainly classified into anticlockwise and clockwise circular patterns and a flapping pattern, as in the previous study (Yokota & Nonomura Reference Yokota and Nonomura2024). Moreover, trends in
  $r_m$ for the circle and flapping patterns do not vary regardless of
  $\alpha$. The relationship between low-frequency fluctuations in the radial position of wake and bubble pumping reported by Yokota & Nonomura (Reference Yokota and Nonomura2024) is strong at
  $\alpha =0^\circ$ and 5
 $^\circ$, when the non-reattaching flow is formed, and is weaker as
  $\alpha$ increases, especially in the reattaching flow. Therefore, the radial position of the vortex shedding is considered to have less effect on the state of the recirculation region when the flow is reattached.
The findings of the present study can be used for applications that are angled to the flow in operation, such as a re-entry capsule or a container suspended from a helicopter. Yokota et al. (Reference Yokota, Nagata, Kasai, Oka and Nonomura2024) suggested that the magnitude and direction of the aerodynamic force can be predicted from the pressure fluctuation patterns, leading to efficient fluid control, because the circular and flapping patterns also appear in the base pressure fluctuations when  $\alpha =0^\circ$. These patterns were identified at
  $\alpha \le 15^\circ$, and a similar control utilising the characteristics of each pattern is expected to be possible in this
  $\alpha$ range. In addition, the characteristic that fluctuations are concentrated in the plane passing through the azimuthal position where the reattachment occurs could be used when intermittent flow reattachment occurs. The present study has been carried out in the limited range of
  $\alpha$ of 0
 $^\circ$ to 15
 $^\circ$, but the difference between the cylinder axis and the flow direction may be even larger in the actual environment of use of the application. Since Senda et al. (Reference Senda, Sawada, Okuizumi, Konishi and Obayashi2018) have achieved a high angle of attack levitation of a model with wings by an MSBS, and there is a possibility of achieving a high angle of attack levitation of a low
  $L/D$ cylindrical model, future investigations are awaited. If the position of reattachment changes temporally, the wake structure would change accordingly, and the aerodynamic forces acting on the cylinder would also change. Visualisation of the surface flow field by fluorescent oil (Endo et al. Reference Endo, Ambo, Saito, Nonomura, Chen and Asai2022) on the curved surface of the cylinder is effective in this point. Comprehensive investigations similar to the present study and those described above for cylinders with fineness ratios other than
  $L/D=1.0$ are expected to provide guidelines for improving the performance of applications with geometries similar to a finite circular cylinder.
Funding
This work was supported by JSPS KAKENHI (grant numbers JP18H03809, JP21H04586, JP21J20673, JP22KJ0175).
Declaration of interests
The authors report no conflict of interest.
Author contributions
S.Y. conducted the experiment and data analysis and mainly wrote the paper, T.Na. supported the experiment and T.No. supervised the study.
Appendix. Convergence analysis for SPOD modes
The number of  $N_{blk}$ affects the convergence of the mode in analyses with the SPOD. The convergence of the modes was evaluated by the following equation, referring to the previous study by Schmidt & Towne (Reference Schmidt and Towne2019), for the purpose of investigating this effect:
 $$\begin{gather} e_{n_{POD}}^{prev}(N_{blk}) = \frac{1}{N_{fft}/2+1}\sum_f^{N_{fft}/2+1}(1-\max |\boldsymbol{a}^*\boldsymbol{b}|), \end{gather}$$
 $$\begin{gather}\boldsymbol{a} =\boldsymbol{U}_{f}^{(n_{POD})}(N_{blk}), \end{gather}$$
 $$\begin{gather}\boldsymbol{b} =\boldsymbol{U}_{f}^{(n_{POD})}(N_{blk}-1), \end{gather}$$
where  $\boldsymbol{U}_{f}^{(n_{POD})}(N_{blk})$ is the
  $n_{POD}$th spatial mode at frequency
  $f$ obtained when the number of blocks is
  $N_{blk}$. Figure 21 shows the results of the convergence analysis when SPOD is applied to the velocity field obtained at
  $x/D=2.0$ for each
  $\alpha$. The values at
  $N_{blk}=17$ and 47 adopted in the present study are focused on. The
  $e_{n_{POD}}^{prev}$ is less than 0.235 in all
  $\alpha$ cases for
  $N_{blk}=17$, and even smaller for
  $N_{blk}=47$, with a maximum
  $e_{n_{POD}}^{prev}$ of 0.122.

Figure 21. The eigenfunction convergence at  $x/D=2.0$ for (a)
  $\alpha =0^\circ$, (b) 5
 $^\circ$, (c) 10
 $^\circ$ and (d) 15
 $^\circ$.


