1 Introduction
Flow-induced vibration (FIV) of cylindrical structures is of both fundamental and practical significance. Industrial and engineering architectures are often the combinations of multiple cylindrical structures, such as cables of cable-stayed bridges, groups of chimney stacks, tubes in heat exchangers, transmission line bundles, masts, chemical reaction towers, offshore platforms, risers, undersea pipelines, adjacent skyscrapers, etc. Naturally, it is of practical importance to understand the proximity effect on FIV associated with a group of cylindrical structures. There have been a rather large number of investigations on flow around two cylindrical structures, which is the simplest configuration of multiple structures. Please refer to Zhou & Alam (Reference Zhou and Alam2016) for a recent compendium on this topic. Two cylinders can be arranged in tandem, side-by-side or staggered. The interaction between two tandem cylinders is very strong (Hori Reference Hori1959), involving shear layer reattachment, shear layer interference, quasi-periodic vortices, vortex impingement, recirculation, etc. As such, this flow provides an excellent model for understanding the flow physics of further structures. While some structures are fixed, supported and rigid enough, not prone to FIV, others are elastic or flexibly supported and are subjected to FIV.
Most of the previous investigations have been performed on two fixed rigid circular cylinders of identical diameter
 $(d/D=1)$
, focusing on the flow structure (Lin, Yang & Rockwell Reference Lin, Yang and Rockwell2002; Jester & Kallinderis Reference Jester and Kallinderis2003; Zhou & Yiu Reference Zhou and Yiu2006; Carmo, Meneghini & Sherwin Reference Carmo, Meneghini and Sherwin2010), fluid forces (Arie et al.
Reference Arie, Kiya, Moriya and Mori1983; Ljungkrona, Norberg & Sunden Reference Ljungkrona, Norberg and Sunden1991; Alam et al.
Reference Alam, Moriya, Takai and Sakamoto2003; Alam Reference Alam2016), Strouhal numbers (Igarashi Reference Igarashi1981, Reference Igarashi1984; Xu & Zhou Reference Xu and Zhou2004; Alam & Meyer Reference Alam and Meyer2013), etc. The wake of two tandem cylinders is in general classified into three regimes, depending on
$(d/D=1)$
, focusing on the flow structure (Lin, Yang & Rockwell Reference Lin, Yang and Rockwell2002; Jester & Kallinderis Reference Jester and Kallinderis2003; Zhou & Yiu Reference Zhou and Yiu2006; Carmo, Meneghini & Sherwin Reference Carmo, Meneghini and Sherwin2010), fluid forces (Arie et al.
Reference Arie, Kiya, Moriya and Mori1983; Ljungkrona, Norberg & Sunden Reference Ljungkrona, Norberg and Sunden1991; Alam et al.
Reference Alam, Moriya, Takai and Sakamoto2003; Alam Reference Alam2016), Strouhal numbers (Igarashi Reference Igarashi1981, Reference Igarashi1984; Xu & Zhou Reference Xu and Zhou2004; Alam & Meyer Reference Alam and Meyer2013), etc. The wake of two tandem cylinders is in general classified into three regimes, depending on
 $L/d$
(Zdravkovich Reference Zdravkovich1987), where
$L/d$
(Zdravkovich Reference Zdravkovich1987), where
 $L$
is the distance from the upstream cylinder centre to the forward stagnation point of the downstream cylinder. (i) The overshoot flow regime occurs at
$L$
is the distance from the upstream cylinder centre to the forward stagnation point of the downstream cylinder. (i) The overshoot flow regime occurs at
 $L/d=0.5{-}1.0$
, characterized by the overshoot of the free shear layers, separated from the upstream cylinder, over the downstream cylinder. (ii) The reattachment flow regime takes place at
$L/d=0.5{-}1.0$
, characterized by the overshoot of the free shear layers, separated from the upstream cylinder, over the downstream cylinder. (ii) The reattachment flow regime takes place at
 $L/d=1.0{-}3.5$
, where the separated free shear layers reattach on the downstream cylinder. (iii) The co-shedding flow regime refers to the case of
$L/d=1.0{-}3.5$
, where the separated free shear layers reattach on the downstream cylinder. (iii) The co-shedding flow regime refers to the case of
 $L/d>3.5$
, where the separated shear layers roll up alternately, forming vortex streets in the gap between, as well as behind, the cylinders. Alam et al. (Reference Alam, Moriya, Takai and Sakamoto2003) further divided the reattachment regime into alternate reattachment
$L/d>3.5$
, where the separated shear layers roll up alternately, forming vortex streets in the gap between, as well as behind, the cylinders. Alam et al. (Reference Alam, Moriya, Takai and Sakamoto2003) further divided the reattachment regime into alternate reattachment
 $(1.0<L/d\leqslant 2.5)$
and steady reattachment
$(1.0<L/d\leqslant 2.5)$
and steady reattachment
 $(2.5<L/d\leqslant 3.5)$
. The reattachment may occur on the downstream or upstream side of the downstream cylinder, depending on
$(2.5<L/d\leqslant 3.5)$
. The reattachment may occur on the downstream or upstream side of the downstream cylinder, depending on
 $L/d$
(Zhou & Yiu Reference Zhou and Yiu2006) and Reynolds number
$L/d$
(Zhou & Yiu Reference Zhou and Yiu2006) and Reynolds number
 $Re$
(Xu & Zhou Reference Xu and Zhou2004; Zhou et al.
Reference Zhou, Feng, Alam and Bai2009), where
$Re$
(Xu & Zhou Reference Xu and Zhou2004; Zhou et al.
Reference Zhou, Feng, Alam and Bai2009), where
 $Re$
is based on
$Re$
is based on
 $D$
and free-stream velocity
$D$
and free-stream velocity
 $U_{\infty }$
. Alam & Zhou (Reference Alam and Zhou2008) examined the vortex shedding frequency behind two tandem cylinders of different diameter
$U_{\infty }$
. Alam & Zhou (Reference Alam and Zhou2008) examined the vortex shedding frequency behind two tandem cylinders of different diameter
 $(d/D=0.24{-}1.0)$
at a given
$(d/D=0.24{-}1.0)$
at a given
 $L/d~(=5.5)$
. Two distinct vortex frequencies were detected behind the downstream cylinder. One was the same as detected in the gap between the cylinders, and the other was of relatively low frequency, ascribed to vortex shedding from the downstream cylinder.
$L/d~(=5.5)$
. Two distinct vortex frequencies were detected behind the downstream cylinder. One was the same as detected in the gap between the cylinders, and the other was of relatively low frequency, ascribed to vortex shedding from the downstream cylinder.
Bokaian & Geoola (Reference Bokaian and Geoola1984a
) investigated the FIV of a cylinder placed in the wake of an identical upstream cylinder, where the downstream cylinder is spring-mounted and free to vibrate transversely. The mass damping ratio
 $m^{\ast }\unicode[STIX]{x1D701}$
of the system was 0.109, where
$m^{\ast }\unicode[STIX]{x1D701}$
of the system was 0.109, where
 $m^{\ast }$
is the ratio of the cylinder mass to the cylinder-displaced fluid mass, and
$m^{\ast }$
is the ratio of the cylinder mass to the cylinder-displaced fluid mass, and
 $\unicode[STIX]{x1D701}$
is the damping ratio. Depending on
$\unicode[STIX]{x1D701}$
is the damping ratio. Depending on
 $L/d$
, four different dynamic responses were found: galloping only
$L/d$
, four different dynamic responses were found: galloping only
 $(L/d=0.59)$
, vortex excitation (VE) only
$(L/d=0.59)$
, vortex excitation (VE) only
 $(L/d>2.5)$
, separated vortex excitation and galloping
$(L/d>2.5)$
, separated vortex excitation and galloping
 $(1.5<L/d<2.5)$
, and combined VE and galloping
$(1.5<L/d<2.5)$
, and combined VE and galloping
 $(L/d=1.0)$
. The VE corresponds to the occurrence of vibration near the reduced velocity
$(L/d=1.0)$
. The VE corresponds to the occurrence of vibration near the reduced velocity
 $U_{r}(=U_{\infty }/f_{n}D)$
at which the natural vortex shedding frequency
$U_{r}(=U_{\infty }/f_{n}D)$
at which the natural vortex shedding frequency
 $f_{v}$
coincides with the natural frequency
$f_{v}$
coincides with the natural frequency
 $f_{n}$
of the fluid–cylinder system. At VE,
$f_{n}$
of the fluid–cylinder system. At VE,
 $f_{n}$
and
$f_{n}$
and
 $f_{v}$
are locked in with each other. The galloping persists for higher
$f_{v}$
are locked in with each other. The galloping persists for higher
 $U_{r}$
corresponding to a much higher
$U_{r}$
corresponding to a much higher
 $f_{v}$
than
$f_{v}$
than
 $f_{n}$
, which is also called wake-galloping (Cooper & Wardlaw Reference Cooper and Wardlaw1971). Brika & Laneville (Reference Brika and Laneville1997, Reference Brika and Laneville1999) and Laneville & Brika (Reference Laneville and Brika1999) examined the response of a downstream cylinder to a stationary or vibrating upstream cylinder for
$f_{n}$
, which is also called wake-galloping (Cooper & Wardlaw Reference Cooper and Wardlaw1971). Brika & Laneville (Reference Brika and Laneville1997, Reference Brika and Laneville1999) and Laneville & Brika (Reference Laneville and Brika1999) examined the response of a downstream cylinder to a stationary or vibrating upstream cylinder for
 $L/d=6.5{-}24.5$
,
$L/d=6.5{-}24.5$
,
 $U_{r}=4{-}25$
and
$U_{r}=4{-}25$
and
 $m^{\ast }\unicode[STIX]{x1D701}=0.00007$
. For the stationary upstream cylinder, the response of the downstream cylinder was strongly dependent on
$m^{\ast }\unicode[STIX]{x1D701}=0.00007$
. For the stationary upstream cylinder, the response of the downstream cylinder was strongly dependent on
 $L/d$
; the VE regime became wider and shifted to lower
$L/d$
; the VE regime became wider and shifted to lower
 $U_{r}$
. The cylinder exhibited a combination of VE and galloping for
$U_{r}$
. The cylinder exhibited a combination of VE and galloping for
 $L/d=6.5{-}8.0$
. Hover & Triantafyllou (Reference Hover and Triantafyllou2001) at
$L/d=6.5{-}8.0$
. Hover & Triantafyllou (Reference Hover and Triantafyllou2001) at
 $m^{\ast }\unicode[STIX]{x1D701}=0.12$
performed an investigation on the forces on a spring-mounted downstream cylinder for
$m^{\ast }\unicode[STIX]{x1D701}=0.12$
performed an investigation on the forces on a spring-mounted downstream cylinder for
 $L/d=4.25$
. Both VE and galloping were observed as
$L/d=4.25$
. Both VE and galloping were observed as
 $U_{r}$
was varied from 2 to 17 by changing
$U_{r}$
was varied from 2 to 17 by changing
 $f_{n}$
via varying the cylinder mass and/or spring stiffness at a given
$f_{n}$
via varying the cylinder mass and/or spring stiffness at a given
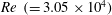 $Re~(=3.05\times 10^{4})$
. They noted an increase in the time-averaged drag coefficient
$Re~(=3.05\times 10^{4})$
. They noted an increase in the time-averaged drag coefficient
 $C_{D}$
and fluctuating drag coefficient
$C_{D}$
and fluctuating drag coefficient
 $C_{Df}$
by approximately two times in the VE and galloping regimes. While growing in the VE regime, the fluctuating lift coefficient
$C_{Df}$
by approximately two times in the VE and galloping regimes. While growing in the VE regime, the fluctuating lift coefficient
 $C_{Lf}$
dropped with increasing
$C_{Lf}$
dropped with increasing
 $U_{r}$
during galloping. Kim et al. (Reference Kim, Alam, Sakamoto and Zhou2009) investigated the flow-induced vibration characteristics of two tandem circular cylinders for
$U_{r}$
during galloping. Kim et al. (Reference Kim, Alam, Sakamoto and Zhou2009) investigated the flow-induced vibration characteristics of two tandem circular cylinders for
 $L/d=0.6{-}3.7$
,
$L/d=0.6{-}3.7$
,
 $U_{r}=1.5{-}26$
and
$U_{r}=1.5{-}26$
and
 $m^{\ast }\unicode[STIX]{x1D701}=0.65$
. The response characteristics of the cylinders were classified into five regimes based on
$m^{\ast }\unicode[STIX]{x1D701}=0.65$
. The response characteristics of the cylinders were classified into five regimes based on
 $L/d$
: in regimes I
$L/d$
: in regimes I
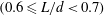 $(0.6\leqslant L/d<0.7)$
and IV
$(0.6\leqslant L/d<0.7)$
and IV
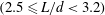 $(2.5\leqslant L/d<3.2)$
, the cylinder vibration was insignificant; in regime II
$(2.5\leqslant L/d<3.2)$
, the cylinder vibration was insignificant; in regime II
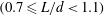 $(0.7\leqslant L/d<1.1)$
, both cylinders vibrated appreciably for
$(0.7\leqslant L/d<1.1)$
, both cylinders vibrated appreciably for
 $U_{r}>6$
, and the upstream one experienced a divergent vibration; and both cylinders showed convergent vibrations at
$U_{r}>6$
, and the upstream one experienced a divergent vibration; and both cylinders showed convergent vibrations at
 $U_{r}\approx 6.7$
and vibrated like an isolated cylinder at
$U_{r}\approx 6.7$
and vibrated like an isolated cylinder at
 $U_{r}\approx 6$
in regimes III
$U_{r}\approx 6$
in regimes III
 $(1.1\leqslant L/d<2.5)$
and V
$(1.1\leqslant L/d<2.5)$
and V
 $(L/d\geqslant 3.2)$
, respectively. Mahir & Rockwell (Reference Mahir and Rockwell1996) studied the flow structure around two cylinders that were forced to vibrate in in-phase or out-of-phase mode. Assi, Bearman & Meneghini (Reference Assi, Bearman and Meneghini2010) investigated the vibration of a downstream cylinder
$(L/d\geqslant 3.2)$
, respectively. Mahir & Rockwell (Reference Mahir and Rockwell1996) studied the flow structure around two cylinders that were forced to vibrate in in-phase or out-of-phase mode. Assi, Bearman & Meneghini (Reference Assi, Bearman and Meneghini2010) investigated the vibration of a downstream cylinder
 $(m^{\ast }\unicode[STIX]{x1D701}=0.018)$
for
$(m^{\ast }\unicode[STIX]{x1D701}=0.018)$
for
 $L/d=3.5{-}5.5$
where the vortices were generated in the gap between the cylinders. They observed the divergent galloping vibration when the vibration grows with increasing
$L/d=3.5{-}5.5$
where the vortices were generated in the gap between the cylinders. They observed the divergent galloping vibration when the vibration grows with increasing
 $U_{r}$
. Assi et al. (Reference Assi, Bearman, Carmo, Meneghini, Sherwin and Willden2013) introduced wake stiffness, a consequence of the fluid forces. The wake stiffness concept suggested a decreasing vibration frequency with
$U_{r}$
. Assi et al. (Reference Assi, Bearman, Carmo, Meneghini, Sherwin and Willden2013) introduced wake stiffness, a consequence of the fluid forces. The wake stiffness concept suggested a decreasing vibration frequency with
 $L/d$
, which increased in reality. They experimentally observed galloping vibration but failed to unearth the initiation of the vibration. All investigations discussed above involve two identical cylinders. In fact, previous studies on the FIV of two tandem cylinders have mostly been conducted for two cylinders of identical diameter at a low
$L/d$
, which increased in reality. They experimentally observed galloping vibration but failed to unearth the initiation of the vibration. All investigations discussed above involve two identical cylinders. In fact, previous studies on the FIV of two tandem cylinders have mostly been conducted for two cylinders of identical diameter at a low
 $m^{\ast }\unicode[STIX]{x1D701}$
value.
$m^{\ast }\unicode[STIX]{x1D701}$
value.
There are only a few studies where the FIV on cylinders of different diameters
 $(d/D\neq 1.0)$
has been investigated. Lam & To (Reference Lam and To2003) performed an experimental study where the downstream cylinder was flexible and smaller in diameter than the upstream cylinder (i.e.
$(d/D\neq 1.0)$
has been investigated. Lam & To (Reference Lam and To2003) performed an experimental study where the downstream cylinder was flexible and smaller in diameter than the upstream cylinder (i.e.
 $d/D=2.0$
). No vibration was observed, although the value of
$d/D=2.0$
). No vibration was observed, although the value of
 $m^{\ast }\unicode[STIX]{x1D701}$
was small, 0.002. The observation was attributed to the fact that the upstream cylinder of larger diameter acted to shelter the downstream cylinder. Rahmanian et al. (Reference Rahmanian, Zhao, Cheng and Zhou2012) performed a numerical simulation on the vortex-induced vibrations of two cylinders of
$m^{\ast }\unicode[STIX]{x1D701}$
was small, 0.002. The observation was attributed to the fact that the upstream cylinder of larger diameter acted to shelter the downstream cylinder. Rahmanian et al. (Reference Rahmanian, Zhao, Cheng and Zhou2012) performed a numerical simulation on the vortex-induced vibrations of two cylinders of
 $d/D=0.1$
where the cylinders were mechanically coupled, behaving as one combined cylinder. The interaction between the coupled cylinders led to a very irregular vibration of the bundle in both the streamwise and cross-flow directions. Huang & Sworn (Reference Huang and Sworn2013) at
$d/D=0.1$
where the cylinders were mechanically coupled, behaving as one combined cylinder. The interaction between the coupled cylinders led to a very irregular vibration of the bundle in both the streamwise and cross-flow directions. Huang & Sworn (Reference Huang and Sworn2013) at
 $m^{\ast }\unicode[STIX]{x1D701}=0.02$
investigated the fluid–structure interaction between pairs of flexible cylinders of
$m^{\ast }\unicode[STIX]{x1D701}=0.02$
investigated the fluid–structure interaction between pairs of flexible cylinders of
 $d/D=4.0$
, 2.0 and 1.0, that is, the upstream cylinder was again larger. The measurement results were very limited.
$d/D=4.0$
, 2.0 and 1.0, that is, the upstream cylinder was again larger. The measurement results were very limited.
In spite of these investigations, a systematic study has never been conducted on the flow-induced response of the downstream cylinder, especially for
 $d/D<1.0$
. As such, many issues remain to be addressed. For example, although the
$d/D<1.0$
. As such, many issues remain to be addressed. For example, although the
 $L/d$
ranges are documented for the VE or wake-galloping, it is not clear how the vibrations are initiated. Furthermore, the dependence of the cylinder vibration on
$L/d$
ranges are documented for the VE or wake-galloping, it is not clear how the vibrations are initiated. Furthermore, the dependence of the cylinder vibration on
 $L/d$
and
$L/d$
and
 $d/D$
is not documented, especially when
$d/D$
is not documented, especially when
 $d/D<1$
. Then, what roles do the added mass, added damping and energy transfer play in generating the vibration? Would the wake structure mutate when the cylinder vibration amplitude grows? All these issues warrant the present investigation.
$d/D<1$
. Then, what roles do the added mass, added damping and energy transfer play in generating the vibration? Would the wake structure mutate when the cylinder vibration amplitude grows? All these issues warrant the present investigation.
This work aims to study experimentally the flow-induced vibration of a cylinder in the presence of an upstream fixed cylinder. The downstream cylinder is spring-supported and free to oscillate only transversely. The
 $d$
and
$d$
and
 $L$
are varied, with an unchanged
$L$
are varied, with an unchanged
 $D$
, so that
$D$
, so that
 $d/D$
and
$d/D$
and
 $L/d$
may take values from 0.2 to 1.0 and from 1.0 to 5.5, respectively. The vibration response of the cylinder is systematically measured for
$L/d$
may take values from 0.2 to 1.0 and from 1.0 to 5.5, respectively. The vibration response of the cylinder is systematically measured for
 $U_{r}=3.8{-}44$
. One focus is on how cylinder vibration is initiated. The vortex shedding frequencies behind and in the gap between the cylinders are examined. Furthermore, the gap and wake flows are captured using time-resolved particle image velocimetry (PIV) for selected
$U_{r}=3.8{-}44$
. One focus is on how cylinder vibration is initiated. The vortex shedding frequencies behind and in the gap between the cylinders are examined. Furthermore, the gap and wake flows are captured using time-resolved particle image velocimetry (PIV) for selected
 $L/d$
and
$L/d$
and
 $d/D$
for different reduced velocities in order to understand the mechanisms behind violent structural vibration. Finally, the cylinder displacement and lift force are simultaneously measured and analysed to gain insight into the underlying vibration mechanisms and flow physics.
$d/D$
for different reduced velocities in order to understand the mechanisms behind violent structural vibration. Finally, the cylinder displacement and lift force are simultaneously measured and analysed to gain insight into the underlying vibration mechanisms and flow physics.
2 Experimental details
Experiments were performed in a low-speed, closed-circuit wind tunnel with a test section of 5.6 m in length, 0.8 m in width and 1.0 m in height. Two cylinders were mounted in tandem in the horizontal mid-plane of the test section. Figure 1 shows a schematic of the experimental set-up, definitions of symbols and coordinates
 $(x^{\prime },y^{\prime },z^{\prime })$
and
$(x^{\prime },y^{\prime },z^{\prime })$
and
 $(x,y,z)$
, with the origins defined at the upstream- and downstream-cylinder centres at the mid-span, respectively, both following the right-hand system. The downstream cylinder was hollow, made of Plexiglas, with the outer diameter
$(x,y,z)$
, with the origins defined at the upstream- and downstream-cylinder centres at the mid-span, respectively, both following the right-hand system. The downstream cylinder was hollow, made of Plexiglas, with the outer diameter
 $D=40~\text{mm}$
, inner diameter 36 mm and length
$D=40~\text{mm}$
, inner diameter 36 mm and length
 $l=740~\text{mm}$
. Then
$l=740~\text{mm}$
. Then
 $m^{\ast }=m/m_{f}=4m/(\unicode[STIX]{x03C0}\unicode[STIX]{x1D70C}D^{2}l)$
was 275, where
$m^{\ast }=m/m_{f}=4m/(\unicode[STIX]{x03C0}\unicode[STIX]{x1D70C}D^{2}l)$
was 275, where
 $m$
is the total vibrating mass,
$m$
is the total vibrating mass,
 $m_{f}$
is the mass of fluid displaced by the cylinder and
$m_{f}$
is the mass of fluid displaced by the cylinder and
 $\unicode[STIX]{x1D70C}$
is the density of the fluid. The diameter
$\unicode[STIX]{x1D70C}$
is the density of the fluid. The diameter
 $d$
was 8, 16, 24, 32 and 40 mm, corresponding to
$d$
was 8, 16, 24, 32 and 40 mm, corresponding to
 $d/D=0.2$
, 0.4, 0.6, 0.8 and 1.0, respectively. The first two of the upstream cylinders were made of steel, and the others were made of Plexiglas. The upstream cylinder was fixed at both ends on the wind-tunnel sidewalls. By shifting the upstream cylinder position,
$d/D=0.2$
, 0.4, 0.6, 0.8 and 1.0, respectively. The first two of the upstream cylinders were made of steel, and the others were made of Plexiglas. The upstream cylinder was fixed at both ends on the wind-tunnel sidewalls. By shifting the upstream cylinder position,
 $L/d$
took the values 1.0, 1.5, 2.0, 2.5, 3.0, 3.5, 4.0 and 5.5. The blockage is approximately 3.7 % and the aspect ratio of the monitoring (downstream) cylinder is
$L/d$
took the values 1.0, 1.5, 2.0, 2.5, 3.0, 3.5, 4.0 and 5.5. The blockage is approximately 3.7 % and the aspect ratio of the monitoring (downstream) cylinder is
 $l/D=18.5$
. The downstream cylinder and spring system were supported at each end by two spiral springs made of steel, as shown in figure 1(c). The downstream cylinder and spring system was also supported at each end via an aluminium shaft of 6 mm diameter on one cantilever-mounted 1 mm thick leaf spring made of brass (figure 1
a,b). As such, the cylinder could vibrate only transversely. To avoid interference and/or complexities caused by the end of the cylinder, end plates were fitted on both sides. Each end plate consisted of a rectangular slot of
$l/D=18.5$
. The downstream cylinder and spring system were supported at each end by two spiral springs made of steel, as shown in figure 1(c). The downstream cylinder and spring system was also supported at each end via an aluminium shaft of 6 mm diameter on one cantilever-mounted 1 mm thick leaf spring made of brass (figure 1
a,b). As such, the cylinder could vibrate only transversely. To avoid interference and/or complexities caused by the end of the cylinder, end plates were fitted on both sides. Each end plate consisted of a rectangular slot of
 $12~\text{mm}\times 80~\text{mm}$
at the downstream cylinder position to ensure enough clearance for the cylinder vibration. The cylinder displacement
$12~\text{mm}\times 80~\text{mm}$
at the downstream cylinder position to ensure enough clearance for the cylinder vibration. The cylinder displacement
 $Y$
was measured using a laser vibrometer (OFV-505/5000, Polytec), which may resolve a displacement of
$Y$
was measured using a laser vibrometer (OFV-505/5000, Polytec), which may resolve a displacement of
 $0.05~\unicode[STIX]{x03BC}\text{m}$
. The cylinder vibration frequency was obtained from a fast Fourier transform (FFT) based on the power spectral density function
$0.05~\unicode[STIX]{x03BC}\text{m}$
. The cylinder vibration frequency was obtained from a fast Fourier transform (FFT) based on the power spectral density function
 $E_{Y}$
of
$E_{Y}$
of
 $Y$
. The free-stream velocity
$Y$
. The free-stream velocity
 $U_{\infty }$
was varied from 1.8 to
$U_{\infty }$
was varied from 1.8 to
 $20.6~\text{m}~\text{s}^{-1}$
, corresponding to
$20.6~\text{m}~\text{s}^{-1}$
, corresponding to
 $U_{r}=3.8{-}44$
and
$U_{r}=3.8{-}44$
and
 $Re=4.8\times 10^{3}$
to
$Re=4.8\times 10^{3}$
to
 $5.5\times 10^{4}$
. The turbulent intensity for this range of velocity was less than 0.3 %.
$5.5\times 10^{4}$
. The turbulent intensity for this range of velocity was less than 0.3 %.

Figure 1. (a) Experimental set-up, (b) definitions of symbols and (c) the test cylinder support system.
The characteristic properties, i.e.
 $\unicode[STIX]{x1D701}=(\unicode[STIX]{x1D6FF}/2\unicode[STIX]{x03C0})/\sqrt{1+(\unicode[STIX]{x1D6FF}/2\unicode[STIX]{x03C0})^{2}}$
and
$\unicode[STIX]{x1D701}=(\unicode[STIX]{x1D6FF}/2\unicode[STIX]{x03C0})/\sqrt{1+(\unicode[STIX]{x1D6FF}/2\unicode[STIX]{x03C0})^{2}}$
and
 $f_{n}$
, of the model were estimated from the cylinder displacement signal and power spectrum (figure 2) measured using the laser vibrometer when the cylinder was plucked in still air, where
$f_{n}$
, of the model were estimated from the cylinder displacement signal and power spectrum (figure 2) measured using the laser vibrometer when the cylinder was plucked in still air, where
 $\unicode[STIX]{x1D6FF}~(=0.0132)$
is the logarithmic decrement of displacement. The values of
$\unicode[STIX]{x1D6FF}~(=0.0132)$
is the logarithmic decrement of displacement. The values of
 $\unicode[STIX]{x1D701}$
and
$\unicode[STIX]{x1D701}$
and
 $f_{n}$
were 0.0021 and 11.72 Hz (figure 2
b), respectively, yielding
$f_{n}$
were 0.0021 and 11.72 Hz (figure 2
b), respectively, yielding
 $m^{\ast }\unicode[STIX]{x1D701}=$
0.58.
$m^{\ast }\unicode[STIX]{x1D701}=$
0.58.

Figure 2. (a) Signal from a laser vibrometer after a plucking excitation, and (b) power spectrum of the displacement signal.
Two hot wires were used to measure the streamwise fluctuating velocities
 $u_{1}$
and
$u_{1}$
and
 $u_{2}$
, one (HT1) placed in the gap at
$u_{2}$
, one (HT1) placed in the gap at
 $(x^{\prime }/d,y^{\prime }/d,z^{\prime }/d)=(1,1,0)$
and the other (HT2) behind the downstream cylinder placed at
$(x^{\prime }/d,y^{\prime }/d,z^{\prime }/d)=(1,1,0)$
and the other (HT2) behind the downstream cylinder placed at
 $(x/D,y/D,z/D)=(4,-1,0)$
. HT2 was traversed along the streamwise direction to examine the flow evolution. The hot-wire signals are offset, low-pass-filtered, amplified and then digitized using a 16-channel analogue/digital board at the sampling frequency of 3 kHz. The sampling duration is 20 s for each record. The power spectral density functions
$(x/D,y/D,z/D)=(4,-1,0)$
. HT2 was traversed along the streamwise direction to examine the flow evolution. The hot-wire signals are offset, low-pass-filtered, amplified and then digitized using a 16-channel analogue/digital board at the sampling frequency of 3 kHz. The sampling duration is 20 s for each record. The power spectral density functions
 $E_{u1}$
and
$E_{u1}$
and
 $E_{u2}$
of
$E_{u2}$
of
 $u_{1}$
and
$u_{1}$
and
 $u_{2}$
are calculated using the FFT algorithm. The frequency resolution in the power spectra is approximately 0.7 Hz.
$u_{2}$
are calculated using the FFT algorithm. The frequency resolution in the power spectra is approximately 0.7 Hz.
A Dantec high-speed two-dimensional PIV system (Litron LDY304-PIV, Nd:YLF laser; triggering rate up to 727 Hz for double frames) was used to capture the flow in the
 $(x,y)$
plane in the gap and behind the downstream cylinder. The cylinder surface was painted black to minimize the laser reflection noise. The flow was seeded by smoke particles, generated from paraffin oil using a TSI 9307-6 fog generator, with a particle size of approximately
$(x,y)$
plane in the gap and behind the downstream cylinder. The cylinder surface was painted black to minimize the laser reflection noise. The flow was seeded by smoke particles, generated from paraffin oil using a TSI 9307-6 fog generator, with a particle size of approximately
 $1~\unicode[STIX]{x03BC}\text{m}$
in diameter. Flow illumination was provided by two pulsed laser sources of a 527 nm wavelength, each with a maximum energy output of 30 mJ per pulse. One charge-coupled device camera (PhantomV641, double frames) was used to capture particle images with a resolution of
$1~\unicode[STIX]{x03BC}\text{m}$
in diameter. Flow illumination was provided by two pulsed laser sources of a 527 nm wavelength, each with a maximum energy output of 30 mJ per pulse. One charge-coupled device camera (PhantomV641, double frames) was used to capture particle images with a resolution of
 $2560\times 1600$
pixels. The laser pulse and image taking were synchronized via a Dantec timer box 80N77. A total of 1600 images were captured at the trigger rate (on the double frame mode) of 300 Hz for each combination of
$2560\times 1600$
pixels. The laser pulse and image taking were synchronized via a Dantec timer box 80N77. A total of 1600 images were captured at the trigger rate (on the double frame mode) of 300 Hz for each combination of
 $d/D$
,
$d/D$
,
 $L/d$
and
$L/d$
and
 $U_{r}$
examined. In processing images, the interrogation window was chosen to be
$U_{r}$
examined. In processing images, the interrogation window was chosen to be
 $32\times 32$
pixels with a 50 % overlap in each direction. Moving-average validation then followed, where the averaging area consisted of
$32\times 32$
pixels with a 50 % overlap in each direction. Moving-average validation then followed, where the averaging area consisted of
 $3\times 3$
interrogation windows with an acceptance factor of 0.1.
$3\times 3$
interrogation windows with an acceptance factor of 0.1.
The pressure signal
 $P(t)$
around the downstream cylinder surface was captured using a piezoresistive pressure scanner (Pressure Systems DTC Initium+ESP-32HD) with a range of
$P(t)$
around the downstream cylinder surface was captured using a piezoresistive pressure scanner (Pressure Systems DTC Initium+ESP-32HD) with a range of
 $\pm 2.5~\text{kPa}$
. A total of 30 pressure taps of 0.8 mm in diameter were made around the cylinder. Adjacent taps were spanwise offset by 1 mm to minimize their possible interference, producing a spiral tap distribution with a spanwise separation of 30 mm between the first and last taps, which corresponded to the same azimuthal position and hence measured the same pressure. The 30 taps were connected to 30 ports of the pressure scanner, and the remaining two ports were connected to a Pitot tube placed upstream at
$\pm 2.5~\text{kPa}$
. A total of 30 pressure taps of 0.8 mm in diameter were made around the cylinder. Adjacent taps were spanwise offset by 1 mm to minimize their possible interference, producing a spiral tap distribution with a spanwise separation of 30 mm between the first and last taps, which corresponded to the same azimuthal position and hence measured the same pressure. The 30 taps were connected to 30 ports of the pressure scanner, and the remaining two ports were connected to a Pitot tube placed upstream at
 $(x,y,z)=(-600~\text{mm},300~\text{mm},0)$
to monitor the static pressure
$(x,y,z)=(-600~\text{mm},300~\text{mm},0)$
to monitor the static pressure
 $P_{s}$
and total pressure, based on which
$P_{s}$
and total pressure, based on which
 $U_{\infty }$
may be determined. The scanner output was calibrated to give a reading of 6.22 V for the applied pressure of 1 kPa. The pressure scanner responded to the pressure fluctuation of up to 625 Hz. The ensuing phase lag is negligibly small. It is worth pointing out that the cylinder mass ratio was
$U_{\infty }$
may be determined. The scanner output was calibrated to give a reading of 6.22 V for the applied pressure of 1 kPa. The pressure scanner responded to the pressure fluctuation of up to 625 Hz. The ensuing phase lag is negligibly small. It is worth pointing out that the cylinder mass ratio was
 $m^{\ast }=350$
for pressure measurement; and
$m^{\ast }=350$
for pressure measurement; and
 $\unicode[STIX]{x1D701}$
and
$\unicode[STIX]{x1D701}$
and
 $f_{n}$
were from 0.0021 to 0.043 and from 11.72 to 10.23 Hz, respectively. Consequently,
$f_{n}$
were from 0.0021 to 0.043 and from 11.72 to 10.23 Hz, respectively. Consequently,
 $U_{r}$
increases, given the same galloping vibration amplitude as that without the cables.
$U_{r}$
increases, given the same galloping vibration amplitude as that without the cables.
The pressure coefficient is calculated by
 $C_{P}(t)=(P(t)-P_{s})/(0.5\unicode[STIX]{x1D70C}U_{\infty }^{2})$
. The time-dependent lift force coefficient
$C_{P}(t)=(P(t)-P_{s})/(0.5\unicode[STIX]{x1D70C}U_{\infty }^{2})$
. The time-dependent lift force coefficient
 $(C_{L})$
on the cylinder is obtained by integrating the surface pressure, viz.
$(C_{L})$
on the cylinder is obtained by integrating the surface pressure, viz.
 $$\begin{eqnarray}C_{L}(t)=\frac{1}{2}\int _{0}^{2\unicode[STIX]{x03C0}}C_{p}(t)\sin \unicode[STIX]{x1D703}\,\text{d}\unicode[STIX]{x1D703}=\frac{1}{2}\mathop{\sum }_{i=1}^{i=30}C_{pi}(t)\sin \unicode[STIX]{x1D703}_{i}\,\unicode[STIX]{x0394}\unicode[STIX]{x1D703}_{i},\end{eqnarray}$$
where
 $\unicode[STIX]{x1D703}$
is the azimuthal position of a pressure tap, measured in radians from the nominal leading stagnation point of the cylinder, and
$\unicode[STIX]{x1D703}$
is the azimuthal position of a pressure tap, measured in radians from the nominal leading stagnation point of the cylinder, and
 $i~(=1,2,\ldots ,30)$
indicates the pressure tap number.
$i~(=1,2,\ldots ,30)$
indicates the pressure tap number.
3 Results and discussion
3.1 Dependence of downstream cylinder vibration on
 $L/d$
and
$d/D$
$L/d$
and
$d/D$


The maximum amplitude
 $A$
of the cylinder displacement signal
$A$
of the cylinder displacement signal
 $Y$
is obtained by multiplying the root-mean-square (r.m.s.) value of
$Y$
is obtained by multiplying the root-mean-square (r.m.s.) value of
 $Y$
by
$Y$
by
 $\sqrt{2}$
, i.e.
$\sqrt{2}$
, i.e.
 $A=Y_{rms}\times \sqrt{2}$
, which provides the average amplitude of the cylinder oscillation. Figure 3 presents the dependence of
$A=Y_{rms}\times \sqrt{2}$
, which provides the average amplitude of the cylinder oscillation. Figure 3 presents the dependence of
 $A/D$
on
$A/D$
on
 $d/D$
and
$d/D$
and
 $L/d$
. At
$L/d$
. At
 $L/d=1.0$
(figure 3
a), a violent vibration starts to occur at
$L/d=1.0$
(figure 3
a), a violent vibration starts to occur at
 $U_{r}=11.5$
, 8.8, 8.0 and 7.5 for
$U_{r}=11.5$
, 8.8, 8.0 and 7.5 for
 $d/D=0.2$
, 0.4, 0.6 and 0.8, respectively, but not for
$d/D=0.2$
, 0.4, 0.6 and 0.8, respectively, but not for
 $d/D=1.0$
. Here, ‘violent vibration’ means a vibration of much larger amplitude than that in VE. A tiny hump that occurs around
$d/D=1.0$
. Here, ‘violent vibration’ means a vibration of much larger amplitude than that in VE. A tiny hump that occurs around
 $U_{r}=5$
is the signature of VE, and the corresponding
$U_{r}=5$
is the signature of VE, and the corresponding
 $A/D$
is in general less than 0.05 or 2 mm in
$A/D$
is in general less than 0.05 or 2 mm in
 $A$
(figure 3
a). At
$A$
(figure 3
a). At
 $L/d=1.5{-}2.5$
(figure 3
b–d), a violent vibration occurs for
$L/d=1.5{-}2.5$
(figure 3
b–d), a violent vibration occurs for
 $d/D=0.2$
, 0.4 and 0.6, but not for
$d/D=0.2$
, 0.4 and 0.6, but not for
 $d/D=0.8{-}1.0$
. The violent vibration is evident only for
$d/D=0.8{-}1.0$
. The violent vibration is evident only for
 $d/D=0.2{-}0.4$
as
$d/D=0.2{-}0.4$
as
 $L/d$
is increased to 3.0–4.0 (figure 3
e–g). A further increase in
$L/d$
is increased to 3.0–4.0 (figure 3
e–g). A further increase in
 $L/d$
to 5.5 results in violent vibration only for
$L/d$
to 5.5 results in violent vibration only for
 $d/D=0.2$
(figure 3
h). Clearly, as
$d/D=0.2$
(figure 3
h). Clearly, as
 $L/d$
increases, the violent vibration takes place at smaller
$L/d$
increases, the violent vibration takes place at smaller
 $d/D$
.
$d/D$
.

Figure 3. Dependence of
 $A/D$
on
$A/D$
on
 $U_{r}$
for various
$U_{r}$
for various
 $d/D$
at (a)
$d/D$
at (a)
 $L/d=1.0$
, (b) 1.5, (c) 2.0, (d) 2.5, (e) 3.0, (f) 3.5, (g) 4.0 and (h) 5.5, and (i) for various
$L/d=1.0$
, (b) 1.5, (c) 2.0, (d) 2.5, (e) 3.0, (f) 3.5, (g) 4.0 and (h) 5.5, and (i) for various
 $L/d$
at
$L/d$
at
 $d/D=1.0$
. The symbols in (i) have the same definitions as in (a–h).
$d/D=1.0$
. The symbols in (i) have the same definitions as in (a–h).
Note that there is no violent vibration generated given
 $d/D=1.0$
for the
$d/D=1.0$
for the
 $U_{r}$
range examined, except for a tiny hump at
$U_{r}$
range examined, except for a tiny hump at
 $U_{r}\approx 5$
in
$U_{r}\approx 5$
in
 $A/D$
for
$A/D$
for
 $L/d>3.0$
(figure 3
f–h) apparently due to vortex shedding in the co-shedding regime. Figure 3(i) presents the data for
$L/d>3.0$
(figure 3
f–h) apparently due to vortex shedding in the co-shedding regime. Figure 3(i) presents the data for
 $d/D=1.0$
and
$d/D=1.0$
and
 $L/d=1.0{-}5.5$
over
$L/d=1.0{-}5.5$
over
 $U_{r}=3.8{-}44$
. The VE occurs at
$U_{r}=3.8{-}44$
. The VE occurs at
 $U_{r}\approx 5$
and disappears beyond
$U_{r}\approx 5$
and disappears beyond
 $U_{r}\approx 6.4$
. Given
$U_{r}\approx 6.4$
. Given
 $d/D=1$
, Bokaian & Geoola (Reference Bokaian and Geoola1984a
), however, observed the combined VE and galloping at
$d/D=1$
, Bokaian & Geoola (Reference Bokaian and Geoola1984a
), however, observed the combined VE and galloping at
 $L/d=1.0$
and separated VE and galloping at
$L/d=1.0$
and separated VE and galloping at
 $1.5<L/d<2.5$
. The difference can be attributed to their much smaller
$1.5<L/d<2.5$
. The difference can be attributed to their much smaller
 $m^{\ast }\unicode[STIX]{x1D701}~(=0.109)$
and
$m^{\ast }\unicode[STIX]{x1D701}~(=0.109)$
and
 $Re~(=800{-}5800)$
than the present values (
$Re~(=800{-}5800)$
than the present values (
 $m^{\ast }\unicode[STIX]{x1D701}=0.58$
,
$m^{\ast }\unicode[STIX]{x1D701}=0.58$
,
 $Re=4800{-}55\,000$
, corresponding to
$Re=4800{-}55\,000$
, corresponding to
 $U_{r}=3.8{-}44.0$
in figure 3
i). Assi (Reference Assi2014) investigated the downstream cylinder vibration in a two-tandem-cylinder wake for
$U_{r}=3.8{-}44.0$
in figure 3
i). Assi (Reference Assi2014) investigated the downstream cylinder vibration in a two-tandem-cylinder wake for
 $d/D=1.0$
, 0.5 and 0.33 at
$d/D=1.0$
, 0.5 and 0.33 at
 $L/d=3.5$
, 7.0 and 6.5, respectively, all in the co-shedding regime (
$L/d=3.5$
, 7.0 and 6.5, respectively, all in the co-shedding regime (
 $Re=1500{-}23\,000$
or
$Re=1500{-}23\,000$
or
 $U_{r}=2{-}30$
); their
$U_{r}=2{-}30$
); their
 $m^{\ast }\unicode[STIX]{x1D701}$
values were 0.0091, 0.0091 and 0.0041, respectively. Again, combined VE and galloping vibrations were observed for all three cases examined. Presently,
$m^{\ast }\unicode[STIX]{x1D701}$
values were 0.0091, 0.0091 and 0.0041, respectively. Again, combined VE and galloping vibrations were observed for all three cases examined. Presently,
 $m^{\ast }\unicode[STIX]{x1D701}=0.58$
is much higher, producing quite different results, i.e. no vibration in the co-shedding regime. Note that, since
$m^{\ast }\unicode[STIX]{x1D701}=0.58$
is much higher, producing quite different results, i.e. no vibration in the co-shedding regime. Note that, since
 $m^{\ast }\unicode[STIX]{x1D701}$
was very small in both Bokaian & Geoola’s (Reference Bokaian and Geoola1984a
) and Assi’s (Reference Assi2014) investigations, galloping could not be separated from VE, and VE provided an initial displacement for the galloping to meet the criteria that an initial displacement is needed to trigger the gap flow switch (Zdravkovich Reference Zdravkovich1974; Ruscheweyh & Dielen Reference Ruscheweyh and Dielen1992; Dielen & Ruscheweyh Reference Dielen and Ruscheweyh1995). The vibration amplitude in the VE regime contracts exponentially with increasing
$m^{\ast }\unicode[STIX]{x1D701}$
was very small in both Bokaian & Geoola’s (Reference Bokaian and Geoola1984a
) and Assi’s (Reference Assi2014) investigations, galloping could not be separated from VE, and VE provided an initial displacement for the galloping to meet the criteria that an initial displacement is needed to trigger the gap flow switch (Zdravkovich Reference Zdravkovich1974; Ruscheweyh & Dielen Reference Ruscheweyh and Dielen1992; Dielen & Ruscheweyh Reference Dielen and Ruscheweyh1995). The vibration amplitude in the VE regime contracts exponentially with increasing
 $m^{\ast }\unicode[STIX]{x1D701}$
(Khalak & Williamson Reference Khalak and Williamson1997). Because of the present large
$m^{\ast }\unicode[STIX]{x1D701}$
(Khalak & Williamson Reference Khalak and Williamson1997). Because of the present large
 $m^{\ast }\unicode[STIX]{x1D701}$
, the combined VE and galloping vibration fails to occur, as is evident from the tiny hump at
$m^{\ast }\unicode[STIX]{x1D701}$
, the combined VE and galloping vibration fails to occur, as is evident from the tiny hump at
 $U_{r}\approx 5$
in
$U_{r}\approx 5$
in
 $A/D$
(figure 3). Zhao & Yan (Reference Zhao and Yan2013) numerically examined the two-degree-of-freedom vibration of two rigidly coupled cylinders at
$A/D$
(figure 3). Zhao & Yan (Reference Zhao and Yan2013) numerically examined the two-degree-of-freedom vibration of two rigidly coupled cylinders at
 $Re=250$
(
$Re=250$
(
 $m^{\ast }=2$
,
$m^{\ast }=2$
,
 $\unicode[STIX]{x1D701}=0$
,
$\unicode[STIX]{x1D701}=0$
,
 $d/D=0.2$
, and
$d/D=0.2$
, and
 $L/d=0.5$
and 1.5). The VE only was observed at
$L/d=0.5$
and 1.5). The VE only was observed at
 $L/d=0.5$
and 1.5. Huang & Sworn (Reference Huang and Sworn2011) investigated the hydrodynamic interaction between one pair of elastically supported rigid cylinders (
$L/d=0.5$
and 1.5. Huang & Sworn (Reference Huang and Sworn2011) investigated the hydrodynamic interaction between one pair of elastically supported rigid cylinders (
 $d/D=2$
and
$d/D=2$
and
 $m^{\ast }\unicode[STIX]{x1D701}=0.02$
). The upstream cylinder diameter was larger than that of the downstream cylinder. The
$m^{\ast }\unicode[STIX]{x1D701}=0.02$
). The upstream cylinder diameter was larger than that of the downstream cylinder. The
 $Re$
was in the range of 16 000–72 000, corresponding to
$Re$
was in the range of 16 000–72 000, corresponding to
 $U_{r}=2{-}9$
, which covered only the typical VE regime. The downstream cylinder vibration amplitude during VE was smaller than that of the upstream cylinder, and no galloping was observed. Owing to the presently much larger
$U_{r}=2{-}9$
, which covered only the typical VE regime. The downstream cylinder vibration amplitude during VE was smaller than that of the upstream cylinder, and no galloping was observed. Owing to the presently much larger
 $m^{\ast }\unicode[STIX]{x1D701}$
than others (Bokaian & Geoola Reference Bokaian and Geoola1984a
; Assi Reference Assi2014), galloping does not occur for
$m^{\ast }\unicode[STIX]{x1D701}$
than others (Bokaian & Geoola Reference Bokaian and Geoola1984a
; Assi Reference Assi2014), galloping does not occur for
 $d/D=1.0$
in the tandem arrangement. The galloping vibration is, however, expected even at a large
$d/D=1.0$
in the tandem arrangement. The galloping vibration is, however, expected even at a large
 $m^{\ast }\unicode[STIX]{x1D701}$
if the downstream cylinder is placed at a lateral distance from the wake centreline (Zdravkovich Reference Zdravkovich1974; Ruscheweyh & Dielen Reference Ruscheweyh and Dielen1992; Dielen & Ruscheweyh Reference Dielen and Ruscheweyh1995).
$m^{\ast }\unicode[STIX]{x1D701}$
if the downstream cylinder is placed at a lateral distance from the wake centreline (Zdravkovich Reference Zdravkovich1974; Ruscheweyh & Dielen Reference Ruscheweyh and Dielen1992; Dielen & Ruscheweyh Reference Dielen and Ruscheweyh1995).
In the case of the downstream cylinder vibrating in the wake of an upstream cylinder, there is a need to clarify terminologies used in the literature, such as ‘interference galloping’ (Ruscheweyh & Dielen Reference Ruscheweyh and Dielen1992; Dielen & Ruscheweyh Reference Dielen and Ruscheweyh1995), ‘wake galloping’ (Brika & Laneville Reference Brika and Laneville1999), ‘wake-induced galloping’ (Bokaian & Geoola Reference Bokaian and Geoola1984a
) or ‘wake-induced vibration’ (Assi et al.
Reference Assi, Bearman and Meneghini2010). The interference galloping has been explained as the ‘flow switching’ (Ruscheweyh & Dielen Reference Ruscheweyh and Dielen1992; Dielen & Ruscheweyh Reference Dielen and Ruscheweyh1995). Brika & Laneville (Reference Brika and Laneville1999) found in the wake of two tandem cylinders (
 $L/d=6.5$
and 8) that the downstream cylinder exhibited a combination of VE and wake galloping, and the mechanism of the wake galloping was not elucidated. Bokaian & Geoola (Reference Bokaian and Geoola1984a
) stated that, though the excitation mechanism of wake-excited galloping is similar to that of galloping of sharp-edged bodies, an initial displacement might be required to trigger the vibration for the former. Assi et al. (Reference Assi, Bearman and Meneghini2010) did not agree with the opinion that the excitation mechanism was similar to that of classical galloping. They proposed that the wake-induced vibration was essentially one type of vortex-induced vibration mechanisms in the sense that this vibration required an interaction between the structure and vortices from the upstream cylinder, which is different from the interactions between the shear layers and the downstream cylinder in this paper.
$L/d=6.5$
and 8) that the downstream cylinder exhibited a combination of VE and wake galloping, and the mechanism of the wake galloping was not elucidated. Bokaian & Geoola (Reference Bokaian and Geoola1984a
) stated that, though the excitation mechanism of wake-excited galloping is similar to that of galloping of sharp-edged bodies, an initial displacement might be required to trigger the vibration for the former. Assi et al. (Reference Assi, Bearman and Meneghini2010) did not agree with the opinion that the excitation mechanism was similar to that of classical galloping. They proposed that the wake-induced vibration was essentially one type of vortex-induced vibration mechanisms in the sense that this vibration required an interaction between the structure and vortices from the upstream cylinder, which is different from the interactions between the shear layers and the downstream cylinder in this paper.
3.2 Dependence of vortex shedding frequencies on
$L/d$
and
$d/D$


Figure 4 shows the variation in
 $f_{v}/f_{n}$
with
$f_{v}/f_{n}$
with
 $U_{r}$
for various
$U_{r}$
for various
 $d/D$
and
$d/D$
and
 $L/d$
, where
$L/d$
, where
 $f_{v}$
is extracted from the power spectral density function of the HT2 signal. The Strouhal number
$f_{v}$
is extracted from the power spectral density function of the HT2 signal. The Strouhal number
 $St~(=0.2)$
in the wake of an isolated cylinder is also given as a reference. The two cylinders, when vibrating little such as at
$St~(=0.2)$
in the wake of an isolated cylinder is also given as a reference. The two cylinders, when vibrating little such as at
 $d/D=1.0$
, may be considered to be fixed, and
$d/D=1.0$
, may be considered to be fixed, and
 $f_{v}/f_{n}$
rises with
$f_{v}/f_{n}$
rises with
 $U_{r}$
, but not exactly linearly, suggesting a dependence of
$U_{r}$
, but not exactly linearly, suggesting a dependence of
 $St$
on
$St$
on
 $Re$
(Xu & Zhou Reference Xu and Zhou2004; Alam Reference Alam2014). At
$Re$
(Xu & Zhou Reference Xu and Zhou2004; Alam Reference Alam2014). At
 $L/d=1.0{-}2.5$
and
$L/d=1.0{-}2.5$
and
 $d/D=1.0$
,
$d/D=1.0$
,
 $f_{v}/f_{n}$
shows a departure from
$f_{v}/f_{n}$
shows a departure from
 $St=0.2$
with increasing
$St=0.2$
with increasing
 $U_{r}$
or
$U_{r}$
or
 $Re$
. The
$Re$
. The
 $St$
estimated from
$St$
estimated from
 $f_{v}$
after the lock-in at which
$f_{v}$
after the lock-in at which
 $f_{v}$
is locked on with
$f_{v}$
is locked on with
 $f_{n}$
(
$f_{n}$
(
 $U_{r}>5$
and
$U_{r}>5$
and
 $Re>6.3\times 10^{3}$
) drops from 0.17–0.20 to 0.14–0.15 as
$Re>6.3\times 10^{3}$
) drops from 0.17–0.20 to 0.14–0.15 as
 $Re$
is increased from
$Re$
is increased from
 $6.3\times 10^{3}$
(
$6.3\times 10^{3}$
(
 $U_{r}=5$
) to
$U_{r}=5$
) to
 $2.8\times 10^{4}$
(
$2.8\times 10^{4}$
(
 $U_{r}=22$
). The same observation of
$U_{r}=22$
). The same observation of
 $St$
was made by Xu & Zhou (Reference Xu and Zhou2004) at
$St$
was made by Xu & Zhou (Reference Xu and Zhou2004) at
 $Re=(6{-}8)\times 10^{3}$
for two fixed tandem cylinders
$Re=(6{-}8)\times 10^{3}$
for two fixed tandem cylinders
 $(d/D=1)$
at
$(d/D=1)$
at
 $L/d=1.5{-}2.5$
where the shear layers separated from the upstream cylinder reattached on the upstream side of the downstream cylinder. The drop in
$L/d=1.5{-}2.5$
where the shear layers separated from the upstream cylinder reattached on the upstream side of the downstream cylinder. The drop in
 $St$
was attributed to an upstream shift in reattachment with increasing
$St$
was attributed to an upstream shift in reattachment with increasing
 $Re$
. At
$Re$
. At
 $d/D=1.0$
and
$d/D=1.0$
and
 $L/d=3.0$
(figure 4
e), only one
$L/d=3.0$
(figure 4
e), only one
 $f_{v}/f_{n}$
or
$f_{v}/f_{n}$
or
 $St\approx 0.13$
is detected for
$St\approx 0.13$
is detected for
 $U_{r}<8.3$
(
$U_{r}<8.3$
(
 $Re<1.05\times 10^{4}$
) but two (black and red squares) or
$Re<1.05\times 10^{4}$
) but two (black and red squares) or
 $St\approx 0.13$
and 0.17 for
$St\approx 0.13$
and 0.17 for
 $U_{r}\geqslant 8.3$
(
$U_{r}\geqslant 8.3$
(
 $Re\geqslant 1.05\times 10^{4}$
). The two distinct
$Re\geqslant 1.05\times 10^{4}$
). The two distinct
 $f_{v}/f_{n}$
result from the well-known bistable phenomenon or the intermittent occurrence of the reattachment and co-shedding flows, corresponding to the lower and higher
$f_{v}/f_{n}$
result from the well-known bistable phenomenon or the intermittent occurrence of the reattachment and co-shedding flows, corresponding to the lower and higher
 $f_{v}/f_{n}$
, respectively (Alam Reference Alam2014). The latter
$f_{v}/f_{n}$
, respectively (Alam Reference Alam2014). The latter
 $f_{v}/f_{n}$
(red squares) is close to
$f_{v}/f_{n}$
(red squares) is close to
 $St=0.2$
, the same as in an isolated cylinder wake, following almost a straight line with the variation in
$St=0.2$
, the same as in an isolated cylinder wake, following almost a straight line with the variation in
 $U_{r}$
, while the other (black squares) does not follow a straight line. The observation implies that
$U_{r}$
, while the other (black squares) does not follow a straight line. The observation implies that
 $St$
is more sensitive to a variation in
$St$
is more sensitive to a variation in
 $Re$
in the reattachment regime than in the co-shedding regime. This is reasonable. A change in
$Re$
in the reattachment regime than in the co-shedding regime. This is reasonable. A change in
 $Re$
may influence the shear layer reattachment position and hence
$Re$
may influence the shear layer reattachment position and hence
 $St$
. Igarashi (Reference Igarashi1984), Xu & Zhou (Reference Xu and Zhou2004), Zhou et al. (Reference Zhou, Feng, Alam and Bai2009) and Alam (Reference Alam2014) showed in the wake of two fixed cylinders that
$St$
. Igarashi (Reference Igarashi1984), Xu & Zhou (Reference Xu and Zhou2004), Zhou et al. (Reference Zhou, Feng, Alam and Bai2009) and Alam (Reference Alam2014) showed in the wake of two fixed cylinders that
 $St$
and forces in the reattachment regime are dependent on
$St$
and forces in the reattachment regime are dependent on
 $Re$
as the shear layer reattachment position is sensitive to
$Re$
as the shear layer reattachment position is sensitive to
 $Re$
. For example,
$Re$
. For example,
 $St$
is reduced when the shear layer reattachment proceeds towards the forward stagnation point (Igarashi Reference Igarashi1984; Zhou et al.
Reference Zhou, Feng, Alam and Bai2009). In the wake of two fixed cylinders
$St$
is reduced when the shear layer reattachment proceeds towards the forward stagnation point (Igarashi Reference Igarashi1984; Zhou et al.
Reference Zhou, Feng, Alam and Bai2009). In the wake of two fixed cylinders
 $(L/d=3.0)$
, Xu & Zhou (Reference Xu and Zhou2004) observed the bistable flow at
$(L/d=3.0)$
, Xu & Zhou (Reference Xu and Zhou2004) observed the bistable flow at
 $Re=1.5\times 10^{4}$
but not at
$Re=1.5\times 10^{4}$
but not at
 $Re\geqslant 2.0\times 10^{4}$
. Their
$Re\geqslant 2.0\times 10^{4}$
. Their
 $Re$
is small compared to the present
$Re$
is small compared to the present
 $Re>1.05\times 10^{4}$
(
$Re>1.05\times 10^{4}$
(
 $U_{r}>8.3$
). The difference may come from the downstream cylinder vibrating at small amplitude (figure 3
i). Flexibly supported, the downstream cylinder can be more adaptable to any change in the gap flow between the cylinders. At
$U_{r}>8.3$
). The difference may come from the downstream cylinder vibrating at small amplitude (figure 3
i). Flexibly supported, the downstream cylinder can be more adaptable to any change in the gap flow between the cylinders. At
 $L/d=4.0$
and 5.5, where co-shedding occurs,
$L/d=4.0$
and 5.5, where co-shedding occurs,
 $f_{v}/f_{n}$
follows a straight line, consistent with the fact that the
$f_{v}/f_{n}$
follows a straight line, consistent with the fact that the
 $Re$
effect on
$Re$
effect on
 $St$
is insignificant in the co-shedding regime (Xu & Zhou Reference Xu and Zhou2004).
$St$
is insignificant in the co-shedding regime (Xu & Zhou Reference Xu and Zhou2004).

Figure 4. Variation in
 $f_{v}/f_{n}$
with
$f_{v}/f_{n}$
with
 $U_{r}$
. The two
$U_{r}$
. The two
 $f_{v}/f_{n}$
values in the bistable flow are represented by the same symbols but different colours (red and black).
$f_{v}/f_{n}$
values in the bistable flow are represented by the same symbols but different colours (red and black).
Two
 $f_{v}/f_{n}$
are detected once the downstream cylinder is under violent vibration. The two frequencies are, however, different from those associated with the bistable flow. One
$f_{v}/f_{n}$
are detected once the downstream cylinder is under violent vibration. The two frequencies are, however, different from those associated with the bistable flow. One
 $f_{v}/f_{n}$
equals 1 and the other exceeds 1, increasing with
$f_{v}/f_{n}$
equals 1 and the other exceeds 1, increasing with
 $U_{r}$
, which are ascribed to the cylinder vibration and natural vortex shedding, respectively. A small-amplitude vibration occurs around
$U_{r}$
, which are ascribed to the cylinder vibration and natural vortex shedding, respectively. A small-amplitude vibration occurs around
 $U_{r}=5{-}7$
, due to VE, with
$U_{r}=5{-}7$
, due to VE, with
 $f_{v}/f_{n}\approx 1.0$
.
$f_{v}/f_{n}\approx 1.0$
.
There are a number of interesting aspects on
 $f_{v}/f_{n}$
in figure 4. Firstly,
$f_{v}/f_{n}$
in figure 4. Firstly,
 $f_{v}/f_{n}$
is closer to
$f_{v}/f_{n}$
is closer to
 $St=0.2$
for small
$St=0.2$
for small
 $d/D$
(
$d/D$
(
 $=0.2$
and 0.4) than for large
$=0.2$
and 0.4) than for large
 $d/D$
, implying that, the smaller the upstream cylinder, the less is its influence on
$d/D$
, implying that, the smaller the upstream cylinder, the less is its influence on
 $f_{v}$
and the fluctuating lift force on the downstream cylinder. The difference between the
$f_{v}$
and the fluctuating lift force on the downstream cylinder. The difference between the
 $f_{v}/f_{n}$
value and the line of
$f_{v}/f_{n}$
value and the line of
 $St=0.2$
grows for a large
$St=0.2$
grows for a large
 $d/D$
, indicating that, the larger the
$d/D$
, indicating that, the larger the
 $d/D$
, the greater is the influence on flow. Secondly, it is noteworthy that
$d/D$
, the greater is the influence on flow. Secondly, it is noteworthy that
 $f_{v}$
can be locked on to the third harmonics of
$f_{v}$
can be locked on to the third harmonics of
 $f_{n}$
(
$f_{n}$
(
 $f_{v}/f_{n}=3.0$
), e.g. at
$f_{v}/f_{n}=3.0$
), e.g. at
 $L/d=1.0$
and
$L/d=1.0$
and
 $d/D=0.8$
over
$d/D=0.8$
over
 $U_{r}=12.6{-}16.4$
(figure 4
a) and
$U_{r}=12.6{-}16.4$
(figure 4
a) and
 $L/d=2.0$
and
$L/d=2.0$
and
 $d/D=0.4$
over
$d/D=0.4$
over
 $U_{r}=14{-}18$
(figure 4
c). Thirdly, two distinct
$U_{r}=14{-}18$
(figure 4
c). Thirdly, two distinct
 $f_{v}/f_{n}$
(represented by the same symbol of different colours, red and black) occur in the bistable flow regime, i.e. at
$f_{v}/f_{n}$
(represented by the same symbol of different colours, red and black) occur in the bistable flow regime, i.e. at
 $L/d=3.0$
and
$L/d=3.0$
and
 $d/D=1.0$
over
$d/D=1.0$
over
 $U_{r}>8.3$
(figure 4
e),
$U_{r}>8.3$
(figure 4
e),
 $L/d=3.5$
and
$L/d=3.5$
and
 $d/D=0.8$
over
$d/D=0.8$
over
 $U_{r}=6.5{-}15$
(figure 4
f),
$U_{r}=6.5{-}15$
(figure 4
f),
 $L/d=3.5$
and
$L/d=3.5$
and
 $d/D=0.6$
over
$d/D=0.6$
over
 $U_{r}>18$
(figure 4
f), and
$U_{r}>18$
(figure 4
f), and
 $L/d=4$
and
$L/d=4$
and
 $d/D=0.8$
over
$d/D=0.8$
over
 $U_{r}=5{-}11$
(figure 4
g). While the smaller
$U_{r}=5{-}11$
(figure 4
g). While the smaller
 $f_{v}/f_{n}$
value is connected to the reattachment flow, the other is associated with the upstream-cylinder-generated vortices.
$f_{v}/f_{n}$
value is connected to the reattachment flow, the other is associated with the upstream-cylinder-generated vortices.

Figure 5. Vibration and flow regimes in the
 $d/D$
–
$d/D$
–
 $L/d$
plane
$L/d$
plane
 $(L/d=1.0{-}5.5,~d/D=0.2{-}1.0)$
.
$(L/d=1.0{-}5.5,~d/D=0.2{-}1.0)$
.
3.3 Classification of structural vibration and flow structure
Figure 5 presents the dependence of the structural vibration, shedding frequencies and flow structure on
 $d/D$
and
$d/D$
and
 $L/d$
. Regime I under the solid red curve represents the occurrence of a violent vibration, largely induced by the upstream-cylinder-generated shear layer reattachment on and switch from one side to the other of the downstream cylinder. Evidently, the lock-on of the third harmonic of
$L/d$
. Regime I under the solid red curve represents the occurrence of a violent vibration, largely induced by the upstream-cylinder-generated shear layer reattachment on and switch from one side to the other of the downstream cylinder. Evidently, the lock-on of the third harmonic of
 $f_{n}$
tends to occur near the border between the vibration and no-vibration regimes. When the cylinder experiences a violent vibration, the upstream-cylinder-generated shear layers switch their reattachment on one side to the other of the downstream cylinder, thus resulting in the lock-on at the third harmonic of
$f_{n}$
tends to occur near the border between the vibration and no-vibration regimes. When the cylinder experiences a violent vibration, the upstream-cylinder-generated shear layers switch their reattachment on one side to the other of the downstream cylinder, thus resulting in the lock-on at the third harmonic of
 $f_{n}$
. The no-vibration regime can be further divided into five subregimes (II–VI) depending on the relationship between shedding frequencies
$f_{n}$
. The no-vibration regime can be further divided into five subregimes (II–VI) depending on the relationship between shedding frequencies
 $f_{v1}$
and
$f_{v1}$
and
 $f_{v2}$
between and behind the cylinders detected by HT1 and HT2, respectively. In this paper, ‘no vibration’ means the absence of galloping during VE (synchronization). Regime II
$f_{v2}$
between and behind the cylinders detected by HT1 and HT2, respectively. In this paper, ‘no vibration’ means the absence of galloping during VE (synchronization). Regime II
 $(d/D>0.8{-}0.4,L/d<3.0{-}3.5)$
corresponds to reattachment flow, where
$(d/D>0.8{-}0.4,L/d<3.0{-}3.5)$
corresponds to reattachment flow, where
 $f_{v2}=f_{v1}$
and a superharmonic frequency
$f_{v2}=f_{v1}$
and a superharmonic frequency
 $f_{v2}^{\prime }=2f_{v2}$
(second harmonic) prevails behind the downstream cylinder. Zhou et al. (Reference Zhou, Feng, Alam and Bai2009) and Xu & Zhou (Reference Xu and Zhou2004) made extensive hot-wire measurements on two fixed identical cylinders and observed the second harmonic frequency
$f_{v2}^{\prime }=2f_{v2}$
(second harmonic) prevails behind the downstream cylinder. Zhou et al. (Reference Zhou, Feng, Alam and Bai2009) and Xu & Zhou (Reference Xu and Zhou2004) made extensive hot-wire measurements on two fixed identical cylinders and observed the second harmonic frequency
 $(f_{v2}^{\prime }=2f_{v2})$
behind the downstream cylinder in the reattachment regime. Alam et al. (Reference Alam, Moriya, Takai and Sakamoto2003) and Alam & Sakamoto (Reference Alam and Sakamoto2005) also detected the second as well as the third harmonic frequency from the power spectra of fluctuating lift force
$(f_{v2}^{\prime }=2f_{v2})$
behind the downstream cylinder in the reattachment regime. Alam et al. (Reference Alam, Moriya, Takai and Sakamoto2003) and Alam & Sakamoto (Reference Alam and Sakamoto2005) also detected the second as well as the third harmonic frequency from the power spectra of fluctuating lift force
 $(d/D=1)$
, depending on
$(d/D=1)$
, depending on
 $L/d$
. Alam (Reference Alam2014) noted that the third harmonic frequency occurred if the shear layer separated from the upstream cylinder reattached on the opposite side of the downstream cylinder. On the other hand, the second harmonic frequency might prevail if the shear layer reattaches on the same side of the downstream cylinder. This explains why
$L/d$
. Alam (Reference Alam2014) noted that the third harmonic frequency occurred if the shear layer separated from the upstream cylinder reattached on the opposite side of the downstream cylinder. On the other hand, the second harmonic frequency might prevail if the shear layer reattaches on the same side of the downstream cylinder. This explains why
 $f_{v2}^{\prime }=2f_{v2}$
appears in regime II where the cylinder vibrates little. The bistable flow or regime III appears at a larger
$f_{v2}^{\prime }=2f_{v2}$
appears in regime II where the cylinder vibrates little. The bistable flow or regime III appears at a larger
 $L/d$
for a smaller
$L/d$
for a smaller
 $d/D$
. Regimes IV
$d/D$
. Regimes IV
 $(d/D\geqslant 0.8,~L/d>3.5{-}4.0)$
, V
$(d/D\geqslant 0.8,~L/d>3.5{-}4.0)$
, V
 $(0.6\leqslant d/D<0.8,~L/d>4.0)$
and VI
$(0.6\leqslant d/D<0.8,~L/d>4.0)$
and VI
 $(d/D<0.6,~L/d>4.0)$
are connected to the co-shedding flow, characterized by synchronized
$(d/D<0.6,~L/d>4.0)$
are connected to the co-shedding flow, characterized by synchronized
 $(f_{v2}=f_{v1})$
, synchronized and subharmonic synchronized
$(f_{v2}=f_{v1})$
, synchronized and subharmonic synchronized
 $(f_{v2}=f_{v1},~f_{v2}^{\prime }=f_{v2}/2)$
, and non-synchronized
$(f_{v2}=f_{v1},~f_{v2}^{\prime }=f_{v2}/2)$
, and non-synchronized
 $(f_{v2}\neq f_{v1})$
sheddings from the two cylinders, respectively. A detailed investigation of
$(f_{v2}\neq f_{v1})$
sheddings from the two cylinders, respectively. A detailed investigation of
 $St$
, forces and flow structures in the wake of two fixed tandem cylinders with
$St$
, forces and flow structures in the wake of two fixed tandem cylinders with
 $d/D=0.24{-}1.0$
was reported by Alam & Zhou (Reference Alam and Zhou2008) in the co-shedding regime
$d/D=0.24{-}1.0$
was reported by Alam & Zhou (Reference Alam and Zhou2008) in the co-shedding regime
 $(L/d=5.5)$
where the upstream-cylinder-generated alternate vortices impinge upon the downstream cylinder. The impingement acted essentially as a quasi-periodic excitation that is strong for
$(L/d=5.5)$
where the upstream-cylinder-generated alternate vortices impinge upon the downstream cylinder. The impingement acted essentially as a quasi-periodic excitation that is strong for
 $d/D\geqslant 0.4$
and weak for
$d/D\geqslant 0.4$
and weak for
 $d/D<0.4$
. The strong excitation forced vortex shedding from the downstream cylinder to be synchronized with that from the upstream cylinder, i.e.
$d/D<0.4$
. The strong excitation forced vortex shedding from the downstream cylinder to be synchronized with that from the upstream cylinder, i.e.
 $f_{v2}=f_{v1}$
, and the weak excitation allowed the downstream cylinder to shed vortices at a lower frequency than the upstream cylinder
$f_{v2}=f_{v1}$
, and the weak excitation allowed the downstream cylinder to shed vortices at a lower frequency than the upstream cylinder
 $(f_{v2}<f_{v1})$
. Presently, synchronization is not observed for
$(f_{v2}<f_{v1})$
. Presently, synchronization is not observed for
 $d/D<0.6$
as the downstream cylinder is flexibly supported.
$d/D<0.6$
as the downstream cylinder is flexibly supported.
3.3.1 Bistable flow regime
The bistable flow phenomenon associated with the intermittent occurrence of reattachment and co-shedding flows has been reported for two rigid cylinders (e.g. Igarashi Reference Igarashi1982). We discuss here the bistable flow when the downstream cylinder is flexibly supported.
Figure 6 presents
 $E_{u1}$
,
$E_{u1}$
,
 $E_{u2}$
and
$E_{u2}$
and
 $E_{Y}$
of simultaneously captured
$E_{Y}$
of simultaneously captured
 $u_{1}$
,
$u_{1}$
,
 $u_{2}$
and
$u_{2}$
and
 $Y$
signals (
$Y$
signals (
 $L/d=3.0$
,
$L/d=3.0$
,
 $d/D=1.0$
and
$d/D=1.0$
and
 $U_{r}=11.0$
). The plot of
$U_{r}=11.0$
). The plot of
 $E_{u1}$
(figure 6
a) displays one pronounced peak at 22.0 Hz or
$E_{u1}$
(figure 6
a) displays one pronounced peak at 22.0 Hz or
 $St=0.171$
, while that of
$St=0.171$
, while that of
 $E_{u2}$
(figure 6
b) shows two at 17.6 Hz
$E_{u2}$
(figure 6
b) shows two at 17.6 Hz
 $(St=0.137)$
and 22.0 Hz
$(St=0.137)$
and 22.0 Hz
 $(St=0.171)$
. Obviously, the single
$(St=0.171)$
. Obviously, the single
 $St$
in the gap corresponds to the co-shedding mode. Under the reattachment flow mode, there should be no discernible peak in the spectra measured between the cylinders (e.g. Alam et al.
Reference Alam, Moriya, Takai and Sakamoto2003; Xu & Zhou Reference Xu and Zhou2004). The occurrence of two predominant frequencies is ascribed to vortex shedding from the downstream cylinder under the flow modes of reattachment and co-shedding, respectively, or the bistable flow. The plot of
$St$
in the gap corresponds to the co-shedding mode. Under the reattachment flow mode, there should be no discernible peak in the spectra measured between the cylinders (e.g. Alam et al.
Reference Alam, Moriya, Takai and Sakamoto2003; Xu & Zhou Reference Xu and Zhou2004). The occurrence of two predominant frequencies is ascribed to vortex shedding from the downstream cylinder under the flow modes of reattachment and co-shedding, respectively, or the bistable flow. The plot of
 $E_{Y}$
(figure 6
c) shows one pronounced peak at
$E_{Y}$
(figure 6
c) shows one pronounced peak at
 $f_{n}~(=11.7~\text{Hz})$
and also two minor peaks at the shedding frequencies of 17.6 Hz and 22.0 Hz.
$f_{n}~(=11.7~\text{Hz})$
and also two minor peaks at the shedding frequencies of 17.6 Hz and 22.0 Hz.

Figure 6. (a–c) Power spectral density functions
 $E_{u1}$
,
$E_{u1}$
,
 $E_{u2}$
and
$E_{u2}$
and
 $E_{Y}$
of simultaneously captured
$E_{Y}$
of simultaneously captured
 $u_{1}$
,
$u_{1}$
,
 $u_{2}$
and
$u_{2}$
and
 $Y$
, respectively.
$Y$
, respectively.
3.3.2 Violent vibration regime
In view of the objectives of this work, we present first data showing the dependence of the vibration response on
 $d/D$
and
$d/D$
and
 $L/d$
and thus classify the flow regimes with and without vibration. To understand the initiation and mechanism of the vibration, we illustrate one representative case, i.e.
$L/d$
and thus classify the flow regimes with and without vibration. To understand the initiation and mechanism of the vibration, we illustrate one representative case, i.e.
 $L/d=2.0$
and
$L/d=2.0$
and
 $d/D=0.4$
, which occurs near the centre of the vibration regime in the
$d/D=0.4$
, which occurs near the centre of the vibration regime in the
 $L/d$
–
$L/d$
–
 $d/D$
plane. It is worth pointing out that we have actually examined a number of other cases, which are not shown because of the same flow physics.
$d/D$
plane. It is worth pointing out that we have actually examined a number of other cases, which are not shown because of the same flow physics.
3.3.2.1 Connection between vibration and vortex shedding
Representative
 $E_{u2}$
and
$E_{u2}$
and
 $E_{Y}~(d/D=0.4,~L/d=2.0)$
are shown in figure 7(a,b). The
$E_{Y}~(d/D=0.4,~L/d=2.0)$
are shown in figure 7(a,b). The
 $f/f_{n}=f_{v}/f_{n}$
corresponding to the peaks in the spectra (figure 7
a) depends on
$f/f_{n}=f_{v}/f_{n}$
corresponding to the peaks in the spectra (figure 7
a) depends on
 $U_{r}$
, as shown in figure 7(c). The corresponding vibration response is given in figure 7(d). Figure 7 allows us to identify the sources of structural vibration, as indicated on the left side of figure 7(a). A small peak that occurs over
$U_{r}$
, as shown in figure 7(c). The corresponding vibration response is given in figure 7(d). Figure 7 allows us to identify the sources of structural vibration, as indicated on the left side of figure 7(a). A small peak that occurs over
 $U_{r}=4.5{-}5.3$
in figure 7(d) corresponds to
$U_{r}=4.5{-}5.3$
in figure 7(d) corresponds to
 $f_{v}/f_{n}=1.0$
in both
$f_{v}/f_{n}=1.0$
in both
 $E_{u2}$
and
$E_{u2}$
and
 $E_{Y}$
(figure 7
a,b), apparently due to the lock-in of vortex shedding with the first-mode structural vibration or the resonance. At
$E_{Y}$
(figure 7
a,b), apparently due to the lock-in of vortex shedding with the first-mode structural vibration or the resonance. At
 $U_{r}=3.8$
, one peak only occurs at
$U_{r}=3.8$
, one peak only occurs at
 $f/f_{n}=0.875$
in figure 7(a) and two at
$f/f_{n}=0.875$
in figure 7(a) and two at
 $f/f_{n}=0.875$
and 1.0 in figure 7(b), implying that
$f/f_{n}=0.875$
and 1.0 in figure 7(b), implying that
 $f_{v}$
is not locked in with
$f_{v}$
is not locked in with
 $f_{n}$
. Naturally, the cylinder vibration is insignificant or negligibly small at both
$f_{n}$
. Naturally, the cylinder vibration is insignificant or negligibly small at both
 $f_{v}$
and
$f_{v}$
and
 $f_{n}$
. At
$f_{n}$
. At
 $U_{r}=5.3$
, again two peaks are observed at
$U_{r}=5.3$
, again two peaks are observed at
 $f/f_{n}=1.0$
and 1.19 in figure 7(a,b). The peak at
$f/f_{n}=1.0$
and 1.19 in figure 7(a,b). The peak at
 $f/f_{n}=1.0$
is less pronounced in
$f/f_{n}=1.0$
is less pronounced in
 $E_{u2}$
and more in
$E_{u2}$
and more in
 $E_{Y}$
than its counterpart at
$E_{Y}$
than its counterpart at
 $f/f_{n}=1.19$
, suggesting an intermittent lock-in in the transition between the lock-in (VE) and non-lock-in. The peak at
$f/f_{n}=1.19$
, suggesting an intermittent lock-in in the transition between the lock-in (VE) and non-lock-in. The peak at
 $f/f_{n}=1.0$
indicates the occurrence of lock-in and the other at
$f/f_{n}=1.0$
indicates the occurrence of lock-in and the other at
 $f/f_{n}=1.19$
corresponds to natural vortex shedding. The intermittent lock-in at the boundary between the lock-in and non-lock-in regimes is a well-established phenomenon (Leontini et al.
Reference Leontini, Stewart, Thompson and Hourigan2006). For a single circular cylinder, Pan, Cui & Miao (Reference Pan, Cui and Miao2007) found that
$f/f_{n}=1.19$
corresponds to natural vortex shedding. The intermittent lock-in at the boundary between the lock-in and non-lock-in regimes is a well-established phenomenon (Leontini et al.
Reference Leontini, Stewart, Thompson and Hourigan2006). For a single circular cylinder, Pan, Cui & Miao (Reference Pan, Cui and Miao2007) found that
 $C_{L}$
and
$C_{L}$
and
 $Y/D$
appeared less periodic at the end of the lock-in range due to the intermittent occurrence of lock-in.
$Y/D$
appeared less periodic at the end of the lock-in range due to the intermittent occurrence of lock-in.

Figure 7. Power spectral density functions (a)
 $E_{u2}$
and (b)
$E_{u2}$
and (b)
 $E_{Y}$
, and dependence on
$E_{Y}$
, and dependence on
 $U_{r}$
of (c)
$U_{r}$
of (c)
 $f_{v}/f_{n}$
, and (d)
$f_{v}/f_{n}$
, and (d)
 $A/D$
, for
$A/D$
, for
 $L/d=2.0$
and
$L/d=2.0$
and
 $d/D=0.4$
.
$d/D=0.4$
.
As
 $U_{r}$
goes beyond the lock-in range (figure 7
a,c),
$U_{r}$
goes beyond the lock-in range (figure 7
a,c),
 $f_{v}/f_{n}\neq 1.0$
, rising monotonically following
$f_{v}/f_{n}\neq 1.0$
, rising monotonically following
 $St=0.2$
until
$St=0.2$
until
 $U_{r}=8.5$
. There is little vibration over
$U_{r}=8.5$
. There is little vibration over
 $5.3<U_{r}<8.5$
. Similarly to the non-lock-in at
$5.3<U_{r}<8.5$
. Similarly to the non-lock-in at
 $U_{r}=3.8$
, one and two peaks are seen in
$U_{r}=3.8$
, one and two peaks are seen in
 $E_{u2}$
and
$E_{u2}$
and
 $E_{Y}$
, respectively. The
$E_{Y}$
, respectively. The
 $A/D$
value becomes quite significant at
$A/D$
value becomes quite significant at
 $8.5\leqslant U_{r}<9.8$
(figure 7
d); the second peak corresponding to
$8.5\leqslant U_{r}<9.8$
(figure 7
d); the second peak corresponding to
 $f_{v}$
is more appreciable (figure 7
b), though
$f_{v}$
is more appreciable (figure 7
b), though
 $E_{u2}$
does not show any peak at
$E_{u2}$
does not show any peak at
 $f_{v}/f_{n}=1.0$
(figure 7
a). The results indicate that the vibration is initiated by vortex shedding from the cylinder, not due to excitation at
$f_{v}/f_{n}=1.0$
(figure 7
a). The results indicate that the vibration is initiated by vortex shedding from the cylinder, not due to excitation at
 $f_{n}$
. More evidence will be provided later. On the other hand, when
$f_{n}$
. More evidence will be provided later. On the other hand, when
 $A/D$
is large enough at
$A/D$
is large enough at
 $U_{r}>9.8$
,
$U_{r}>9.8$
,
 $E_{u2}$
display two prominent peaks (figure 7
a), corresponding to
$E_{u2}$
display two prominent peaks (figure 7
a), corresponding to
 $f_{v}/f_{n}=1.0$
and
$f_{v}/f_{n}=1.0$
and
 $St=0.2$
(figure 7
c). The latter is maintained up to
$St=0.2$
(figure 7
c). The latter is maintained up to
 $U_{r}=14.9$
and then
$U_{r}=14.9$
and then
 $f_{v}$
is locked in with the third harmonic of
$f_{v}$
is locked in with the third harmonic of
 $f_{n}$
for
$f_{n}$
for
 $U_{r}>14.9$
, where
$U_{r}>14.9$
, where
 $A/D$
rises slowly.
$A/D$
rises slowly.
3.3.2.2 Downstream cylinder vibration effect on flow
The flows at
 $U_{r}=4.9$
and
$U_{r}=4.9$
and
 $U_{r}=14.9$
are examined to understand the differences between the flow structures associated with the VE and galloping vibrations. For each
$U_{r}=14.9$
are examined to understand the differences between the flow structures associated with the VE and galloping vibrations. For each
 $U_{r}$
, using the
$U_{r}$
, using the
 $Y$
signal as a reference signal, we calculated the phase-averaged vorticity contours, based on 64 images, at eight instants for each period
$Y$
signal as a reference signal, we calculated the phase-averaged vorticity contours, based on 64 images, at eight instants for each period
 $T$
of the cylinder oscillation. The contours of the eight instants are presented for
$T$
of the cylinder oscillation. The contours of the eight instants are presented for
 $U_{r}=4.9$
in figure 8(a–h). The correspondence between time instant and cylinder displacement is given in figure 8(i). Here
$U_{r}=4.9$
in figure 8(a–h). The correspondence between time instant and cylinder displacement is given in figure 8(i). Here
 $t/T=0$
refers to the instant when the cylinder crosses the equilibrium position
$t/T=0$
refers to the instant when the cylinder crosses the equilibrium position
 $Y/D=0$
, moving upwards. The vortex formation process may be divided into three stages: growth, saturation and decay (Jeon & Gharib Reference Jeon and Gharib2004). The three stages are also seen presently when the downstream cylinder is vibrating, as discussed below.
$Y/D=0$
, moving upwards. The vortex formation process may be divided into three stages: growth, saturation and decay (Jeon & Gharib Reference Jeon and Gharib2004). The three stages are also seen presently when the downstream cylinder is vibrating, as discussed below.

Figure 8. (a–h) Phase-average vorticity
 $\unicode[STIX]{x1D714}_{z}^{\ast }~(=\unicode[STIX]{x1D714}_{z}D/U_{\infty })$
contours in one vibration cycle. Solid and dotted contour lines stand for clockwise and anticlockwise vorticities. The contour cut-off levels are
$\unicode[STIX]{x1D714}_{z}^{\ast }~(=\unicode[STIX]{x1D714}_{z}D/U_{\infty })$
contours in one vibration cycle. Solid and dotted contour lines stand for clockwise and anticlockwise vorticities. The contour cut-off levels are
 $\pm 0.2$
and the increment is 0.2. (i) Variation in
$\pm 0.2$
and the increment is 0.2. (i) Variation in
 $Y/D$
with
$Y/D$
with
 $t/T$
where the time instants are specified by the dashed lines corresponding to (a–h). Here
$t/T$
where the time instants are specified by the dashed lines corresponding to (a–h). Here
 $L/d=2.0$
,
$L/d=2.0$
,
 $d/D=0.4$
and
$d/D=0.4$
and
 $U_{r}=4.9$
.
$U_{r}=4.9$
.
VE vibration. Under the VE vibration
 $(U_{r}=4.9)$
, the lower shear layer in the gap at
$(U_{r}=4.9)$
, the lower shear layer in the gap at
 $t/T=0$
reattaches onto the lower front side of the downstream cylinder and splits into two (figure 8
a). One moves downstream, and the other flows over the front surface and meets the upper shear layer streaming on the upper side of the downstream cylinder. Four vortices, i.e. B1, B2, A2 and A3, are separated from the downstream cylinder. Between the instants in figure 8(a) and figure 8(b), B2 and A3 are close to the flow separation point and grow due to the continued addition of vorticity from the boundary layers. At the instant in figure 8(b), B1 is about to separate to become a free vortex (Gerrard Reference Gerrard1966). As
$t/T=0$
reattaches onto the lower front side of the downstream cylinder and splits into two (figure 8
a). One moves downstream, and the other flows over the front surface and meets the upper shear layer streaming on the upper side of the downstream cylinder. Four vortices, i.e. B1, B2, A2 and A3, are separated from the downstream cylinder. Between the instants in figure 8(a) and figure 8(b), B2 and A3 are close to the flow separation point and grow due to the continued addition of vorticity from the boundary layers. At the instant in figure 8(b), B1 is about to separate to become a free vortex (Gerrard Reference Gerrard1966). As
 $Y/D$
reaches its maximum (figure 8
c,
$Y/D$
reaches its maximum (figure 8
c,
 $t/T=1/4$
), the upper shear layer in the gap reattaches, and part of the reattached shear layer flows along the lower side of the cylinder (figure 8
c). B1 is now completely separated with a tail. Between
$t/T=1/4$
), the upper shear layer in the gap reattaches, and part of the reattached shear layer flows along the lower side of the cylinder (figure 8
c). B1 is now completely separated with a tail. Between
 $t/T=1/12$
and
$t/T=1/12$
and
 $1/4$
, B2 moves downstream appreciably, but A3 does not, indicating vortex shedding from the lower side. Consequently, a new vortex B3 emerges on the lower side (figure 8
c,d). Being closer to the separation point than B2, B3 accumulates vorticity and grows during
$1/4$
, B2 moves downstream appreciably, but A3 does not, indicating vortex shedding from the lower side. Consequently, a new vortex B3 emerges on the lower side (figure 8
c,d). Being closer to the separation point than B2, B3 accumulates vorticity and grows during
 $t/T=1/4{-}5/12$
. Since vortex shedding from the lower side takes place during the half period (figure 8
a–e), A3 is not advected downstream appreciably.
$t/T=1/4{-}5/12$
. Since vortex shedding from the lower side takes place during the half period (figure 8
a–e), A3 is not advected downstream appreciably.
As the cylinder crosses
 $Y/D=0$
and moves downwards, vortex shedding from the upper side starts to occur. A3 moves downstream and grows during
$Y/D=0$
and moves downwards, vortex shedding from the upper side starts to occur. A3 moves downstream and grows during
 $t/T=1/2{-}3/4$
. A new vortex A4 emerges at
$t/T=1/2{-}3/4$
. A new vortex A4 emerges at
 $t/T=11/12$
. The lower shear layer reattaches again at
$t/T=11/12$
. The lower shear layer reattaches again at
 $t/T=3/4$
, and A2 is detached with a tail from the shear layer. It may be inferred that vortex shedding occurs largely from the lower side for
$t/T=3/4$
, and A2 is detached with a tail from the shear layer. It may be inferred that vortex shedding occurs largely from the lower side for
 $Y/D>0$
and from the upper side for
$Y/D>0$
and from the upper side for
 $Y/D<0$
. Therefore, in each oscillation cycle, two free vortices B1 and A2 are completely separated from the shear layers (figure 8
b,f) and two new vortices B3 and A4 emerge. As such, the dynamics of the wake behind the vibrating cylinder is similar to what is found in a classical von Kármán street, exhibiting the classical 2S vortex formation mode (Williamson & Roshko Reference Williamson and Roshko1988). Although the reattached shear layers sweep over the front surface of the downstream cylinder, the flow in the gap between the cylinders is mostly stagnant and the lateral positions of the gap shear layers change little during the oscillation of the downstream cylinder. The observation suggests that the shear layer separated from the upstream cylinder may not produce a significant effect on the lift and hence vibration of the downstream cylinder. Rather, the vibration is generated due to vortex shedding from the downstream cylinder.
$Y/D<0$
. Therefore, in each oscillation cycle, two free vortices B1 and A2 are completely separated from the shear layers (figure 8
b,f) and two new vortices B3 and A4 emerge. As such, the dynamics of the wake behind the vibrating cylinder is similar to what is found in a classical von Kármán street, exhibiting the classical 2S vortex formation mode (Williamson & Roshko Reference Williamson and Roshko1988). Although the reattached shear layers sweep over the front surface of the downstream cylinder, the flow in the gap between the cylinders is mostly stagnant and the lateral positions of the gap shear layers change little during the oscillation of the downstream cylinder. The observation suggests that the shear layer separated from the upstream cylinder may not produce a significant effect on the lift and hence vibration of the downstream cylinder. Rather, the vibration is generated due to vortex shedding from the downstream cylinder.

Figure 9. (a–h) Phase-average vorticity
 $\unicode[STIX]{x1D714}_{z}^{\ast }~(=\unicode[STIX]{x1D714}_{z}D/U_{\infty })$
contours in one cycle. Solid and dotted contour lines stand for clockwise and anticlockwise vorticities. The contour cut-off levels are
$\unicode[STIX]{x1D714}_{z}^{\ast }~(=\unicode[STIX]{x1D714}_{z}D/U_{\infty })$
contours in one cycle. Solid and dotted contour lines stand for clockwise and anticlockwise vorticities. The contour cut-off levels are
 $\pm 0.2$
and the increment is 0.2. (i) Variation in
$\pm 0.2$
and the increment is 0.2. (i) Variation in
 $Y/D$
with
$Y/D$
with
 $t/T$
where the time instants are specified by the dashed lines corresponding to (a–h). Here
$t/T$
where the time instants are specified by the dashed lines corresponding to (a–h). Here
 $L/d=2.0$
,
$L/d=2.0$
,
 $d/D=0.4$
,
$d/D=0.4$
,
 $A/D=0.48$
and
$A/D=0.48$
and
 $U_{r}=14.9$
.
$U_{r}=14.9$
.
Galloping vibration. The flow structure exhibits a difference at
 $U_{r}=14.9$
(
$U_{r}=14.9$
(
 $L/d=2.0$
and
$L/d=2.0$
and
 $d/D=0.4$
) when galloping occurs. Figure 9 presents the phase-averaged vorticity contours during one cycle of oscillation. Recall that the third harmonics lock-in occurs at
$d/D=0.4$
) when galloping occurs. Figure 9 presents the phase-averaged vorticity contours during one cycle of oscillation. Recall that the third harmonics lock-in occurs at
 $U_{r}=14.9{-}17.7$
for
$U_{r}=14.9{-}17.7$
for
 $L/d=2.0$
and
$L/d=2.0$
and
 $d/D=0.4$
. The corresponding flow structure will be explored here. At
$d/D=0.4$
. The corresponding flow structure will be explored here. At
 $t=0~(Y/D=0)$
, the lower shear layer separated from the upstream cylinder reattaches on the downstream cylinder while rolling up in the gap, a small part of the reattached flow joining the lower shear layer of the downstream cylinder (figure 9
a). As the cylinder moves upwards, the upper gap shear layer reattaches on the cylinder (figure 9
b) and swerves downwards without reattachment when
$t=0~(Y/D=0)$
, the lower shear layer separated from the upstream cylinder reattaches on the downstream cylinder while rolling up in the gap, a small part of the reattached flow joining the lower shear layer of the downstream cylinder (figure 9
a). As the cylinder moves upwards, the upper gap shear layer reattaches on the cylinder (figure 9
b) and swerves downwards without reattachment when
 $Y/D$
is large enough (figure 9
c). Both upper and lower gap shear layers join the lower shear layer around the downstream cylinder (figure 9
b,c). Unlike A2 and B2, a new vortex A3 emerging between the instants in figure 9(b) and figure 9(c) originates from the shear layer over the upper side of the cylinder. This vortex does not seem to interact directly with the shear layers separated from the upstream cylinder. A2 occurs on the wake centreline
$Y/D$
is large enough (figure 9
c). Both upper and lower gap shear layers join the lower shear layer around the downstream cylinder (figure 9
b,c). Unlike A2 and B2, a new vortex A3 emerging between the instants in figure 9(b) and figure 9(c) originates from the shear layer over the upper side of the cylinder. This vortex does not seem to interact directly with the shear layers separated from the upstream cylinder. A2 occurs on the wake centreline
 $(y^{\prime }/D=0)$
at the instant in figure 9(c). B2 below
$(y^{\prime }/D=0)$
at the instant in figure 9(c). B2 below
 $y^{\prime }/D=0$
follows the cylinder movement and moves towards
$y^{\prime }/D=0$
follows the cylinder movement and moves towards
 $y^{\prime }/D=0$
from the instant in figure 9(a) to figure 9(c). While leading B2 marginally at the instant in figure 9(a), A2 is
$y^{\prime }/D=0$
from the instant in figure 9(a) to figure 9(c). While leading B2 marginally at the instant in figure 9(a), A2 is
 $2.25D$
downstream of B2 in figure 9(c). Both A2 and B2 occur near
$2.25D$
downstream of B2 in figure 9(c). Both A2 and B2 occur near
 $y^{\prime }/D=0$
in figure 9(d), and their streamwise separation remains unchanged from the instant in figure 9(c) to figure 9(d).
$y^{\prime }/D=0$
in figure 9(d), and their streamwise separation remains unchanged from the instant in figure 9(c) to figure 9(d).
A3 stays away from the wake centreline during the cylinder downward motion (figure 9
c–g). New vortices B3 and A4 emerge at the instant in figure 9(d), and B3 leads A4. They interact vigorously with each other (figure 9
d–f). A4 on the upper side follows the cylinder downward motion, approaching
 $y^{\prime }/D=0$
. In figure 9(h), both A4 and B3 are on
$y^{\prime }/D=0$
. In figure 9(h), both A4 and B3 are on
 $y^{\prime }/D=0$
. It is interesting to note that A3 and B4 are formed from the shear layers, pushed away from the upstream cylinder wake, at the instants in figure 9(b,c) and (f,g), respectively, and both stay away (approximately
$y^{\prime }/D=0$
. It is interesting to note that A3 and B4 are formed from the shear layers, pushed away from the upstream cylinder wake, at the instants in figure 9(b,c) and (f,g), respectively, and both stay away (approximately
 $y/D=\pm 1$
) from the wake centreline, not directly interacting with the gap shear layers. On the other hand, B2 and A2 originate at least partially from the gap shear layers and end up on the wake centreline. So do B3 and A4. Thus, a total of six vortices are formed during one cycle of the cylinder oscillation, accounting for the third harmonic lock-in,
$y/D=\pm 1$
) from the wake centreline, not directly interacting with the gap shear layers. On the other hand, B2 and A2 originate at least partially from the gap shear layers and end up on the wake centreline. So do B3 and A4. Thus, a total of six vortices are formed during one cycle of the cylinder oscillation, accounting for the third harmonic lock-in,
 $f_{v}/f_{n}=3.0$
.
$f_{v}/f_{n}=3.0$
.
While vortices B2, A2, B3 and A4 near the centreline decay rapidly in terms of the maximum vorticity concentration, A3 and B4, far away from the centreline, do so rather slowly. The wake is thus dominated by the latter type of vortex produced alternately following the up-and-down cylinder oscillation. It will be shown later that the cylinder receives energy from flow (positive work) during the shedding process of the former type of vortex. On the other hand, the flow absorbs energy from the cylinder (negative work) during the shedding of the other type of vortex. This difference in energy transfer may also explain why the former type of vortex decays rapidly and the latter survives longer.
The vortex shed from the downstream cylinder swerves downwards at the instants in figure 9(a,b) when the cylinder moves upwards, vortex shedding appearing symmetric in figure 9(c) when the cylinder velocity is zero (maximum
 $Y/D$
). As the cylinder moves downwards (figure 9
c,d), the vortex shed from the downstream cylinder is deflected upwards, with a maximum deflection occurring at the instant in figure 9(e) when the cylinder velocity is maximum. The two gap shear layers pass over the lower and upper sides of the downstream cylinder that reaches the maximum (figure 9
c) and minimum
$Y/D$
). As the cylinder moves downwards (figure 9
c,d), the vortex shed from the downstream cylinder is deflected upwards, with a maximum deflection occurring at the instant in figure 9(e) when the cylinder velocity is maximum. The two gap shear layers pass over the lower and upper sides of the downstream cylinder that reaches the maximum (figure 9
c) and minimum
 $Y/D$
(figure 9
g), respectively. Obviously, the alternating reattachment and switch of the two gap shear layers from one side to the other follow the cylinder oscillation, the switch frequency being synchronized with the cylinder oscillation frequency. Accordingly, there is a radical change in the pressure distribution around the downstream cylinder, which will be discussed in § 3.4. A smaller
$Y/D$
(figure 9
g), respectively. Obviously, the alternating reattachment and switch of the two gap shear layers from one side to the other follow the cylinder oscillation, the switch frequency being synchronized with the cylinder oscillation frequency. Accordingly, there is a radical change in the pressure distribution around the downstream cylinder, which will be discussed in § 3.4. A smaller
 $d/D$
facilitates the gap shear layer switch, as the shear layers can attach at a small incident angle. On the other hand, a large
$d/D$
facilitates the gap shear layer switch, as the shear layers can attach at a small incident angle. On the other hand, a large
 $d/D$
leads to the occurrence of the reattachment at a relatively large incidence angle. Thus, a small
$d/D$
leads to the occurrence of the reattachment at a relatively large incidence angle. Thus, a small
 $d/D$
is associated with a violent vibration (figure 5).
$d/D$
is associated with a violent vibration (figure 5).
The gap flow switch has been suggested as an excitation mechanism of vibration for a flexible cylinder placed behind another of identical diameter (Zdravkovich Reference Zdravkovich1988; Knisely & Kawagoe Reference Knisely and Kawagoe1990; Ruscheweyh & Dielen Reference Ruscheweyh and Dielen1992; Dielen & Ruscheweyh Reference Dielen and Ruscheweyh1995). The downstream cylinder oscillation could not be excited if placed in line with the upstream cylinder but could be excited if given an initial displacement of greater than 0.2
 $D$
(Zdravkovich Reference Zdravkovich1974) or a flow incidence angle of more than
$D$
(Zdravkovich Reference Zdravkovich1974) or a flow incidence angle of more than
 $10^{\circ }$
. The oscillation is generated due to the occurrence of two flow modes, one with a strong gap flow producing a large inward lift force and the other without gap flow (shear–shear layer reattachment) associated with a negligible lift force (Zdravkovich Reference Zdravkovich1988; Dielen & Ruscheweyh Reference Dielen and Ruscheweyh1995). For a stationary downstream cylinder, the former mode may take place when the lateral distance between the two cylinders and the incidence angle exceed critical values. For an elastic downstream cylinder, a strong gap flow persists longer when the downstream cylinder moves towards the wake centreline than moving away from the centreline, and the mode without gap flow starts later as the cylinder shifts away from the centreline. This means a spatial phase lag of flow switching with respect to the lateral motion of the downstream cylinder (Ruscheweyh & Dielen Reference Ruscheweyh and Dielen1992; Dielen & Ruscheweyh Reference Dielen and Ruscheweyh1995). As a result, a phase lag is generated between
$10^{\circ }$
. The oscillation is generated due to the occurrence of two flow modes, one with a strong gap flow producing a large inward lift force and the other without gap flow (shear–shear layer reattachment) associated with a negligible lift force (Zdravkovich Reference Zdravkovich1988; Dielen & Ruscheweyh Reference Dielen and Ruscheweyh1995). For a stationary downstream cylinder, the former mode may take place when the lateral distance between the two cylinders and the incidence angle exceed critical values. For an elastic downstream cylinder, a strong gap flow persists longer when the downstream cylinder moves towards the wake centreline than moving away from the centreline, and the mode without gap flow starts later as the cylinder shifts away from the centreline. This means a spatial phase lag of flow switching with respect to the lateral motion of the downstream cylinder (Ruscheweyh & Dielen Reference Ruscheweyh and Dielen1992; Dielen & Ruscheweyh Reference Dielen and Ruscheweyh1995). As a result, a phase lag is generated between
 $C_{L}$
and
$C_{L}$
and
 $Y$
, which makes the vibration sustainable, corresponding to a positive energy transfer from the flow into the cylinder. Dielen & Ruscheweyh (Reference Dielen and Ruscheweyh1995) proposed the above scenario based on the data of two stationary cylinders, without any information from simultaneously measured
$Y$
, which makes the vibration sustainable, corresponding to a positive energy transfer from the flow into the cylinder. Dielen & Ruscheweyh (Reference Dielen and Ruscheweyh1995) proposed the above scenario based on the data of two stationary cylinders, without any information from simultaneously measured
 $C_{L}$
and
$C_{L}$
and
 $Y/D$
. Their scenario is to a certain extent consistent with the present observation, explaining why the downstream vibration is excited for
$Y/D$
. Their scenario is to a certain extent consistent with the present observation, explaining why the downstream vibration is excited for
 $d/D<1.0$
but not for
$d/D<1.0$
but not for
 $d/D=1.0$
. While their scenario suggests only the gap flow switching, our data show unequivocally that the interaction of the two gap shear layers with the downstream cylinder plays a key role for the generation of the structural vibration.
$d/D=1.0$
. While their scenario suggests only the gap flow switching, our data show unequivocally that the interaction of the two gap shear layers with the downstream cylinder plays a key role for the generation of the structural vibration.
Based on the quasi-steady theory of galloping, galloping cannot be generated for an axisymmetric body, e.g. a circular cylinder (Bearman et al. Reference Bearman, Gartshore, Maull and Parkinson1987). As such, one question arises: Why does galloping takes place for the circular cylinder placed in the wake of another? The two cylinders in tandem are connected by shear layers in the reattachment regime. Then, the effective shape of the two-cylinder system is no longer axisymmetric; hence the two cylinders may be prone to generating galloping vibrations. Given that the upstream cylinder is not fixed, galloping may also occur for the upstream cylinder in the reattachment regime (Bokaian & Geoola Reference Bokaian and Geoola1984b ). In the co-shedding regime, the upstream cylinder does not experience galloping but the downstream cylinder does (Bokaian & Geoola Reference Bokaian and Geoola1984a ,Reference Bokaian and Geoola b ). This is because the upstream cylinder may be considered to be isolated and is now axisymmetric. On the other hand, the downstream cylinder is not axisymmetric with respect to local approaching flow since the flow between the cylinders is non-uniform. Therefore, the galloping motion of the downstream circular cylinder, observed in both reattachment and co-shedding regimes, is not a violation of the galloping theory.
Wake evolution. The wake pattern is sketched over a longer range of
 $x/D$
in figure 10 so that the vortex generation and dynamics can be better illuminated. The cylinder position corresponds to the instant in figure 9(h) and the vortices are shed at the instants in figure 9(a–h). The lateral separations from the centreline
$x/D$
in figure 10 so that the vortex generation and dynamics can be better illuminated. The cylinder position corresponds to the instant in figure 9(h) and the vortices are shed at the instants in figure 9(a–h). The lateral separations from the centreline
 $(y/D=0)$
of vortices A3 and B1 are
$(y/D=0)$
of vortices A3 and B1 are
 $y/D=\pm 1$
, as discussed before. The vortices are placed in the wake based on their positions. The streamwise separations between free vortices A4 and B3, B3 and A3, and A3 and B2 are 2.4
$y/D=\pm 1$
, as discussed before. The vortices are placed in the wake based on their positions. The streamwise separations between free vortices A4 and B3, B3 and A3, and A3 and B2 are 2.4
 $D$
, 1.8
$D$
, 1.8
 $D$
, and 1.0
$D$
, and 1.0
 $D$
, respectively, which are extracted from figure 9(h,g,f), respectively. Also, the streamwise distances between B2 and A2, A2 and B1, and B1 and A1 are 2.4
$D$
, respectively, which are extracted from figure 9(h,g,f), respectively. Also, the streamwise distances between B2 and A2, A2 and B1, and B1 and A1 are 2.4
 $D$
, 1.8
$D$
, 1.8
 $D$
and 1.0
$D$
and 1.0
 $D$
, respectively, obtained from figure 9(d,c,b) in view of the observation that the convection velocity of vortices changes little beyond
$D$
, respectively, obtained from figure 9(d,c,b) in view of the observation that the convection velocity of vortices changes little beyond
 $x/D=5.7$
(Lin & Hsieh Reference Lin and Hsieh2003). It seems that vortices A1, B1 and A2 form one set, whilst B2, A3 and B3 form another. Interestingly, the latter set originates from the cylinder surface during the cylinder moving from the centreline to the top (figure 9
a–c) and the associated shedding occurs during the cylinder motion from the top to the centreline. Similarly, the former set of vortices emerges in the next half cycle of the cylinder motion. The vortices on the centreline decay rapidly, as discussed earlier. Being close to each other, B2 and A3 may be considered to be one pair. Although the pattern appears like a
$x/D=5.7$
(Lin & Hsieh Reference Lin and Hsieh2003). It seems that vortices A1, B1 and A2 form one set, whilst B2, A3 and B3 form another. Interestingly, the latter set originates from the cylinder surface during the cylinder moving from the centreline to the top (figure 9
a–c) and the associated shedding occurs during the cylinder motion from the top to the centreline. Similarly, the former set of vortices emerges in the next half cycle of the cylinder motion. The vortices on the centreline decay rapidly, as discussed earlier. Being close to each other, B2 and A3 may be considered to be one pair. Although the pattern appears like a
 $2\text{P}+2\text{S}$
pattern, the downstream wake survives in a 2S pattern.
$2\text{P}+2\text{S}$
pattern, the downstream wake survives in a 2S pattern.

Figure 10. Sketch of the vortex street behind the cylinders, following figure 9. P and S stand for a vortex pair and a single vortex, respectively. The red dashed line encircles the vortices shed in one complete oscillation cycle.
Figure 11 presents the instantaneous vorticity contours for one oscillation cycle of the cylinder at
 $U_{r}=12.6$
. Note that
$U_{r}=12.6$
. Note that
 $f_{v}/f_{n}$
at
$f_{v}/f_{n}$
at
 $U_{r}=12.6$
is 2.6 (figure 7
c), which is a non-integer number, that is, the downstream cylinder oscillation and vortex shedding do not have a fixed phase shift. Thus phase averaging is inappropriate. Between the instants in figure 11(a) and figure 11(b), concentration A2 tends to break away from the upper shear layer, while B2 grows in size. As the cylinder reaches its maximum amplitude (figure 11
c), B2 breaks away and A3 grows, accompanied by A4. From figure 11(a) to figure 11(c), two vortices (A2 and B2) are formed, with vorticity originated largely from the upper shear layer, which is connected to the upward movement of the cylinder. Similarly, from figure 11(c) to figure 11(g), three vortices A3, B3 and A4 are generated, and vorticity largely originates from the lower shear layer. B4 is about to break away at the instant in figure 11(h) and
$U_{r}=12.6$
is 2.6 (figure 7
c), which is a non-integer number, that is, the downstream cylinder oscillation and vortex shedding do not have a fixed phase shift. Thus phase averaging is inappropriate. Between the instants in figure 11(a) and figure 11(b), concentration A2 tends to break away from the upper shear layer, while B2 grows in size. As the cylinder reaches its maximum amplitude (figure 11
c), B2 breaks away and A3 grows, accompanied by A4. From figure 11(a) to figure 11(c), two vortices (A2 and B2) are formed, with vorticity originated largely from the upper shear layer, which is connected to the upward movement of the cylinder. Similarly, from figure 11(c) to figure 11(g), three vortices A3, B3 and A4 are generated, and vorticity largely originates from the lower shear layer. B4 is about to break away at the instant in figure 11(h) and
 $t/T=1.0$
(not shown). Thus, a total of 5+ vortices are separated from the cylinder, joining the vortex street, in one period of oscillation. The result conforms to
$t/T=1.0$
(not shown). Thus, a total of 5+ vortices are separated from the cylinder, joining the vortex street, in one period of oscillation. The result conforms to
 $f_{v}/f_{n}\approx 2.6$
in a 2S mode. No pairing is observed among these vortices. It is worth pointing out that another frequency at
$f_{v}/f_{n}\approx 2.6$
in a 2S mode. No pairing is observed among these vortices. It is worth pointing out that another frequency at
 $f_{v}/f_{n}=1.0$
is observed at
$f_{v}/f_{n}=1.0$
is observed at
 $U_{r}=12.6$
(figure 7
a), which is due to the cylinder oscillation as the very near wake is directed upwards with the cylinder moving downwards and vice versa.
$U_{r}=12.6$
(figure 7
a), which is due to the cylinder oscillation as the very near wake is directed upwards with the cylinder moving downwards and vice versa.
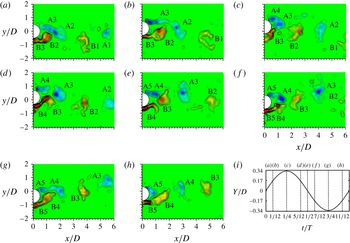
Figure 11. (a–h) Instantaneous vorticity
 $\unicode[STIX]{x1D714}_{z}^{\ast }~(=\unicode[STIX]{x1D714}_{z}D/U_{\infty })$
contours in one vibration cycle. Solid and dotted contour lines stand for clockwise and anticlockwise vorticities. The contour cut-off levels are
$\unicode[STIX]{x1D714}_{z}^{\ast }~(=\unicode[STIX]{x1D714}_{z}D/U_{\infty })$
contours in one vibration cycle. Solid and dotted contour lines stand for clockwise and anticlockwise vorticities. The contour cut-off levels are
 $\pm 0.6$
and the increment is 0.3. (i) Variation in
$\pm 0.6$
and the increment is 0.3. (i) Variation in
 $Y/D$
with
$Y/D$
with
 $t/T$
where the time instants are specified by the dashed lines corresponding to (a–h). Here
$t/T$
where the time instants are specified by the dashed lines corresponding to (a–h). Here
 $L/d=2.0$
,
$L/d=2.0$
,
 $d/D=0.4$
and
$d/D=0.4$
and
 $U_{r}=12.6$
.
$U_{r}=12.6$
.
Sen & Mittal (Reference Sen and Mittal2015) numerically studied the in-line and transverse free vibrations of a square cylinder. For
 $m^{\ast }=10$
and 20, the classical galloping vibration occurred and a total of six vortices were generated within an oscillation cycle of low oscillation amplitude, forming a 3(2S) pattern. The pattern changed to 2P+2S when the transverse displacement surpassed a threshold. It may be inferred that, with an increase in
$m^{\ast }=10$
and 20, the classical galloping vibration occurred and a total of six vortices were generated within an oscillation cycle of low oscillation amplitude, forming a 3(2S) pattern. The pattern changed to 2P+2S when the transverse displacement surpassed a threshold. It may be inferred that, with an increase in
 $U_{r}$
from 12.6 to 14.9, the transverse displacement of the cylinder increases and the transition from the 2S to 2P+2S pattern might take place.
$U_{r}$
from 12.6 to 14.9, the transverse displacement of the cylinder increases and the transition from the 2S to 2P+2S pattern might take place.
In order to understand further the flow evolutions under the VE, no vibration and violent vibration, HT2 was traversed from
 $x/D=4$
to 30 in the wake for three different
$x/D=4$
to 30 in the wake for three different
 $U_{r}=4.7$
(VE), 8.3 (no vibration) and 14.9 (violent vibration). The power spectra of the HT2 signals are presented in figure 12. When the cylinder does not vibrate (figure 12
b), the only peak at
$U_{r}=4.7$
(VE), 8.3 (no vibration) and 14.9 (violent vibration). The power spectra of the HT2 signals are presented in figure 12. When the cylinder does not vibrate (figure 12
b), the only peak at
 $f_{v}$
in
$f_{v}$
in
 $E_{u2}$
decays rapidly as
$E_{u2}$
decays rapidly as
 $x/D$
increases. On the other hand, in the VE regime, the peak is relatively wider and decays less rapidly (figure 12
a). For the violent vibration case (figure 12
c), the peak at
$x/D$
increases. On the other hand, in the VE regime, the peak is relatively wider and decays less rapidly (figure 12
a). For the violent vibration case (figure 12
c), the peak at
 $f_{v}/f_{n}=3$
wanes rapidly with increasing
$f_{v}/f_{n}=3$
wanes rapidly with increasing
 $x/D$
. However, the peak at
$x/D$
. However, the peak at
 $f/f_{n}=1.0$
grows downstream. The observation is internally consistent with the finding from figure 9 that the vortices connected to shear layer impingement decay rapidly and those shed when the cylinder is far away from the centreline persist longer.
$f/f_{n}=1.0$
grows downstream. The observation is internally consistent with the finding from figure 9 that the vortices connected to shear layer impingement decay rapidly and those shed when the cylinder is far away from the centreline persist longer.

Figure 12. Power spectral density function
 $E_{u2}$
for (a) VE at
$E_{u2}$
for (a) VE at
 $U_{r}=4.7$
, (b) no vibration at
$U_{r}=4.7$
, (b) no vibration at
 $U_{r}=8.3$
, and (c) galloping at
$U_{r}=8.3$
, and (c) galloping at
 $U_{r}=14.9$
. Here
$U_{r}=14.9$
. Here
 $L/d=2.0$
and
$L/d=2.0$
and
 $d/D=0.4$
.
$d/D=0.4$
.

Figure 13. (a–e) Phase-averaged vorticity contours and pressure coefficient
 $C_{P\text{-}pa}$
around the downstream cylinder in one half cycle of the cylinder oscillation. The contour cut-off levels are
$C_{P\text{-}pa}$
around the downstream cylinder in one half cycle of the cylinder oscillation. The contour cut-off levels are
 $\pm 0.2$
and the increment is 0.2. (f) Variation with time in the displacement
$\pm 0.2$
and the increment is 0.2. (f) Variation with time in the displacement
 $Y/D$
and lift force coefficient
$Y/D$
and lift force coefficient
 $C_{L}$
over the half cycle. Here
$C_{L}$
over the half cycle. Here
 $L/d=2.0$
,
$L/d=2.0$
,
 $d/D=0.4$
and
$d/D=0.4$
and
 $A/D=0.48$
.
$A/D=0.48$
.
3.4 Pressure and force on the vibrating cylinder
In this section, interactions between the shear layer/vortex and the downstream cylinder will be discussed in terms of the phase-averaged pressure coefficient
 $C_{P\text{-}pa}$
(figure 13
a–e) and lift force coefficient
$C_{P\text{-}pa}$
(figure 13
a–e) and lift force coefficient
 $C_{L}$
(figure 13
f). The
$C_{L}$
(figure 13
f). The
 $C_{P\text{-}pa}$
is positive when pointing to the cylinder centre, and a length of
$C_{P\text{-}pa}$
is positive when pointing to the cylinder centre, and a length of
 $D/2$
corresponds to
$D/2$
corresponds to
 $|C_{P\text{-}pa}|=1.0$
. The concurrent
$|C_{P\text{-}pa}|=1.0$
. The concurrent
 $Y/D$
and
$Y/D$
and
 $C_{L}$
are plotted in figure 13(f) for one half cycle of the cylinder oscillation.
$C_{L}$
are plotted in figure 13(f) for one half cycle of the cylinder oscillation.
At the instant in figure 13(a), the lower gap shear layer reattaches at a small incidence angle on (almost perpendicularly to) the downstream cylinder surface at
 $\unicode[STIX]{x1D703}\approx -22.5^{\circ }$
, where
$\unicode[STIX]{x1D703}\approx -22.5^{\circ }$
, where
 $C_{P\text{-}pa}\approx +1.0$
. The high-momentum fluid of the reattached shear layer follows largely the upper surface of the downstream cylinder and joins the upper shear layer, giving rise to a highly negative pressure on the upper side and resulting in an upward lift force (figure 13
a). At the instant in figure 13(b), the cylinder is away from the centreline, and the gap upper shear layer reattaches on the downstream cylinder at a large incidence angle. The maximum
$C_{P\text{-}pa}\approx +1.0$
. The high-momentum fluid of the reattached shear layer follows largely the upper surface of the downstream cylinder and joins the upper shear layer, giving rise to a highly negative pressure on the upper side and resulting in an upward lift force (figure 13
a). At the instant in figure 13(b), the cylinder is away from the centreline, and the gap upper shear layer reattaches on the downstream cylinder at a large incidence angle. The maximum
 $C_{P\text{-}pa}$
is 0.71 at
$C_{P\text{-}pa}$
is 0.71 at
 $\unicode[STIX]{x1D703}\approx 33.75^{\circ }$
. The lower front cylinder surface is now submerged in the wake of the upstream cylinder, resulting in a negative pressure with a maximum
$\unicode[STIX]{x1D703}\approx 33.75^{\circ }$
. The lower front cylinder surface is now submerged in the wake of the upstream cylinder, resulting in a negative pressure with a maximum
 $C_{P\text{-}pa}$
of
$C_{P\text{-}pa}$
of
 $-0.2$
at
$-0.2$
at
 $\unicode[STIX]{x1D703}\approx -57^{\circ }$
. The major difference in the pressure patterns between figure 13(a) and figure 13(b) is that the positive pressure region shifts from the lower to the upper side. Thus
$\unicode[STIX]{x1D703}\approx -57^{\circ }$
. The major difference in the pressure patterns between figure 13(a) and figure 13(b) is that the positive pressure region shifts from the lower to the upper side. Thus
 $C_{L}$
drops. There is a drastic change in the pressure distribution between the two instants; the highly negative pressure is now on the lower side of the cylinder, as a result of both upper and lower gap shear layers flowing over the lower side of the cylinder. As such,
$C_{L}$
drops. There is a drastic change in the pressure distribution between the two instants; the highly negative pressure is now on the lower side of the cylinder, as a result of both upper and lower gap shear layers flowing over the lower side of the cylinder. As such,
 $C_{L}$
drops further from the instant in figure 13(b) to figure 13(c). Interestingly, while changing greatly during the cylinder motion from the centreline to the top (figure 13
a–c), the pressure distribution does not change much as the cylinder moves from the top to the centreline, pointing to a hysteresis.
$C_{L}$
drops further from the instant in figure 13(b) to figure 13(c). Interestingly, while changing greatly during the cylinder motion from the centreline to the top (figure 13
a–c), the pressure distribution does not change much as the cylinder moves from the top to the centreline, pointing to a hysteresis.
As another interesting observation, it is the interaction between the gap shear layers and the downstream cylinder that largely causes the change during the cylinder motion in the pressure distribution over the front and side surfaces, not vortex shedding from the downstream cylinder.
The time-mean pressure on the cylinder surface, when galloping takes place, is shown in figure 14(a). The pressure distribution is symmetric about
 $\unicode[STIX]{x1D703}=180^{\circ }$
, indicating a zero mean lift for each cycle, which is also reflected in the time history of
$\unicode[STIX]{x1D703}=180^{\circ }$
, indicating a zero mean lift for each cycle, which is also reflected in the time history of
 $C_{L}$
(figure 14
b). As an extension of their earlier work (Sen & Mittal Reference Sen and Mittal2015), Sen & Mittal (Reference Sen and Mittal2016) found at a low
$C_{L}$
(figure 14
b). As an extension of their earlier work (Sen & Mittal Reference Sen and Mittal2015), Sen & Mittal (Reference Sen and Mittal2016) found at a low
 $Re$
that during the galloping vibration the transition from the 3(2S) to 2P+2S pattern is accompanied by a transition from the quasi-periodic flow/body motion to the periodic flow/body motion. At the present high
$Re$
that during the galloping vibration the transition from the 3(2S) to 2P+2S pattern is accompanied by a transition from the quasi-periodic flow/body motion to the periodic flow/body motion. At the present high
 $Re$
, the cylinder motion during galloping is always periodic with almost unchanged amplitude
$Re$
, the cylinder motion during galloping is always periodic with almost unchanged amplitude
 $(\pm 4\,\%)$
since the galloping vibration is sustained by the gap shear layer switching, not by the classical galloping mechanism that prevails in the case of a vibrating square cylinder.
$(\pm 4\,\%)$
since the galloping vibration is sustained by the gap shear layer switching, not by the classical galloping mechanism that prevails in the case of a vibrating square cylinder.

Figure 14. (a) Time-mean pressure coefficient distribution
 $\overline{C}_{p}$
around the cylinder. (b) Time histories of
$\overline{C}_{p}$
around the cylinder. (b) Time histories of
 $C_{L}$
and 20 Hz low-pass-filtered
$C_{L}$
and 20 Hz low-pass-filtered
 $C_{L}$
. The conditions are the same as in figure 13.
$C_{L}$
. The conditions are the same as in figure 13.
3.4.1 Work done
Whether a vibration is sustainable depends on the energy transfer between fluid and cylinder, which is subsequently linked to the way a vortex is shed from the cylinder. It is important to understand the work done by
 $C_{L}$
during cylinder vibration and vortex shedding, separately. To this end,
$C_{L}$
during cylinder vibration and vortex shedding, separately. To this end,
 $C_{L}$
is low- and high-pass-filtered at a cut-off frequency of 15 Hz. Figure 15 presents the temporal evolution of instantaneous and cumulative work,
$C_{L}$
is low- and high-pass-filtered at a cut-off frequency of 15 Hz. Figure 15 presents the temporal evolution of instantaneous and cumulative work,
 $W_{fi}~(=C_{L}\times d(Y/D))$
and
$W_{fi}~(=C_{L}\times d(Y/D))$
and
 $\sum W_{fi}~(=\sum C_{L}\times d(Y/D))$
, done in two cycles of oscillations, where subscripts 1 and 2 denote the low- and high-pass-filtered
$\sum W_{fi}~(=\sum C_{L}\times d(Y/D))$
, done in two cycles of oscillations, where subscripts 1 and 2 denote the low- and high-pass-filtered
 $C_{L}$
, respectively, used in calculating
$C_{L}$
, respectively, used in calculating
 $W_{fi}$
or
$W_{fi}$
or
 $\sum W_{fi}$
. Thus
$\sum W_{fi}$
. Thus
 $W_{fi}$
,
$W_{fi}$
,
 $W_{fi,1}$
and
$W_{fi,1}$
and
 $W_{fi,2}$
represent the total work done, work done from
$W_{fi,2}$
represent the total work done, work done from
 $C_{L}$
at the vibration frequency, and work done from
$C_{L}$
at the vibration frequency, and work done from
 $C_{L}$
at higher frequencies, respectively. Positive and negative
$C_{L}$
at higher frequencies, respectively. Positive and negative
 $W_{fi}$
indicate flows acting to excite and to dampen the vibration, respectively.
$W_{fi}$
indicate flows acting to excite and to dampen the vibration, respectively.

Figure 15. (a) Time histories of
 $Y/D$
, filtered
$Y/D$
, filtered
 $C_{L}$
and instantaneous work done
$C_{L}$
and instantaneous work done
 $W_{fi}$
in two cycles. (b,c) Variations in
$W_{fi}$
in two cycles. (b,c) Variations in
 $W_{fi,2}$
,
$W_{fi,2}$
,
 $\sum W_{fi}$
,
$\sum W_{fi}$
,
 $\sum W_{fi,1}$
and
$\sum W_{fi,1}$
and
 $\sum W_{fi,2}$
in (b) two cycles and (c) 15 cycles. (d) Sketch for the signs of work done in one half cycle of the cylinder oscillation. Here
$\sum W_{fi,2}$
in (b) two cycles and (c) 15 cycles. (d) Sketch for the signs of work done in one half cycle of the cylinder oscillation. Here
 $L/d=2.0$
,
$L/d=2.0$
,
 $d/D=0.4$
and
$d/D=0.4$
and
 $A/D=0.48$
.
$A/D=0.48$
.
As shown in figure 15(a),
 $C_{L}$
decreases to zero as the cylinder moves upwards from
$C_{L}$
decreases to zero as the cylinder moves upwards from
 $Y/D=0$
to 0.31, resulting in positive but decreasing
$Y/D=0$
to 0.31, resulting in positive but decreasing
 $W_{fi,1}$
(process A). As the cylinder continues its upward movement till the top position where
$W_{fi,1}$
(process A). As the cylinder continues its upward movement till the top position where
 $d(Y/D)=0$
,
$d(Y/D)=0$
,
 $W_{fi,1}$
becomes negative (process B). Interestingly, the gap shear layers are involved in the positive
$W_{fi,1}$
becomes negative (process B). Interestingly, the gap shear layers are involved in the positive
 $W_{fi,1}$
and the vortices formed when the cylinder is far away from
$W_{fi,1}$
and the vortices formed when the cylinder is far away from
 $Y/D=0$
are connected to the negative
$Y/D=0$
are connected to the negative
 $W_{fi,1}$
. Next, as the cylinder moves downwards from the top,
$W_{fi,1}$
. Next, as the cylinder moves downwards from the top,
 $W_{fi,1}$
remains positive and reaches its maximum during this quarter of the period (process C). Evidently, there is one half cycle of oscillation in hysteresis due to a phase lag between
$W_{fi,1}$
remains positive and reaches its maximum during this quarter of the period (process C). Evidently, there is one half cycle of oscillation in hysteresis due to a phase lag between
 $C_{L}$
and
$C_{L}$
and
 $Y/D$
, which results from the interaction between the shear layers, separated from the upstream cylinder, and the downstream cylinder as observed in the temporal evolution of the flow structure in figures 9 and 13. A summary sketch of the work done is presented in figure 15(d). While the cylinder moves upwards to
$Y/D$
, which results from the interaction between the shear layers, separated from the upstream cylinder, and the downstream cylinder as observed in the temporal evolution of the flow structure in figures 9 and 13. A summary sketch of the work done is presented in figure 15(d). While the cylinder moves upwards to
 $Y/D=0.31$
, the work done is positive and the cylinder absorbs energy from the flow (process A) when the shear layer reattachment takes place and switches from one mode to the other (figure 13). From
$Y/D=0.31$
, the work done is positive and the cylinder absorbs energy from the flow (process A) when the shear layer reattachment takes place and switches from one mode to the other (figure 13). From
 $Y/D=0.31$
to its maximum, the work done is negative and the flow receives energy from the vibrating cylinder. However, when moving from the top to
$Y/D=0.31$
to its maximum, the work done is negative and the flow receives energy from the vibrating cylinder. However, when moving from the top to
 $Y/D=0$
, the cylinder gains energy from the flow for the entire process C, the maximum energy transfer rate occurring at
$Y/D=0$
, the cylinder gains energy from the flow for the entire process C, the maximum energy transfer rate occurring at
 $Y/D=0.19$
. Interestingly, the energy the cylinder receives is mostly (approximately 75 % of the total energy transfer) transferred at
$Y/D=0.19$
. Interestingly, the energy the cylinder receives is mostly (approximately 75 % of the total energy transfer) transferred at
 $Y/D<0.31$
where the gap shear layers interact vigorously with the downstream cylinder. It seems plausible that the shear layer reattachment and switch are the main sources to generate the cylinder vibration. The
$Y/D<0.31$
where the gap shear layers interact vigorously with the downstream cylinder. It seems plausible that the shear layer reattachment and switch are the main sources to generate the cylinder vibration. The
 $\sum W_{fi,1}$
calculated from the low-pass-filtered
$\sum W_{fi,1}$
calculated from the low-pass-filtered
 $C_{L}$
is similar to
$C_{L}$
is similar to
 $\sum W_{fi}$
calculated from the unfiltered
$\sum W_{fi}$
calculated from the unfiltered
 $C_{L}$
(figure 15
b). The
$C_{L}$
(figure 15
b). The
 $\sum W_{fi,2}$
, calculated over two cycles, is very small, approximately 0.08, compared with
$\sum W_{fi,2}$
, calculated over two cycles, is very small, approximately 0.08, compared with
 $\sum W_{fi,1}~({\approx}2.0)$
. That is, energy transferred from the fluid to the cylinder is largely contributed from
$\sum W_{fi,1}~({\approx}2.0)$
. That is, energy transferred from the fluid to the cylinder is largely contributed from
 $\sum W_{fi,1}$
. The high-frequency modulation in
$\sum W_{fi,1}$
. The high-frequency modulation in
 $W_{fi,2}$
represents the shedding frequency. The work done over a longer time (figure 15
c) reveals that
$W_{fi,2}$
represents the shedding frequency. The work done over a longer time (figure 15
c) reveals that
 $\sum W_{fi,2}$
, though positive, is also very small, approximately
$\sum W_{fi,2}$
, though positive, is also very small, approximately
 $(1/30)\sum W_{fi,1}$
, suggesting a negligibly small contribution to the vibration from the lift associated with higher frequencies.
$(1/30)\sum W_{fi,1}$
, suggesting a negligibly small contribution to the vibration from the lift associated with higher frequencies.
3.4.2 Added mass, added damping, and energy transfer model
The transverse free vibration of a cylinder in a cross-flow may be governed by the following equation (Bearman Reference Bearman1984; Govardhan & Williamson Reference Govardhan and Williamson2000; Williamson & Govardhan Reference Williamson and Govardhan2004)
 $$\begin{eqnarray}m\ddot{Y} +c{\dot{Y}}+kY=F_{L},\end{eqnarray}$$
where
 $m$
is the total oscillating cylinder mass,
$m$
is the total oscillating cylinder mass,
 $c$
is the structural damping,
$c$
is the structural damping,
 $k$
is the spring stiffness and
$k$
is the spring stiffness and
 $F_{L}$
is the time-dependent fluid force in the transverse direction (lift force). The overdot represents a derivative with respect to time
$F_{L}$
is the time-dependent fluid force in the transverse direction (lift force). The overdot represents a derivative with respect to time
 $t$
. The measured transverse force is often approximated by a sinusoidal function. Thus the motion and force may be given by
$t$
. The measured transverse force is often approximated by a sinusoidal function. Thus the motion and force may be given by
 $$\begin{eqnarray}\displaystyle & \displaystyle Y(t)=Y_{0}\sin \unicode[STIX]{x1D714}t, & \displaystyle\end{eqnarray}$$
 $$\begin{eqnarray}\displaystyle & \displaystyle F_{L}(t)=F_{L0}\sin (\unicode[STIX]{x1D714}t+\unicode[STIX]{x1D719}), & \displaystyle\end{eqnarray}$$
where
 $Y_{0}$
is the amplitude of the cylinder oscillation,
$Y_{0}$
is the amplitude of the cylinder oscillation,
 $\unicode[STIX]{x1D714}=2\unicode[STIX]{x03C0}f$
,
$\unicode[STIX]{x1D714}=2\unicode[STIX]{x03C0}f$
,
 $F_{L0}$
is the amplitude of the lift force and
$F_{L0}$
is the amplitude of the lift force and
 $\unicode[STIX]{x1D719}$
is the phase shift between the lift force and cylinder displacement.
$\unicode[STIX]{x1D719}$
is the phase shift between the lift force and cylinder displacement.
The energy
 $W_{f}$
transferred from fluid to the cylinder motion for each cycle of oscillation is given by
$W_{f}$
transferred from fluid to the cylinder motion for each cycle of oscillation is given by
 $$\begin{eqnarray}W_{f}=\int F\,\text{d}Y=\int _{t}^{t+T}F_{L0}\sin (\unicode[STIX]{x1D714}t^{\prime }+\unicode[STIX]{x1D719})\,\text{d}(Y_{0}\sin \unicode[STIX]{x1D714}t^{\prime })=\unicode[STIX]{x03C0}F_{L0}Y_{0}\sin \unicode[STIX]{x1D719}.\end{eqnarray}$$
Equation (3.4) implies that
 $W_{f}$
is directly proportional to
$W_{f}$
is directly proportional to
 $F_{L0}$
and
$F_{L0}$
and
 $Y_{0}$
, and is positive when the lift force leads the displacement by
$Y_{0}$
, and is positive when the lift force leads the displacement by
 $0^{\circ }<\unicode[STIX]{x1D719}<180^{\circ }$
. It should be noted that
$0^{\circ }<\unicode[STIX]{x1D719}<180^{\circ }$
. It should be noted that
 $W_{f}$
grows with
$W_{f}$
grows with
 $\unicode[STIX]{x1D719}$
when
$\unicode[STIX]{x1D719}$
when
 $\unicode[STIX]{x1D719}$
increases from
$\unicode[STIX]{x1D719}$
increases from
 $0^{\circ }$
to
$0^{\circ }$
to
 $90^{\circ }$
and then contracts for further increased
$90^{\circ }$
and then contracts for further increased
 $\unicode[STIX]{x1D719}$
. The energy dissipated by the structural damping is given by
$\unicode[STIX]{x1D719}$
. The energy dissipated by the structural damping is given by
 $$\begin{eqnarray}W_{d}=\int (-c{\dot{Y}})\,\text{d}Y=\int _{t}^{t+T}-c\unicode[STIX]{x1D714}Y_{0}\cos (\unicode[STIX]{x1D714}t^{\prime })\,\text{d}(Y_{0}\sin \unicode[STIX]{x1D714}t^{\prime })=-\unicode[STIX]{x03C0}c\unicode[STIX]{x1D714}Y_{0}^{2}.\end{eqnarray}$$
The component of force at the fundamental (body oscillation) frequency is in general considered to be dominant (Alam & Zhou Reference Alam and Zhou2007; Assi et al. Reference Assi, Bearman and Meneghini2010, Reference Assi, Bearman, Carmo, Meneghini, Sherwin and Willden2013). This is the most relevant component because the other frequency components do not yield a net contribution to the energy transfer between fluid and structure (Morse & Williamson Reference Morse and Williamson2009a ,Reference Morse and Williamson b ). This is also evident in figure 15(b–d).
The lift force can be split into two, viz.
 $$\begin{eqnarray}F_{L0}\sin (\unicode[STIX]{x1D714}t+\unicode[STIX]{x1D719})=F_{L0}\cos \unicode[STIX]{x1D719}\sin \unicode[STIX]{x1D714}t+F_{L0}\sin \unicode[STIX]{x1D719}\cos \unicode[STIX]{x1D714}t,\end{eqnarray}$$
where the first term on the right-hand side is in phase with the cylinder acceleration. Therefore, (3.1) can be written as
 $$\begin{eqnarray}\left(m+\frac{F_{L0}\cos \unicode[STIX]{x1D719}}{\unicode[STIX]{x1D714}^{2}Y_{0}}\right)\ddot{Y} +\left(c-\frac{F_{L0}\sin \unicode[STIX]{x1D719}}{\unicode[STIX]{x1D714}Y_{0}}\right){\dot{Y}}+kY=0.\end{eqnarray}$$
Equation (3.7) provides the added mass
 $m_{a}$
and added damping
$m_{a}$
and added damping
 $c_{a}$
, namely,
$c_{a}$
, namely,
 $$\begin{eqnarray}m_{a}=\frac{F_{L0}\cos \unicode[STIX]{x1D719}}{\unicode[STIX]{x1D714}^{2}Y_{0}}\quad \text{and}\quad c_{a}=-\frac{F_{L0}\sin \unicode[STIX]{x1D719}}{\unicode[STIX]{x1D714}Y_{0}}.\end{eqnarray}$$
Note that
 $m_{a}$
is the effective added mass caused by the lift force in phase with the cylinder acceleration, as opposed to the potential added mass.
$m_{a}$
is the effective added mass caused by the lift force in phase with the cylinder acceleration, as opposed to the potential added mass.
Equation (3.7) can now be rewritten as
 $$\begin{eqnarray}\displaystyle & & \displaystyle \left(m-\lim _{n\rightarrow \infty }\frac{2}{nT(\unicode[STIX]{x1D714}^{2}Y_{0})^{2}}\int _{t}^{t+nT}F\,\ddot{Y} \,\text{d}t^{\prime }\right)\ddot{Y} \nonumber\\ \displaystyle & & \displaystyle \quad +\,\left(c-\lim _{n\rightarrow \infty }\frac{2}{nT(\unicode[STIX]{x1D714}Y_{0})^{2}}\int _{t}^{t+nT}F{\dot{Y}}\,\text{d}t^{\prime }\right){\dot{Y}}+kY=0.\end{eqnarray}$$
The integral terms associated with
 $\ddot{Y}$
and
$\ddot{Y}$
and
 ${\dot{Y}}$
in (3.9) provide the means to estimate
${\dot{Y}}$
in (3.9) provide the means to estimate
 $m_{a}$
and
$m_{a}$
and
 $c_{a}$
, respectively, from experimental data, integrating over an integer number (
$c_{a}$
, respectively, from experimental data, integrating over an integer number (
 $n$
) of oscillations. The added mass ratio
$n$
) of oscillations. The added mass ratio
 $m_{a}^{\ast }$
and added damping ratio
$m_{a}^{\ast }$
and added damping ratio
 $\unicode[STIX]{x1D701}_{a}$
can then be estimated as
$\unicode[STIX]{x1D701}_{a}$
can then be estimated as
 $$\begin{eqnarray}\displaystyle & \displaystyle m_{a}^{\ast }=\frac{m_{a}}{m_{f}}=-\frac{8}{nT\unicode[STIX]{x1D70C}\unicode[STIX]{x03C0}D^{2}l(\unicode[STIX]{x1D714}^{2}Y_{0})^{2}}\int _{t}^{t+nT}F\ddot{Y} \,\text{d}t^{\prime }, & \displaystyle\end{eqnarray}$$
 $$\begin{eqnarray}\displaystyle & \displaystyle \unicode[STIX]{x1D701}_{a}=\frac{c_{a}}{c_{c}}=-\frac{1}{nTm(2\unicode[STIX]{x03C0}f_{n})(\unicode[STIX]{x1D714}Y_{0})^{2}}\int _{t}^{t+nT}F{\dot{Y}}\,\text{d}t^{\prime }\quad (\because c_{c}=4\unicode[STIX]{x03C0}mf_{n}), & \displaystyle\end{eqnarray}$$
 $m_{f}$
is the mass of fluid displaced by the cylinder, and
$m_{f}$
is the mass of fluid displaced by the cylinder, and
 $c_{c}$
is the critical damping. Equations (3.10a
) and (3.10b
) provide an averaged
$c_{c}$
is the critical damping. Equations (3.10a
) and (3.10b
) provide an averaged
 $m_{a}^{\ast }$
and an averaged
$m_{a}^{\ast }$
and an averaged
 $\unicode[STIX]{x1D701}_{a}$
over
$\unicode[STIX]{x1D701}_{a}$
over
 $n$
periods. Having time histories of lift and displacement, we can calculate local
$n$
periods. Having time histories of lift and displacement, we can calculate local
 $m_{a}^{\ast }$
and
$m_{a}^{\ast }$
and
 $\unicode[STIX]{x1D701}_{a}$
over one period
$\unicode[STIX]{x1D701}_{a}$
over one period
 $(n=1)$
or even instantaneous
$(n=1)$
or even instantaneous
 $m_{a}^{\ast }\propto F\ddot{Y}$
and
$m_{a}^{\ast }\propto F\ddot{Y}$
and
 $\unicode[STIX]{x1D701}_{a}\propto F{\dot{Y}}$
.
$\unicode[STIX]{x1D701}_{a}\propto F{\dot{Y}}$
.

Figure 16. Variations in
 $Y_{0}/D$
,
$Y_{0}/D$
,
 $\unicode[STIX]{x1D719}$
,
$\unicode[STIX]{x1D719}$
,
 $W_{f}$
,
$W_{f}$
,
 $\unicode[STIX]{x1D701}_{a}$
,
$\unicode[STIX]{x1D701}_{a}$
,
 $m_{a}^{\ast }$
and
$m_{a}^{\ast }$
and
 $C_{L\,rms}$
with
$C_{L\,rms}$
with
 $U_{r}$
.
$U_{r}$
.
3.4.3 Energy transfer during stable vibrations
At a given
 $U_{r}$
, the cylinder vibrates with almost unchanged amplitude
$U_{r}$
, the cylinder vibrates with almost unchanged amplitude
 $(\pm 4\,\%)$
. Thus
$(\pm 4\,\%)$
. Thus
 $W_{f}$
,
$W_{f}$
,
 $m_{a}^{\ast }$
and
$m_{a}^{\ast }$
and
 $\unicode[STIX]{x1D701}_{a}$
can be calculated from (3.4) and (3.10), where
$\unicode[STIX]{x1D701}_{a}$
can be calculated from (3.4) and (3.10), where
 $F_{L0}=\sqrt{2}\,F_{L\,rms}$
and
$F_{L0}=\sqrt{2}\,F_{L\,rms}$
and
 $Y_{0}=\sqrt{2}\,Y_{rms}$
. The phase lag
$Y_{0}=\sqrt{2}\,Y_{rms}$
. The phase lag
 $\unicode[STIX]{x1D719}$
is calculated from the cross-correlations
$\unicode[STIX]{x1D719}$
is calculated from the cross-correlations
 $R_{F_{L},Y}$
between
$R_{F_{L},Y}$
between
 $F_{L}$
and
$F_{L}$
and
 $Y$
signals obtained simultaneously, viz.
$Y$
signals obtained simultaneously, viz.
 $$\begin{eqnarray}R_{F_{L},Y}(\unicode[STIX]{x1D70F})=\frac{\overline{\{Y(t)\}\{F_{L}(t+\unicode[STIX]{x1D70F})\}}}{[\overline{\{Y(t)\}^{2}}]^{1/2}[\overline{\{F_{L}(t+\unicode[STIX]{x1D70F})\}^{2}}]^{1/2}},\end{eqnarray}$$
where
 $\unicode[STIX]{x1D70F}$
is the time delay and
$\unicode[STIX]{x1D70F}$
is the time delay and
 $t$
is the time. This equation gives the cross-correlation coefficient as a function of
$t$
is the time. This equation gives the cross-correlation coefficient as a function of
 $\unicode[STIX]{x1D70F}$
. The correlation coefficient is the maximum when the two signals are in phase. Yet, the two signals may not necessarily be in phase. Then a time delay given to one of the signals can make the two signals in phase, producing the maximum correlation coefficient. The time delay corresponding to the maximum correlation is scaled with a phase lag
$\unicode[STIX]{x1D70F}$
. The correlation coefficient is the maximum when the two signals are in phase. Yet, the two signals may not necessarily be in phase. Then a time delay given to one of the signals can make the two signals in phase, producing the maximum correlation coefficient. The time delay corresponding to the maximum correlation is scaled with a phase lag
 $\unicode[STIX]{x1D719}$
in angular degrees in one vibration cycle.
$\unicode[STIX]{x1D719}$
in angular degrees in one vibration cycle.
Figure 16 shows how
 $C_{L\,rms}~(=F_{L\,rms}/(0.5\unicode[STIX]{x1D70C}U_{\infty }^{2}lD))$
,
$C_{L\,rms}~(=F_{L\,rms}/(0.5\unicode[STIX]{x1D70C}U_{\infty }^{2}lD))$
,
 $W_{f}$
,
$W_{f}$
,
 $m_{a}^{\ast }$
,
$m_{a}^{\ast }$
,
 $\unicode[STIX]{x1D701}_{a}$
and
$\unicode[STIX]{x1D701}_{a}$
and
 $\unicode[STIX]{x1D719}$
vary with
$\unicode[STIX]{x1D719}$
vary with
 $U_{r}$
or
$U_{r}$
or
 $Y_{0}/D$
. The structural damping ratio
$Y_{0}/D$
. The structural damping ratio
 $\unicode[STIX]{x1D701}$
is
$\unicode[STIX]{x1D701}$
is
 $-$
0.043. With increasing
$-$
0.043. With increasing
 $U_{r}$
,
$U_{r}$
,
 $Y_{0}/D$
rises; so do
$Y_{0}/D$
rises; so do
 $W_{f}$
and
$W_{f}$
and
 $C_{L\,rms}$
, with
$C_{L\,rms}$
, with
 $\unicode[STIX]{x1D719}$
growing from
$\unicode[STIX]{x1D719}$
growing from
 ${\approx}131^{\circ }$
to
${\approx}131^{\circ }$
to
 $146^{\circ }$
. As noted before, an increase in
$146^{\circ }$
. As noted before, an increase in
 $\unicode[STIX]{x1D719}$
beyond
$\unicode[STIX]{x1D719}$
beyond
 $90^{\circ }$
leads to a drop in
$90^{\circ }$
leads to a drop in
 $W_{f}$
. Thus, the rise in
$W_{f}$
. Thus, the rise in
 $Y_{0}/D$
is mainly caused by the increased
$Y_{0}/D$
is mainly caused by the increased
 $C_{L\,rms}$
, accompanied by an increase in
$C_{L\,rms}$
, accompanied by an increase in
 $W_{f}$
. On the other hand, despite a rise in
$W_{f}$
. On the other hand, despite a rise in
 $Y_{0}/D$
with
$Y_{0}/D$
with
 $U_{r}$
,
$U_{r}$
,
 $\unicode[STIX]{x1D701}_{a}$
changes little, hovering around the structural damping ratio
$\unicode[STIX]{x1D701}_{a}$
changes little, hovering around the structural damping ratio
 $\unicode[STIX]{x1D701}$
(dashed line). The observation suggests that
$\unicode[STIX]{x1D701}$
(dashed line). The observation suggests that
 $|\unicode[STIX]{x1D701}|=|\unicode[STIX]{x1D701}_{a}|$
, where
$|\unicode[STIX]{x1D701}|=|\unicode[STIX]{x1D701}_{a}|$
, where
 $\unicode[STIX]{x1D701}$
and
$\unicode[STIX]{x1D701}$
and
 $\unicode[STIX]{x1D701}_{a}$
are positive and negative, respectively. The small departure in the magnitude of
$\unicode[STIX]{x1D701}_{a}$
are positive and negative, respectively. The small departure in the magnitude of
 $\unicode[STIX]{x1D701}_{a}$
from
$\unicode[STIX]{x1D701}_{a}$
from
 $\unicode[STIX]{x1D701}$
may originate from the assumption of sinusoidal
$\unicode[STIX]{x1D701}$
may originate from the assumption of sinusoidal
 $Y$
and
$Y$
and
 $F_{L}$
variations (3.8). For a stable vibration, the energy transferred from fluid to structure should be equal to the energy dissipated by structural damping; that is,
$F_{L}$
variations (3.8). For a stable vibration, the energy transferred from fluid to structure should be equal to the energy dissipated by structural damping; that is,
 $W_{f}+W_{d}=0$
(equations (3.4) and (3.5)), i.e.
$W_{f}+W_{d}=0$
(equations (3.4) and (3.5)), i.e.
 $\unicode[STIX]{x03C0}F_{L0}Y_{0}\sin \unicode[STIX]{x1D719}-\unicode[STIX]{x03C0}c\unicode[STIX]{x1D714}Y_{0}^{2}=0$
. Then, in view of (3.8), we obtain
$\unicode[STIX]{x03C0}F_{L0}Y_{0}\sin \unicode[STIX]{x1D719}-\unicode[STIX]{x03C0}c\unicode[STIX]{x1D714}Y_{0}^{2}=0$
. Then, in view of (3.8), we obtain
 $$\begin{eqnarray}c=\frac{F_{L0}\sin \unicode[STIX]{x1D719}}{\unicode[STIX]{x1D714}Y_{0}}=-c_{a}\quad \text{or}\quad c+c_{a}=0.\end{eqnarray}$$
In other words, the added damping, invariant with
 $U_{r}$
, for a stable vibration simply compensates the structural damping so that the net damping is zero. Note that the energy dissipation due to the structural damping is proportional to
$U_{r}$
, for a stable vibration simply compensates the structural damping so that the net damping is zero. Note that the energy dissipation due to the structural damping is proportional to
 $Y_{0}^{2}$
based on (3.5). The increase in
$Y_{0}^{2}$
based on (3.5). The increase in
 $Y_{0}/D$
with
$Y_{0}/D$
with
 $U_{r}$
thus requires more work done by the lift force. The
$U_{r}$
thus requires more work done by the lift force. The
 $C_{L\,rms}$
is thus augmented accordingly to compensate the dissipation. Furthermore, as
$C_{L\,rms}$
is thus augmented accordingly to compensate the dissipation. Furthermore, as
 $\unicode[STIX]{x1D719}$
moves further away from
$\unicode[STIX]{x1D719}$
moves further away from
 $90^{\circ }$
with increasing
$90^{\circ }$
with increasing
 $U_{r}$
, additional increase in
$U_{r}$
, additional increase in
 $C_{L\,rms}$
is required to compensate its associated decrease in
$C_{L\,rms}$
is required to compensate its associated decrease in
 $W_{f}$
. The relationship between
$W_{f}$
. The relationship between
 $Y_{0}$
,
$Y_{0}$
,
 $F_{L0}$
and
$F_{L0}$
and
 $\unicode[STIX]{x1D719}$
, which may cast light upon the above observation, can be obtained by equating (3.4) and (3.5), viz.
$\unicode[STIX]{x1D719}$
, which may cast light upon the above observation, can be obtained by equating (3.4) and (3.5), viz.
 $W_{f}+W_{d}=0$
. Then
$W_{f}+W_{d}=0$
. Then
 $$\begin{eqnarray}Y_{0}=\frac{F_{L0}\sin \unicode[STIX]{x1D719}}{c\unicode[STIX]{x1D714}}.\end{eqnarray}$$
That is,
 $Y_{0}$
is directly proportional to
$Y_{0}$
is directly proportional to
 $F_{L0}$
.
$F_{L0}$
.
Finally, the relationship between
 $m_{a}^{\ast }$
and
$m_{a}^{\ast }$
and
 $U_{r}$
may be analysed. Interestingly,
$U_{r}$
may be analysed. Interestingly,
 $m_{a}^{\ast }$
decreases monotonically from approximately
$m_{a}^{\ast }$
decreases monotonically from approximately
 $-8$
to
$-8$
to
 $-47$
as
$-47$
as
 $U_{r}$
varies from 29.8 to 41.4 (figure 16
b).
$U_{r}$
varies from 29.8 to 41.4 (figure 16
b).
3.5 Vibration generation mechanism
Previous data analysis casts light upon the flow physics behind the stable cylinder vibration. The questions we must ask first and foremost are how the vibration is initiated and what is the most important factor or parameter involved in this initiation process, which are crucial for finding means to control the vibration. This requires a thorough understanding of what happens in the process when the cylinder vibration starts and grows in amplitude.
Two scenarios are considered to address the issues raised. (I) The wind tunnel is not operated and there is no flow. Set the tunnel fan frequency at 13.8 Hz via the frequency inverter, at which
 $U_{r}$
is
$U_{r}$
is
 $41.4~(A/D=0.48)$
given a steady flow, and the measurement instruments are ready for data acquisition. Then switch on the tunnel and let the wind speed increase continuously from
$41.4~(A/D=0.48)$
given a steady flow, and the measurement instruments are ready for data acquisition. Then switch on the tunnel and let the wind speed increase continuously from
 $U_{r}=0$
to 41.4. The cylinder starts to vibrate at an intermediate
$U_{r}=0$
to 41.4. The cylinder starts to vibrate at an intermediate
 $U_{r}$
, and the vibration amplitude grows till it reaches a constant value. Our focus is given to the transitional stage where the cylinder vibration starts and grows in amplitude. (II) The tunnel is under steady operation and the corresponding
$U_{r}$
, and the vibration amplitude grows till it reaches a constant value. Our focus is given to the transitional stage where the cylinder vibration starts and grows in amplitude. (II) The tunnel is under steady operation and the corresponding
 $U_{r}$
is 41.4. The cylinder is held fixed by two air-compressor-operated clamps installed separately at its two ends (figure 17). One single switch is used to control both clamps so that the release of the clamping force takes place simultaneously at both ends of the cylinder. Once released, the cylinder starts to vibrate from its stationary state to the stable vibration. In order to capture the entire transition process, the data acquisition starts a few seconds before the release of the clamping force.
$U_{r}$
is 41.4. The cylinder is held fixed by two air-compressor-operated clamps installed separately at its two ends (figure 17). One single switch is used to control both clamps so that the release of the clamping force takes place simultaneously at both ends of the cylinder. Once released, the cylinder starts to vibrate from its stationary state to the stable vibration. In order to capture the entire transition process, the data acquisition starts a few seconds before the release of the clamping force.

Figure 17. Air-operated two-finger clamp (hand) to hold and release the cylinder: (a) top view, (b) side view. (c) A sketch of the transition process of amplitude growth.

Figure 18. Time histories of
 $U_{r}$
,
$U_{r}$
,
 $Y/D$
and 20 Hz low-pass-filtered
$Y/D$
and 20 Hz low-pass-filtered
 $C_{L}$
for (a,c,e) case I and (b,d,f) case II.
$C_{L}$
for (a,c,e) case I and (b,d,f) case II.
3.5.1 Force and vibration characteristics in the initiation stage
The measured signals of
 $U_{r}$
,
$U_{r}$
,
 $Y/D$
, filtered
$Y/D$
, filtered
 $C_{L}$
(low-pass-filtered at a cut-off frequency of 20 Hz) are presented for the two cases in figure 18. In case I,
$C_{L}$
(low-pass-filtered at a cut-off frequency of 20 Hz) are presented for the two cases in figure 18. In case I,
 $U_{r}$
rises continuously from 8.5 at
$U_{r}$
rises continuously from 8.5 at
 $t=0~\text{s}$
(arbitrary) to 41.4 at
$t=0~\text{s}$
(arbitrary) to 41.4 at
 $t=16.8~\text{s}$
and then remains unchanged (figure 18
a). The
$t=16.8~\text{s}$
and then remains unchanged (figure 18
a). The
 $Y/D$
remains at 0 until
$Y/D$
remains at 0 until
 $t=8$
s when
$t=8$
s when
 $U_{r}=28.3$
, and then starts to grow (figure 18
c). At
$U_{r}=28.3$
, and then starts to grow (figure 18
c). At
 $t\approx 9~\text{s}$
,
$t\approx 9~\text{s}$
,
 $Y/D$
undergoes a rapid increase, reaching approximately 0.48 at
$Y/D$
undergoes a rapid increase, reaching approximately 0.48 at
 $t=12~\text{s}$
, and then remains unchanged. It should be pointed out that, while
$t=12~\text{s}$
, and then remains unchanged. It should be pointed out that, while
 $U_{r}$
changes from approximately 37 at
$U_{r}$
changes from approximately 37 at
 $t=12~\text{s}$
to 41.4 at
$t=12~\text{s}$
to 41.4 at
 $t=16.8~\text{s}$
,
$t=16.8~\text{s}$
,
 $Y/D$
remains nearly constant, that is,
$Y/D$
remains nearly constant, that is,
 $Y/D$
becomes saturated earlier than
$Y/D$
becomes saturated earlier than
 $U_{r}$
. As shown in figure 18(e), the
$U_{r}$
. As shown in figure 18(e), the
 $C_{L}$
amplitude grows very rapidly from 0.10 (the corresponding
$C_{L}$
amplitude grows very rapidly from 0.10 (the corresponding
 $A/D=0.02$
) at
$A/D=0.02$
) at
 $t=9~\text{s}$
to 1.48 (
$t=9~\text{s}$
to 1.48 (
 $A/D=0.32$
) at 9.8 s. After
$A/D=0.32$
) at 9.8 s. After
 $t=9.8~\text{s}$
, the
$t=9.8~\text{s}$
, the
 $C_{L}$
amplitude retreats slowly up to
$C_{L}$
amplitude retreats slowly up to
 $t=13~\text{s}$
and then remains more or less constant. In case II, the cylinder is initially fixed with
$t=13~\text{s}$
and then remains more or less constant. In case II, the cylinder is initially fixed with
 $U_{r}=41.4$
and then suddenly released at
$U_{r}=41.4$
and then suddenly released at
 $t=1~\text{s}$
(figure 18
b). The
$t=1~\text{s}$
(figure 18
b). The
 $Y/D$
amplitude increases from approximately 0 to 0.48 at
$Y/D$
amplitude increases from approximately 0 to 0.48 at
 $t=1{-}2.9~\text{s}$
, and then remains constant (figure 18
d). The
$t=1{-}2.9~\text{s}$
, and then remains constant (figure 18
d). The
 $C_{L}$
grows rapidly in amplitude up to
$C_{L}$
grows rapidly in amplitude up to
 $t=1.8~\text{s}$
, followed by a small contraction before reaching a rather stable state for
$t=1.8~\text{s}$
, followed by a small contraction before reaching a rather stable state for
 $t>2.5~\text{s}$
(figure 18
f). In both cases, an interesting observation is that
$t>2.5~\text{s}$
(figure 18
f). In both cases, an interesting observation is that
 $C_{L}$
reaches its maximum magnitude in the transitional process before
$C_{L}$
reaches its maximum magnitude in the transitional process before
 $Y/D$
reaches its stable amplitude. As such, we divide the transitional process into two: the initial transition where both
$Y/D$
reaches its stable amplitude. As such, we divide the transitional process into two: the initial transition where both
 $Y/D$
and
$Y/D$
and
 $C_{L}$
grow in amplitude, and the late transition where
$C_{L}$
grow in amplitude, and the late transition where
 $Y/D$
grows but
$Y/D$
grows but
 $C_{L}$
slowly decreases in amplitude. The division point between the two transitions is characterized by the maximum amplitude of
$C_{L}$
slowly decreases in amplitude. The division point between the two transitions is characterized by the maximum amplitude of
 $C_{L}$
. The underlying physics behind the two transitions is different and will be discussed later. A close examination of the variation in
$C_{L}$
. The underlying physics behind the two transitions is different and will be discussed later. A close examination of the variation in
 $Y/D$
unveils that
$Y/D$
unveils that
 $Y/D$
grows rapidly in amplitude in the initial transition and mildly in the late transition, characterized by positive and negative curvatures, respectively. The maximum amplitude of
$Y/D$
grows rapidly in amplitude in the initial transition and mildly in the late transition, characterized by positive and negative curvatures, respectively. The maximum amplitude of
 $C_{L}$
occurs at the inflection point where the curvature is zero.
$C_{L}$
occurs at the inflection point where the curvature is zero.

Figure 19. Time histories of
 $Y/D$
,
$Y/D$
,
 $C_{L}$
and
$C_{L}$
and
 $f_{osc}/f_{n}$
in the transition process for (a,c,e) case I and (b,d,f) case II. The dashed lines in (a) and (b) enclose the
$f_{osc}/f_{n}$
in the transition process for (a,c,e) case I and (b,d,f) case II. The dashed lines in (a) and (b) enclose the
 $Y/D$
amplitude and those in (e) and (f) denote the trend of
$Y/D$
amplitude and those in (e) and (f) denote the trend of
 $f_{osc}/f_{n}$
. The dashed red lines in (c) and (d) are 20 Hz low-pass-filtered
$f_{osc}/f_{n}$
. The dashed red lines in (c) and (d) are 20 Hz low-pass-filtered
 $C_{L}$
.
$C_{L}$
.
We next explore how the vibration is generated or how the vibration amplitude grows based on the signals of
 $Y/D$
,
$Y/D$
,
 $C_{L}$
, low-pass-filtered
$C_{L}$
, low-pass-filtered
 $C_{L}$
at a cut-off frequency of 20 Hz and
$C_{L}$
at a cut-off frequency of 20 Hz and
 $f_{osc}/f_{n}$
in the transition stage of
$f_{osc}/f_{n}$
in the transition stage of
 $t=8{-}11~\text{s}$
for case I and
$t=8{-}11~\text{s}$
for case I and
 $t=1{-}3~\text{s}$
for case II (figure 19). The
$t=1{-}3~\text{s}$
for case II (figure 19). The
 $f_{osc}/f_{n}$
in each cycle is simply estimated from the cylinder displacement of one peak to the next, i.e. one oscillation period (
$f_{osc}/f_{n}$
in each cycle is simply estimated from the cylinder displacement of one peak to the next, i.e. one oscillation period (
 $T$
) and
$T$
) and
 $f_{osc}=1/T$
. The sampling frequency of the
$f_{osc}=1/T$
. The sampling frequency of the
 $Y/D$
signal is 654 Hz, corresponding to an uncertainty in
$Y/D$
signal is 654 Hz, corresponding to an uncertainty in
 $f_{osc}$
of
$f_{osc}$
of
 $\pm 0.0156f_{n}$
. The
$\pm 0.0156f_{n}$
. The
 $Y/D$
signal is first 20 Hz low-pass-filtered before estimating
$Y/D$
signal is first 20 Hz low-pass-filtered before estimating
 $T$
so that the peaks may be identified with reasonable accuracy. In case I,
$T$
so that the peaks may be identified with reasonable accuracy. In case I,
 $Y/D$
over
$Y/D$
over
 $t=8{-}8.4~\text{s}$
experiences largely a sinusoidal variation with some minor high-frequency fluctuations due to the natural vortex shedding (refer to the inset of figure 19
a). However,
$t=8{-}8.4~\text{s}$
experiences largely a sinusoidal variation with some minor high-frequency fluctuations due to the natural vortex shedding (refer to the inset of figure 19
a). However,
 $C_{L}$
fluctuates largely at the natural shedding frequency, which is much higher than the predominant frequency in
$C_{L}$
fluctuates largely at the natural shedding frequency, which is much higher than the predominant frequency in
 $Y/D$
. The
$Y/D$
. The
 $C_{L}$
fluctuation at the cylinder oscillation frequency or the filtered
$C_{L}$
fluctuation at the cylinder oscillation frequency or the filtered
 $C_{L}$
(figure 19
c) is negligibly small at
$C_{L}$
(figure 19
c) is negligibly small at
 $t<8.4~\text{s}$
and starts to grow at
$t<8.4~\text{s}$
and starts to grow at
 $t\approx 8.4~\text{s}$
where the
$t\approx 8.4~\text{s}$
where the
 $C_{L}$
fluctuation at the shedding frequency is largest. At
$C_{L}$
fluctuation at the shedding frequency is largest. At
 $t>8.4~\text{s}$
, the
$t>8.4~\text{s}$
, the
 $C_{L}$
fluctuation decays at the shedding frequency but grows at the oscillation frequency. The observation is interesting, suggesting that the vibration may be initiated by natural vortex shedding. At
$C_{L}$
fluctuation decays at the shedding frequency but grows at the oscillation frequency. The observation is interesting, suggesting that the vibration may be initiated by natural vortex shedding. At
 $t=9.0{-}9.4~\text{s}$
where
$t=9.0{-}9.4~\text{s}$
where
 $Y/D$
grows rapidly in amplitude, the high-frequency fluctuation in
$Y/D$
grows rapidly in amplitude, the high-frequency fluctuation in
 $C_{L}$
still exists, along with the low-frequency fluctuation. At
$C_{L}$
still exists, along with the low-frequency fluctuation. At
 $t>9.4~\text{s}$
where
$t>9.4~\text{s}$
where
 $Y/D$
continues to grow in amplitude, the low-frequency fluctuation in
$Y/D$
continues to grow in amplitude, the low-frequency fluctuation in
 $C_{L}$
becomes dominant, overwhelming the high-frequency fluctuation. As discussed before, the
$C_{L}$
becomes dominant, overwhelming the high-frequency fluctuation. As discussed before, the
 $C_{L}$
amplitude associated with the cylinder vibration frequency grows up to
$C_{L}$
amplitude associated with the cylinder vibration frequency grows up to
 $t\approx 9.8~\text{s}$
and then dwindles, its maximum occurring at
$t\approx 9.8~\text{s}$
and then dwindles, its maximum occurring at
 $t\approx 9.8~\text{s}$
. The
$t\approx 9.8~\text{s}$
. The
 $Y/D$
increases rapidly in amplitude over
$Y/D$
increases rapidly in amplitude over
 $t=8.4{-}9.8~\text{s}$
with a positive curvature (amplitude traced by the dashed line) and weakly with a negative curvature. Note that the curvature discussed here is based on the upper dashed line. Therefore, the durations of
$t=8.4{-}9.8~\text{s}$
with a positive curvature (amplitude traced by the dashed line) and weakly with a negative curvature. Note that the curvature discussed here is based on the upper dashed line. Therefore, the durations of
 $t=8.4{-}9.8~\text{s}$
and
$t=8.4{-}9.8~\text{s}$
and
 $t>9.8~\text{s}$
are referred to as the initial and late transitions, respectively.
$t>9.8~\text{s}$
are referred to as the initial and late transitions, respectively.

Figure 20. Power spectral density functions (a)
 $E_{Y}$
of
$E_{Y}$
of
 $Y$
and (b)
$Y$
and (b)
 $E_{CL}$
of
$E_{CL}$
of
 $C_{L}$
over different durations of time during the transition process for case I.
$C_{L}$
over different durations of time during the transition process for case I.
It is interesting to find out whether the cylinder oscillation frequency varies in the transition stage. As shown in figure 19(e),
 $f_{osc}/f_{n}$
jumps from 1.09 to approximately 1.3 at
$f_{osc}/f_{n}$
jumps from 1.09 to approximately 1.3 at
 $t=8.4~\text{s}$
where the vibration is initiated, then declines up to
$t=8.4~\text{s}$
where the vibration is initiated, then declines up to
 $t=9.8~\text{s}$
. At
$t=9.8~\text{s}$
. At
 $t>9.8~\text{s}$
,
$t>9.8~\text{s}$
,
 $f_{osc}/f_{n}$
varies little, slightly larger than 1. The duration of
$f_{osc}/f_{n}$
varies little, slightly larger than 1. The duration of
 $t=8.0{-}8.4~\text{s}$
where
$t=8.0{-}8.4~\text{s}$
where
 $f_{osc}/f_{n}$
rises quickly is referred to as the pre-initial transition. Figure 20 presents the power spectra of
$f_{osc}/f_{n}$
rises quickly is referred to as the pre-initial transition. Figure 20 presents the power spectra of
 $Y/D$
and
$Y/D$
and
 $C_{L}$
over
$C_{L}$
over
 $t=8{-}8.4~\text{s}$
, 8.4–9.8 s and 9.8–11 s, corresponding to the pre-initial, initial and late transitions, respectively. The
$t=8{-}8.4~\text{s}$
, 8.4–9.8 s and 9.8–11 s, corresponding to the pre-initial, initial and late transitions, respectively. The
 $Y/D$
spectrum over
$Y/D$
spectrum over
 $t=8{-}8.4~\text{s}$
(figure 20
a) displays two pronounced peaks, corresponding to the cylinder oscillation and shedding frequencies, respectively. The magnitude of
$t=8{-}8.4~\text{s}$
(figure 20
a) displays two pronounced peaks, corresponding to the cylinder oscillation and shedding frequencies, respectively. The magnitude of
 $f_{osc}/f_{n}$
is approximately 1.23. The
$f_{osc}/f_{n}$
is approximately 1.23. The
 $C_{L}$
spectrum over the same duration shows only one pronounced peak at the shedding frequency (figure 20
b). In the initial transition (
$C_{L}$
spectrum over the same duration shows only one pronounced peak at the shedding frequency (figure 20
b). In the initial transition (
 $t=8.4{-}9.8~\text{s}$
), the
$t=8.4{-}9.8~\text{s}$
), the
 $Y/D$
spectrum exhibits only one large peak at the cylinder oscillation frequency but the
$Y/D$
spectrum exhibits only one large peak at the cylinder oscillation frequency but the
 $C_{L}$
spectrum shows peaks at both cylinder oscillation and shedding frequencies, the peak at the oscillation frequency being smaller in amplitude than that at
$C_{L}$
spectrum shows peaks at both cylinder oscillation and shedding frequencies, the peak at the oscillation frequency being smaller in amplitude than that at
 $t=8{-}8.4~\text{s}$
(
$t=8{-}8.4~\text{s}$
(
 $f_{osc}/f_{n}=1.08$
). On the other hand, in the late transition
$f_{osc}/f_{n}=1.08$
). On the other hand, in the late transition
 $(t=9.8{-}11~\text{s})$
, the
$(t=9.8{-}11~\text{s})$
, the
 $Y/D$
spectrum indicates that the cylinder oscillates at
$Y/D$
spectrum indicates that the cylinder oscillates at
 $f_{osc}/f_{n}\approx 1$
and the
$f_{osc}/f_{n}\approx 1$
and the
 $C_{L}$
spectrum shows a tiny peak at the shedding frequency (figure 20
a,b). In summary,
$C_{L}$
spectrum shows a tiny peak at the shedding frequency (figure 20
a,b). In summary,
 $f_{osc}/f_{n}$
increases in the pre-initial transition and reaches the maximum at the end of the pre-initial transition. The
$f_{osc}/f_{n}$
increases in the pre-initial transition and reaches the maximum at the end of the pre-initial transition. The
 $f_{osc}/f_{n}$
value decreases in the initial transition and becomes almost constant in the late transition and afterwards. In the free vibration of a single cylinder,
$f_{osc}/f_{n}$
value decreases in the initial transition and becomes almost constant in the late transition and afterwards. In the free vibration of a single cylinder,
 $f_{osc}$
in the lock-in range varies with
$f_{osc}$
in the lock-in range varies with
 $U_{r}$
at small
$U_{r}$
at small
 $m^{\ast }\unicode[STIX]{x1D701}~({<}0.05)$
and low
$m^{\ast }\unicode[STIX]{x1D701}~({<}0.05)$
and low
 $m^{\ast }~({<}10)$
, and may deviate greatly from
$m^{\ast }~({<}10)$
, and may deviate greatly from
 $f_{n}$
(Khalak & Williamson Reference Khalak and Williamson1999), while
$f_{n}$
(Khalak & Williamson Reference Khalak and Williamson1999), while
 $f_{osc}/f_{n}\approx 1$
at large mass ratios, i.e.
$f_{osc}/f_{n}\approx 1$
at large mass ratios, i.e.
 $m^{\ast }>100$
(Govardhan & Williamson Reference Govardhan and Williamson2000). Govardhan & Williamson (Reference Govardhan and Williamson2000) identified the initial, upper and lower branches in the VE regime for a single cylinder at small
$m^{\ast }>100$
(Govardhan & Williamson Reference Govardhan and Williamson2000). Govardhan & Williamson (Reference Govardhan and Williamson2000) identified the initial, upper and lower branches in the VE regime for a single cylinder at small
 $m^{\ast }\unicode[STIX]{x1D701}~(=0.0013)$
, and then obtained an expression for the vibration frequency in the lower branch, which takes into account the added mass ratio
$m^{\ast }\unicode[STIX]{x1D701}~(=0.0013)$
, and then obtained an expression for the vibration frequency in the lower branch, which takes into account the added mass ratio
 $m_{a}^{\ast }$
and is valid in the case of low
$m_{a}^{\ast }$
and is valid in the case of low
 $m^{\ast }\unicode[STIX]{x1D701}$
. Mittal & Kumar (Reference Mittal and Kumar2001) also noted the departure between
$m^{\ast }\unicode[STIX]{x1D701}$
. Mittal & Kumar (Reference Mittal and Kumar2001) also noted the departure between
 $f_{osc}$
and
$f_{osc}$
and
 $f_{n}$
for two tandem cylinders in cross-flow with
$f_{n}$
for two tandem cylinders in cross-flow with
 $m^{\ast }=1.5$
and
$m^{\ast }=1.5$
and
 $m^{\ast }\unicode[STIX]{x1D701}=0.00051$
. However, the present large
$m^{\ast }\unicode[STIX]{x1D701}=0.00051$
. However, the present large
 $m^{\ast }~(=275)$
and
$m^{\ast }~(=275)$
and
 $m^{\ast }\unicode[STIX]{x1D701}~(=0.58)$
result in
$m^{\ast }\unicode[STIX]{x1D701}~(=0.58)$
result in
 $f_{osc}/f_{n}\approx 1$
in a steady-state vibration (figure 19) for all
$f_{osc}/f_{n}\approx 1$
in a steady-state vibration (figure 19) for all
 $U_{r}$
examined. Therefore, the dependence of
$U_{r}$
examined. Therefore, the dependence of
 $f_{osc}/f_{n}$
on
$f_{osc}/f_{n}$
on
 $U_{r}$
is not presented.
$U_{r}$
is not presented.
The same observation is made for case II, where the pre-initial, initial and late transitions correspond to
 $t=1{-}1.4~\text{s}$
,
$t=1{-}1.4~\text{s}$
,
 $t=1.4{-}1.8~\text{s}$
and
$t=1.4{-}1.8~\text{s}$
and
 $t>1.8~\text{s}$
, respectively. It may be concluded that natural vortex shedding is a predominant excitation source of the cylinder vibration in the pre-initial transition and initiates the vibration. However, both vortex shedding and fluctuating lift at
$t>1.8~\text{s}$
, respectively. It may be concluded that natural vortex shedding is a predominant excitation source of the cylinder vibration in the pre-initial transition and initiates the vibration. However, both vortex shedding and fluctuating lift at
 $f_{osc}/f_{n}$
make important contributions to the cylinder vibration in the initial transition; yet it is the latter that is largely responsible for the vibration in the late transition. In the previous section, it has been demonstrated that in the stable vibration the gap shear layers interact vigorously with the vibrating downstream cylinder. It is now clear that in the transitional process the pre-initial transition is characterized by an interaction between natural vortex shedding and the cylinder; the gap shear layer joins the interaction between natural vortex shedding in the initial transition. However, the late transition is dominated by the interaction between the gap shear layer and the cylinder, which persists in the stable vibration.
$f_{osc}/f_{n}$
make important contributions to the cylinder vibration in the initial transition; yet it is the latter that is largely responsible for the vibration in the late transition. In the previous section, it has been demonstrated that in the stable vibration the gap shear layers interact vigorously with the vibrating downstream cylinder. It is now clear that in the transitional process the pre-initial transition is characterized by an interaction between natural vortex shedding and the cylinder; the gap shear layer joins the interaction between natural vortex shedding in the initial transition. However, the late transition is dominated by the interaction between the gap shear layer and the cylinder, which persists in the stable vibration.
3.5.2 Energy transfer and added mass
The roles of
 $\unicode[STIX]{x1D719}$
,
$\unicode[STIX]{x1D719}$
,
 $W_{f}$
and
$W_{f}$
and
 $m_{a}^{\ast }$
in the transition need to be clarified. The amplitude of the filtered
$m_{a}^{\ast }$
in the transition need to be clarified. The amplitude of the filtered
 $C_{L}$
is rather irregular and less sinusoidal in the first half
$C_{L}$
is rather irregular and less sinusoidal in the first half
 $(t=8.4{-}9.0~\text{s})$
of the initial transition (figure 19
c) but becomes sinusoidal in the second half
$(t=8.4{-}9.0~\text{s})$
of the initial transition (figure 19
c) but becomes sinusoidal in the second half
 $(t>9.0~\text{s})$
. Similarly, in case II, the filtered
$(t>9.0~\text{s})$
. Similarly, in case II, the filtered
 $C_{L}$
is sinusoidal at
$C_{L}$
is sinusoidal at
 $t>1.4~\text{s}$
when the initial transition starts. In the following discussion, the starting time is made at
$t>1.4~\text{s}$
when the initial transition starts. In the following discussion, the starting time is made at
 $t=9.0~\text{s}$
for case I and
$t=9.0~\text{s}$
for case I and
 $t=1.4~\text{s}$
for case II. Figure 21 shows the signals of
$t=1.4~\text{s}$
for case II. Figure 21 shows the signals of
 $Y_{0}/D$
,
$Y_{0}/D$
,
 $C_{L0}$
,
$C_{L0}$
,
 $\unicode[STIX]{x1D719}$
and
$\unicode[STIX]{x1D719}$
and
 $f_{osc}/f_{n}$
for the two cases, where
$f_{osc}/f_{n}$
for the two cases, where
 $C_{L0}$
is the amplitude of the filtered
$C_{L0}$
is the amplitude of the filtered
 $C_{L}$
in each cycle. In case I,
$C_{L}$
in each cycle. In case I,
 $C_{L0}$
grows rapidly in the initial transition and approaches its maximum at
$C_{L0}$
grows rapidly in the initial transition and approaches its maximum at
 $t=9.8~\text{s}$
at which
$t=9.8~\text{s}$
at which
 $Y_{0}/D=0.32$
. In the same duration,
$Y_{0}/D=0.32$
. In the same duration,
 $\unicode[STIX]{x1D719}$
increases from approximately
$\unicode[STIX]{x1D719}$
increases from approximately
 $90^{\circ }$
to
$90^{\circ }$
to
 $134^{\circ }$
but
$134^{\circ }$
but
 $f_{osc}/f_{n}$
decreases monotonically from 1.09 to 1.01, both maintaining essentially a constant value at
$f_{osc}/f_{n}$
decreases monotonically from 1.09 to 1.01, both maintaining essentially a constant value at
 $t>11~\text{s}$
(figure 21
c,e). The changes in
$t>11~\text{s}$
(figure 21
c,e). The changes in
 $\unicode[STIX]{x1D719}$
and
$\unicode[STIX]{x1D719}$
and
 $f_{osc}/f_{n}$
in the initial transition are largely connected to the gradual replacement of natural vortex shedding by the gap shear layers in the interaction with the downstream cylinder. In the late transition
$f_{osc}/f_{n}$
in the initial transition are largely connected to the gradual replacement of natural vortex shedding by the gap shear layers in the interaction with the downstream cylinder. In the late transition
 $(t=9.8{-}11~\text{s})$
,
$(t=9.8{-}11~\text{s})$
,
 $C_{L0}$
retreats to approximately 1.1 with small variations in
$C_{L0}$
retreats to approximately 1.1 with small variations in
 $\unicode[STIX]{x1D719}$
and
$\unicode[STIX]{x1D719}$
and
 $f_{osc}/f_{n}$
, whilst
$f_{osc}/f_{n}$
, whilst
 $Y_{0}/D$
is augmented to 0.48. A similar observation is made for case II (figure 21
b,d,f).
$Y_{0}/D$
is augmented to 0.48. A similar observation is made for case II (figure 21
b,d,f).

Figure 21. Time histories of
 $Y_{0}/D$
,
$Y_{0}/D$
,
 $C_{L0}$
,
$C_{L0}$
,
 $\unicode[STIX]{x1D719}$
and
$\unicode[STIX]{x1D719}$
and
 $f_{osc}/f_{n}$
for (a,c,e) case I and (b,d,f) case II.
$f_{osc}/f_{n}$
for (a,c,e) case I and (b,d,f) case II.
The values of
 $W_{f}$
,
$W_{f}$
,
 $W_{d}$
and
$W_{d}$
and
 $W_{t}$
(
$W_{t}$
(
 $=W_{f}+W_{d}$
) vary at different instants and are calculated over one period for cases I and II (figure 22
a,b). The
$=W_{f}+W_{d}$
) vary at different instants and are calculated over one period for cases I and II (figure 22
a,b). The
 $W_{f}$
and
$W_{f}$
and
 $W_{d}$
values rise and decline, respectively, in the initial and late transitions and show no change after the late transition. On the other hand,
$W_{d}$
values rise and decline, respectively, in the initial and late transitions and show no change after the late transition. On the other hand,
 $W_{t}$
grows rapidly in the initial transition, reaching a maximum before declining in the late transition. A value
$W_{t}$
grows rapidly in the initial transition, reaching a maximum before declining in the late transition. A value
 $W_{t}>0$
means
$W_{t}>0$
means
 $W_{f}>W_{d}$
, i.e. the energy transferred from the fluid to the cylinder is larger than the energy dissipated through structural damping. Therefore,
$W_{f}>W_{d}$
, i.e. the energy transferred from the fluid to the cylinder is larger than the energy dissipated through structural damping. Therefore,
 $W_{t}>0$
implies that there is an excess of energy used to enlarge
$W_{t}>0$
implies that there is an excess of energy used to enlarge
 $Y_{0}/D$
. Naturally, the growth in
$Y_{0}/D$
. Naturally, the growth in
 $W_{t}$
in the initial transition is accompanied by a rise in
$W_{t}$
in the initial transition is accompanied by a rise in
 $Y_{0}/D$
. In the late transition, the slowdown in the
$Y_{0}/D$
. In the late transition, the slowdown in the
 $Y_{0}/D$
growth is associated with a decline in
$Y_{0}/D$
growth is associated with a decline in
 $W_{t}$
. Once
$W_{t}$
. Once
 $W_{t}\approx 0$
,
$W_{t}\approx 0$
,
 $Y_{0}/D$
becomes constant. Both
$Y_{0}/D$
becomes constant. Both
 $W_{f}$
and
$W_{f}$
and
 $W_{d}$
depend on
$W_{d}$
depend on
 $Y_{0}/D$
, as is evident in figure 22(c,d), where
$Y_{0}/D$
, as is evident in figure 22(c,d), where
 $-W_{d}$
is shown to make clear the difference between
$-W_{d}$
is shown to make clear the difference between
 $W_{f}$
and
$W_{f}$
and
 $W_{d}$
. The difference between
$W_{d}$
. The difference between
 $W_{f}$
and
$W_{f}$
and
 $W_{d}$
grows from
$W_{d}$
grows from
 $Y_{0}/D=0$
to 0.32 and then tapers off, essentially collapsing together at
$Y_{0}/D=0$
to 0.32 and then tapers off, essentially collapsing together at
 $Y_{0}/D\approx 0.48$
.
$Y_{0}/D\approx 0.48$
.

Figure 22. Time histories of
 $W_{f}$
,
$W_{f}$
,
 $W_{d}$
,
$W_{d}$
,
 $W_{t}$
and
$W_{t}$
and
 $Y_{0}/D$
in each period during the transition for (a) case I and (b) case II. Variations in
$Y_{0}/D$
in each period during the transition for (a) case I and (b) case II. Variations in
 $W_{f}$
and
$W_{f}$
and
 $W_{d}$
with increase in
$W_{d}$
with increase in
 $Y_{0}/D$
for (c) case I and (d) case II. Dashed lines are the least-squares curve fit to a second-order polynomial.
$Y_{0}/D$
for (c) case I and (d) case II. Dashed lines are the least-squares curve fit to a second-order polynomial.
Finally, let us turn our attention to
 $m_{a}^{\ast }$
and
$m_{a}^{\ast }$
and
 $\unicode[STIX]{x1D701}_{a}$
. In case I, the vortex shedding frequency was detected in both
$\unicode[STIX]{x1D701}_{a}$
. In case I, the vortex shedding frequency was detected in both
 $Y/D$
and
$Y/D$
and
 $C_{L}$
in the pre-initial transition over
$C_{L}$
in the pre-initial transition over
 $t=8{-}8.4~\text{s}$
(figure 20). Then,
$t=8{-}8.4~\text{s}$
(figure 20). Then,
 $m_{a}^{\ast }$
and
$m_{a}^{\ast }$
and
 $\unicode[STIX]{x1D701}_{a}$
are calculated based on the shedding frequency in the pre-initial transition but on the structural vibration for the rest of the transition. Interestingly, both
$\unicode[STIX]{x1D701}_{a}$
are calculated based on the shedding frequency in the pre-initial transition but on the structural vibration for the rest of the transition. Interestingly, both
 $m_{a}^{\ast }$
and
$m_{a}^{\ast }$
and
 $\unicode[STIX]{x1D701}_{a}$
(figure 23) are initially positive at
$\unicode[STIX]{x1D701}_{a}$
(figure 23) are initially positive at
 $t=8~\text{s}$
and then drop rapidly in the pre-initial transition. It seems plausible that the vibration is initiated by negative
$t=8~\text{s}$
and then drop rapidly in the pre-initial transition. It seems plausible that the vibration is initiated by negative
 $m_{a}^{\ast }$
and
$m_{a}^{\ast }$
and
 $\unicode[STIX]{x1D701}_{a}$
, i.e. vortex shedding contributes to the initiation of the structural vibration. At
$\unicode[STIX]{x1D701}_{a}$
, i.e. vortex shedding contributes to the initiation of the structural vibration. At
 $t=8.4~\text{s}{-}9.0~\text{s}$
, both
$t=8.4~\text{s}{-}9.0~\text{s}$
, both
 $m_{a}^{\ast }$
and
$m_{a}^{\ast }$
and
 $\unicode[STIX]{x1D701}_{a}$
cannot be determined as discussed in § 3.5.1. At
$\unicode[STIX]{x1D701}_{a}$
cannot be determined as discussed in § 3.5.1. At
 $t>9.0~\text{s}$
, both
$t>9.0~\text{s}$
, both
 $m_{a}^{\ast }$
and
$m_{a}^{\ast }$
and
 $\unicode[STIX]{x1D701}_{a}$
are highly negative, showing a rapid rise from
$\unicode[STIX]{x1D701}_{a}$
are highly negative, showing a rapid rise from
 $-105$
to
$-105$
to
 $-58$
and from
$-58$
and from
 $-0.26$
to
$-0.26$
to
 $-0.07$
, respectively, in the initial transition and then a mild growth in the late transition. Their values go up in the stable vibration state to
$-0.07$
, respectively, in the initial transition and then a mild growth in the late transition. Their values go up in the stable vibration state to
 $m_{a}^{\ast }\approx -47$
and
$m_{a}^{\ast }\approx -47$
and
 $\unicode[STIX]{x1D701}_{a}\approx -0.043$
, which is equal in magnitude to the structural damping, i.e.
$\unicode[STIX]{x1D701}_{a}\approx -0.043$
, which is equal in magnitude to the structural damping, i.e.
 $\unicode[STIX]{x1D701}_{a}+\unicode[STIX]{x1D701}=0$
(figure 23
c). A similar observation is made in case II (figure 23
b,d). It may be concluded that, during the growth of vibration, an effective damping ratio of the fluid–cylinder system is negative, i.e.
$\unicode[STIX]{x1D701}_{a}+\unicode[STIX]{x1D701}=0$
(figure 23
c). A similar observation is made in case II (figure 23
b,d). It may be concluded that, during the growth of vibration, an effective damping ratio of the fluid–cylinder system is negative, i.e.
 $\unicode[STIX]{x1D701}+\unicode[STIX]{x1D701}_{a}<0$
, resulting in an exponential growth in the vibration amplitude, while this effective damping ratio is zero, i.e.
$\unicode[STIX]{x1D701}+\unicode[STIX]{x1D701}_{a}<0$
, resulting in an exponential growth in the vibration amplitude, while this effective damping ratio is zero, i.e.
 $\unicode[STIX]{x1D701}+\unicode[STIX]{x1D701}_{a}=0$
, at the stable vibration state.
$\unicode[STIX]{x1D701}+\unicode[STIX]{x1D701}_{a}=0$
, at the stable vibration state.

Figure 23. Time histories of
 $m_{a}^{\ast }$
and
$m_{a}^{\ast }$
and
 $\unicode[STIX]{x1D701}_{a}$
for (a,c) case I and (b,d) case II.
$\unicode[STIX]{x1D701}_{a}$
for (a,c) case I and (b,d) case II.
Following (3.4) and (3.5), a stable vibration for
 $c=0$
(undamped) leads to
$c=0$
(undamped) leads to
 $\unicode[STIX]{x1D719}$
 $=0^{\circ }$
or
$=0^{\circ }$
or
 $180^{\circ }$
and hence
$180^{\circ }$
and hence
 $c_{a}=0$
(3.8). As such, for an undamped cylinder,
$c_{a}=0$
(3.8). As such, for an undamped cylinder,
 $\unicode[STIX]{x1D719}$
is found to be
$\unicode[STIX]{x1D719}$
is found to be
 $0^{\circ }$
for the initial branch (Govardhan & Williamson Reference Govardhan and Williamson2000; Prasanth & Mittal Reference Prasanth and Mittal2008) and
$0^{\circ }$
for the initial branch (Govardhan & Williamson Reference Govardhan and Williamson2000; Prasanth & Mittal Reference Prasanth and Mittal2008) and
 $180^{\circ }$
for the upper and lower branches in the lock-in regime;
$180^{\circ }$
for the upper and lower branches in the lock-in regime;
 $\unicode[STIX]{x1D719}$
is discontinuous between the initial and upper branches (Prasanth & Mittal Reference Prasanth and Mittal2008). For these values of
$\unicode[STIX]{x1D719}$
is discontinuous between the initial and upper branches (Prasanth & Mittal Reference Prasanth and Mittal2008). For these values of
 $\unicode[STIX]{x1D719}$
, (3.4) yields
$\unicode[STIX]{x1D719}$
, (3.4) yields
 $W_{f}=0$
, which is consistent with our intuition.
$W_{f}=0$
, which is consistent with our intuition.
4 Conclusions
A systematic experimental investigation is performed on the flow-induced vibration of a cylinder in the wake of an upstream stationary cylinder of different diameters. The parameters examined include
 $d/D~(=0.2{-}1.0)$
,
$d/D~(=0.2{-}1.0)$
,
 $L/d~(=1.0{-}5.5)$
and
$L/d~(=1.0{-}5.5)$
and
 $U_{r}~(=3.8{-}44)$
. The investigation covers three aspects, i.e. the dependence of violent structural vibration on
$U_{r}~(=3.8{-}44)$
. The investigation covers three aspects, i.e. the dependence of violent structural vibration on
 $d/D$
and
$d/D$
and
 $L/d$
, the flow physics or mechanisms behind the violent vibration, and the initiation of the vibration, leading to the following conclusions.
$L/d$
, the flow physics or mechanisms behind the violent vibration, and the initiation of the vibration, leading to the following conclusions.
Six flow regimes are identified, and their dependences on
 $d/D$
and
$d/D$
and
 $L/d$
are given in figure 5. Regime I corresponds to the occurrence of a violent vibration on the downstream cylinder, which is the focus of this study. There is little or no vibration in the other regimes, which are distinguished based on the relationship between the frequencies
$L/d$
are given in figure 5. Regime I corresponds to the occurrence of a violent vibration on the downstream cylinder, which is the focus of this study. There is little or no vibration in the other regimes, which are distinguished based on the relationship between the frequencies
 $f_{v1}$
and
$f_{v1}$
and
 $f_{v2}$
of vortex shedding from the upstream and downstream cylinders, respectively. In regime II, flow reattachment occurs, and
$f_{v2}$
of vortex shedding from the upstream and downstream cylinders, respectively. In regime II, flow reattachment occurs, and
 $f_{v2}=f_{v1}$
. A pronounced peak also occurs at 2
$f_{v2}=f_{v1}$
. A pronounced peak also occurs at 2
 $f_{v2}$
in
$f_{v2}$
in
 $E_{u2}$
. The flow is bistable in regime III, where
$E_{u2}$
. The flow is bistable in regime III, where
 $f_{v2}$
may or may not be the same as
$f_{v2}$
may or may not be the same as
 $f_{v1}$
, depending on
$f_{v1}$
, depending on
 $d/D$
. The other three regimes are all characterized by vortex co-shedding from the two cylinders, though
$d/D$
. The other three regimes are all characterized by vortex co-shedding from the two cylinders, though
 $f_{v2}=f_{v1}$
in regime IV,
$f_{v2}=f_{v1}$
in regime IV,
 $f_{v2}=f_{v1}$
but a pronounced peak occurs at 0.5
$f_{v2}=f_{v1}$
but a pronounced peak occurs at 0.5
 $f_{v2}$
in
$f_{v2}$
in
 $E_{u2}$
in regime V, and
$E_{u2}$
in regime V, and
 $f_{v2}\neq f_{v1}$
in regime VI.
$f_{v2}\neq f_{v1}$
in regime VI.
The dependence of the violent cylinder vibration on
 $d/D$
and
$d/D$
and
 $L/d$
in regime I is characterized by an increase in
$L/d$
in regime I is characterized by an increase in
 $L/d$
leading to a decrease in
$L/d$
leading to a decrease in
 $d/D$
and also a reduced range of
$d/D$
and also a reduced range of
 $d/D$
(figure 5). At a small
$d/D$
(figure 5). At a small
 $d/D$
, the upstream cylinder wake is narrow and the shear layer is prone to switching its direction from one side to the other, thus exciting the downstream cylinder and causing a violent vibration. The downstream cylinder may be excited at a small incident angle, associated with small
$d/D$
, the upstream cylinder wake is narrow and the shear layer is prone to switching its direction from one side to the other, thus exciting the downstream cylinder and causing a violent vibration. The downstream cylinder may be excited at a small incident angle, associated with small
 $d/D$
, given a large
$d/D$
, given a large
 $L/d$
. The violent cylinder vibration is primarily connected to the lift force induced by the switching gap shear layers from one side to the other of the downstream cylinder, as is evidenced by the synchronization of the switching frequency and the cylinder oscillation frequency. A hysteresis phenomenon has been found during the cycle of the cylinder vibration; the phase-averaged vorticity contours and pressure distribution around the cylinder from
$L/d$
. The violent cylinder vibration is primarily connected to the lift force induced by the switching gap shear layers from one side to the other of the downstream cylinder, as is evidenced by the synchronization of the switching frequency and the cylinder oscillation frequency. A hysteresis phenomenon has been found during the cycle of the cylinder vibration; the phase-averaged vorticity contours and pressure distribution around the cylinder from
 $Y/D=0$
to
$Y/D=0$
to
 $Y_{0}/D$
(figure 9
a–c, figure 13
a–c) display considerable differences from their counterparts from
$Y_{0}/D$
(figure 9
a–c, figure 13
a–c) display considerable differences from their counterparts from
 $Y/D=Y_{0}/D$
to 0 (figure 9
c–e, figure 13
c–e). The result implies a phase lag between
$Y/D=Y_{0}/D$
to 0 (figure 9
c–e, figure 13
c–e). The result implies a phase lag between
 $C_{L}$
and
$C_{L}$
and
 $Y/D$
. This phase lag is physically connected to the nonlinear flow-induced damping.
$Y/D$
. This phase lag is physically connected to the nonlinear flow-induced damping.
When the cylinder vibrates violently, two predominant frequencies are identified in the spectra of
 $u_{2}$
captured behind the cylinders, which are associated with natural vortex shedding and the cylinder vibration at
$u_{2}$
captured behind the cylinders, which are associated with natural vortex shedding and the cylinder vibration at
 $f_{osc}$
, respectively. Two types of vortices are generated during the cylinder vibration. The first type is induced by the gap shear layers impinging on the downstream cylinder; the vortices occur in general about the centreline and decay rapidly. The second originates from the shear layer separation when the downstream cylinder is at its maximum displacement; being far away from the centreline, the vortices persist downstream and dominate the wake. When the first type of vortex is generated, the work done is positive, that is, the cylinder absorbs energy from the flow, resulting in a sustainable vibration. On the other hand, the work done is negative during the generation of the second type, which acts to weaken the vibration.
$f_{osc}$
, respectively. Two types of vortices are generated during the cylinder vibration. The first type is induced by the gap shear layers impinging on the downstream cylinder; the vortices occur in general about the centreline and decay rapidly. The second originates from the shear layer separation when the downstream cylinder is at its maximum displacement; being far away from the centreline, the vortices persist downstream and dominate the wake. When the first type of vortex is generated, the work done is positive, that is, the cylinder absorbs energy from the flow, resulting in a sustainable vibration. On the other hand, the work done is negative during the generation of the second type, which acts to weaken the vibration.
How the structural vibration is initiated is unveiled. Two scenarios are examined. Firstly, the flow is increased continuously from
 $U_{r}=0$
to a value corresponding to a violent vibration and the cylinder is allowed to vibrate freely. Secondly, given a flow that is adequate to produce a large-amplitude vibration, the cylinder is fixed initially at both ends and then suddenly released for transverse free vibration, from
$U_{r}=0$
to a value corresponding to a violent vibration and the cylinder is allowed to vibrate freely. Secondly, given a flow that is adequate to produce a large-amplitude vibration, the cylinder is fixed initially at both ends and then suddenly released for transverse free vibration, from
 $Y_{0}/D=0$
to its stable vibration. In both cases,
$Y_{0}/D=0$
to its stable vibration. In both cases,
 $Y_{0}/D$
grows from zero to its stable value. The transition or growth process is characterized by three stages. In the pre-initial stage,
$Y_{0}/D$
grows from zero to its stable value. The transition or growth process is characterized by three stages. In the pre-initial stage,
 $Y_{0}/D$
is very small and
$Y_{0}/D$
is very small and
 $C_{L}$
is dominated by the fluctuation at the vortex shedding frequency. Meanwhile, the added damping and added mass decline and hence
$C_{L}$
is dominated by the fluctuation at the vortex shedding frequency. Meanwhile, the added damping and added mass decline and hence
 $f_{osc}/f_{n}$
grows gradually. The corresponding
$f_{osc}/f_{n}$
grows gradually. The corresponding
 $W_{t}$
is small. In the initial transition stage,
$W_{t}$
is small. In the initial transition stage,
 $Y_{0}/D$
grows rapidly, accompanied by an exponential rise in both
$Y_{0}/D$
grows rapidly, accompanied by an exponential rise in both
 $C_{L}$
and
$C_{L}$
and
 $\unicode[STIX]{x1D719}$
. Meanwhile,
$\unicode[STIX]{x1D719}$
. Meanwhile,
 $f_{osc}/f_{n}$
drops since both added damping and added mass go up. Thus,
$f_{osc}/f_{n}$
drops since both added damping and added mass go up. Thus,
 $W_{t}$
increases rapidly, reaching its maximum at the end of this stage. In the late transition stage, the growth in
$W_{t}$
increases rapidly, reaching its maximum at the end of this stage. In the late transition stage, the growth in
 $Y_{0}/D$
slows down and
$Y_{0}/D$
slows down and
 $C_{L}$
decreases, while both
$C_{L}$
decreases, while both
 $\unicode[STIX]{x1D701}_{a}$
and
$\unicode[STIX]{x1D701}_{a}$
and
 $m_{a}^{\ast }$
keep rising, albeit very slowly, resulting in a reduced
$m_{a}^{\ast }$
keep rising, albeit very slowly, resulting in a reduced
 $f_{osc}/f_{n}$
. The slowdown in the growing
$f_{osc}/f_{n}$
. The slowdown in the growing
 $Y_{0}/D$
is associated with a drop in
$Y_{0}/D$
is associated with a drop in
 $W_{t}$
, which is almost zero as
$W_{t}$
, which is almost zero as
 $Y_{0}/D$
approaches a constant value. It has been found that natural vortex shedding initiates the cylinder vibration in the pre-initial transition, though both vortex shedding and the gap shear layer switching are responsible for a rapid growth in vibration in the initial transition. Yet, it is the gap shear layer switching that accounts for the sustainable violent vibration in the late transition.
$Y_{0}/D$
approaches a constant value. It has been found that natural vortex shedding initiates the cylinder vibration in the pre-initial transition, though both vortex shedding and the gap shear layer switching are responsible for a rapid growth in vibration in the initial transition. Yet, it is the gap shear layer switching that accounts for the sustainable violent vibration in the late transition.
Acknowledgements
M.M.A. wishes to acknowledge the support given to the authors by the National Natural Science Foundation of China through grant 11672096 and by the Research Grant Council of Shenzhen Government through grant JCYJ20160531191442288.
Nomenclature
-
$A$
-
root-mean-square (r.m.s.) value of vibration response multiplied by
$\sqrt{2}$
-
$\unicode[STIX]{x1D701}$
-
structural damping
-
$\unicode[STIX]{x1D701}_{a}$
-
added damping
-
$C_{L}$
-
lift force coefficient
-
$C_{L0}$
-
the amplitude of lift force coefficient
-
$C_{L\,rms}$
-
fluctuating (r.m.s.) lift coefficient
-
$C_{P}$
-
pressure coefficient
-
$d$
-
upstream cylinder diameter
-
$D$
-
downstream cylinder diameter
-
$f$
-
frequency
-
$f_{n}$
-
natural frequency of the cylinder system
-
$f_{osc}$
-
cylinder oscillation frequency
-
$f_{v}$
-
vortex shedding frequency
-
$f_{v1}$
-
vortex shedding frequency in the gap of the cylinders
-
$f_{v2}(f_{v2}^{\prime })$
-
vortex shedding frequency behind the cylinders
-
$F$
-
fluid force in the transverse direction
-
$F_{L0}$
-
amplitude of fluid force
-
$k$
-
spring stiffness
-
$l$
-
length of the cylinder
-
$L$
-
spacing between the centre of the upstream cylinder to the forward stagnation point of the downstream cylinder
-
$m$
-
cylinder mass
-
$m_{a}$
-
added mass
-
$m_{a}^{\ast }$
-
added mass ratio
-
$m^{\ast }$
-
mass ratio
$(=4m/(\unicode[STIX]{x03C0}\unicode[STIX]{x1D70C}D^{2}l))$
-
$St$
-
Strouhal number
-
$U_{\infty }$
-
free-stream velocity
-
$U_{r}$
-
reduced velocity
$(=U_{\infty }/f_{n}D)$
-
$\text{VE}$
-
vortex excitation
-
$W_{f}$
-
energy transferred from the fluid to the cylinder motion, over one cycle of oscillation
-
$W_{d}$
-
energy dissipated by the structural damping over one cycle of oscillation
-
$W_{t}$
-
total energy transfer
$(=W_{f}+W_{d})$
-
$Y$
-
cylinder displacement
-
$Y_{0}$
-
maximum amplitude of oscillation
-
$\unicode[STIX]{x1D714}$
-
angular frequency
$(=2\unicode[STIX]{x03C0}f_{osc})$
-
$\unicode[STIX]{x1D70C}$
-
density of fluid
-
$\unicode[STIX]{x1D6FF}$
-
logarithmic decrement of amplitudes
-
$\unicode[STIX]{x1D719}$
-
phase lag between fluid force and cylinder displacement
-
$(x,y,z)$
-
coordinate with the origin at the downstream cylinder centre
-
$(x^{\prime },y^{\prime },z^{\prime })$
-
coordinate with the origin at the upstream cylinder centre