1 Introduction
Regarding the flow of dilute suspensions of neutrally buoyant spherical particles through circular tubes
 ${\sim}11~\text{mm}$
in diameter, Segré & Silberberg (Reference Segré and Silberberg1961, Reference Segré and Silberberg1962) first reported the inertial migration of suspended particles across streamlines towards an equilibrium radial position at a distance of approximately 0.6 times the tube radius from the tube axis. This phenomenon is called the tubular pinch effect or the Segré–Silberberg (SS) effect, and the particle-focusing annulus is called the SS annulus. This pioneering work was followed by numerous experimental and theoretical studies. Among them, Asmolov (Reference Asmolov1999) extended the matched asymptotic approach of Schonberg & Hinch (Reference Schonberg and Hinch1989) for a spherical particle in a plane Poiseuille flow to higher Reynolds numbers (
${\sim}11~\text{mm}$
in diameter, Segré & Silberberg (Reference Segré and Silberberg1961, Reference Segré and Silberberg1962) first reported the inertial migration of suspended particles across streamlines towards an equilibrium radial position at a distance of approximately 0.6 times the tube radius from the tube axis. This phenomenon is called the tubular pinch effect or the Segré–Silberberg (SS) effect, and the particle-focusing annulus is called the SS annulus. This pioneering work was followed by numerous experimental and theoretical studies. Among them, Asmolov (Reference Asmolov1999) extended the matched asymptotic approach of Schonberg & Hinch (Reference Schonberg and Hinch1989) for a spherical particle in a plane Poiseuille flow to higher Reynolds numbers (
 $Re$
) up to 1500 and predicted the outward shift of the equilibrium position with the increase of
$Re$
) up to 1500 and predicted the outward shift of the equilibrium position with the increase of
 $Re$
. Later, Matas, Morris & Guazzelli (Reference Matas, Morris and Guazzelli2004) (henceforth referred to as MMG) performed experiments using circular tubes 8 mm in diameter to measure the cross-sectional distribution of neutrally buoyant spherical particles in dilute suspensions at a distance of
$Re$
. Later, Matas, Morris & Guazzelli (Reference Matas, Morris and Guazzelli2004) (henceforth referred to as MMG) performed experiments using circular tubes 8 mm in diameter to measure the cross-sectional distribution of neutrally buoyant spherical particles in dilute suspensions at a distance of
 ${\sim}310$
times the tube diameter from the tube inlet. They confirmed the outward shift of the SS annulus with
${\sim}310$
times the tube diameter from the tube inlet. They confirmed the outward shift of the SS annulus with
 $Re$
in a wide
$Re$
in a wide
 $Re$
range of 67–1700 for various particle-to-tube diameter ratios of 0.024–0.125. Here, the Reynolds number is defined as
$Re$
range of 67–1700 for various particle-to-tube diameter ratios of 0.024–0.125. Here, the Reynolds number is defined as
 $Re=DU/\unicode[STIX]{x1D708}$
, where
$Re=DU/\unicode[STIX]{x1D708}$
, where
 $D$
represents the tube diameter,
$D$
represents the tube diameter,
 $U$
represents the average flow velocity, and
$U$
represents the average flow velocity, and
 $\unicode[STIX]{x1D708}$
represents the kinematic viscosity of the fluid.
$\unicode[STIX]{x1D708}$
represents the kinematic viscosity of the fluid.
MMG reported a remarkable finding: the emergence of another accumulation annulus of particles closer to the tube axis for
 $Re>600$
. They called this annulus ‘the inner annulus’ and reported that the inner annulus is significantly broader than the SS annulus and that the majority of the particles lie on this inner annulus for
$Re>600$
. They called this annulus ‘the inner annulus’ and reported that the inner annulus is significantly broader than the SS annulus and that the majority of the particles lie on this inner annulus for
 $Re>700$
. Because theoretical analyses based on the matched asymptotic expansion for plane channel flow predict the presence of only one equilibrium position, MMG raised the question of whether the inner annulus is a real equilibrium position at which the lateral force on the particle vanishes. They considered two possible reasons for the discrepancy between the theory and the experiment: differences in the flow geometry (plane channel flow versus circular tube flow) and differences in the particle size (point particles versus finite-sized particles). In the theory, small particle size (
$Re>700$
. Because theoretical analyses based on the matched asymptotic expansion for plane channel flow predict the presence of only one equilibrium position, MMG raised the question of whether the inner annulus is a real equilibrium position at which the lateral force on the particle vanishes. They considered two possible reasons for the discrepancy between the theory and the experiment: differences in the flow geometry (plane channel flow versus circular tube flow) and differences in the particle size (point particles versus finite-sized particles). In the theory, small particle size (
 $d/D\ll 1$
) and low particle Reynolds number (
$d/D\ll 1$
) and low particle Reynolds number (
 $Re_{p}\ll 1$
) are assumed, where
$Re_{p}\ll 1$
) are assumed, where
 $d$
represents the particle diameter and the particle Reynolds number is defined as
$d$
represents the particle diameter and the particle Reynolds number is defined as
 $Re_{p}=Re(d/D)^{2}$
. With regard to the first issue, Matas, Morris & Guazzelli (Reference Matas, Morris and Guazzelli2009) applied matched asymptotic analysis to the circular tube flow and found that the predicted force profile on a spherical particle was qualitatively similar to that in a plane channel. Thus, they concluded that the discrepancy is caused by the difference in the particle size and the emergence of the inner annulus is a result of the finite size of the particle in experiments.
$Re_{p}=Re(d/D)^{2}$
. With regard to the first issue, Matas, Morris & Guazzelli (Reference Matas, Morris and Guazzelli2009) applied matched asymptotic analysis to the circular tube flow and found that the predicted force profile on a spherical particle was qualitatively similar to that in a plane channel. Thus, they concluded that the discrepancy is caused by the difference in the particle size and the emergence of the inner annulus is a result of the finite size of the particle in experiments.
In recent macroscale experiments performed in our laboratory, Morita, Itano & Sugihara-Seki (Reference Morita, Itano and Sugihara-Seki2017) (henceforth referred to as MIS) measured the distribution of suspended particles over the tube cross-section located at various distances up to approximately
 $500D$
from the tube inlet for
$500D$
from the tube inlet for
 $d/D\approx 0.08$
. They elucidated the evolution of the particle distribution in the flow direction, confirming the particle focusing towards the SS annulus at low
$d/D\approx 0.08$
. They elucidated the evolution of the particle distribution in the flow direction, confirming the particle focusing towards the SS annulus at low
 $Re$
and the appearance of an additional particle accumulation annulus closer to the tube centre at higher
$Re$
and the appearance of an additional particle accumulation annulus closer to the tube centre at higher
 $Re$
. These results are consistent with the experimental results of MMG. However, they found that when the inner annulus emerges, the fraction of particles on the inner annulus is largest in the most upstream cross-section (
$Re$
. These results are consistent with the experimental results of MMG. However, they found that when the inner annulus emerges, the fraction of particles on the inner annulus is largest in the most upstream cross-section (
 ${\sim}65D$
from the tube inlet), and decreases monotonically in cross-sections farther downstream. The decrease from the most upstream to the most downstream cross-sections (
${\sim}65D$
from the tube inlet), and decreases monotonically in cross-sections farther downstream. The decrease from the most upstream to the most downstream cross-sections (
 ${\sim}65D$
and
${\sim}65D$
and
 ${\sim}500D$
from the tube inlet, respectively) was reported to be nearly 80 % to 0 % at
${\sim}500D$
from the tube inlet, respectively) was reported to be nearly 80 % to 0 % at
 $Re\approx 400$
,
$Re\approx 400$
,
 ${>}90\,\%$
to approximately 30 % at
${>}90\,\%$
to approximately 30 % at
 $Re\approx 600$
, and 100 % to approximately 60 % at
$Re\approx 600$
, and 100 % to approximately 60 % at
 $Re\approx 800$
. Although a large fraction of particles remains on the inner annulus in the most downstream cross-section for
$Re\approx 800$
. Although a large fraction of particles remains on the inner annulus in the most downstream cross-section for
 $Re>600$
, they considered that this particle fraction would continue to decrease if the tube were longer. This consideration came from the experimental finding that the entry length after which radial migration fully developed increased with
$Re>600$
, they considered that this particle fraction would continue to decrease if the tube were longer. This consideration came from the experimental finding that the entry length after which radial migration fully developed increased with
 $Re$
. Thus, they concluded that the inner annulus would disappear if the tube were long enough, for
$Re$
. Thus, they concluded that the inner annulus would disappear if the tube were long enough, for
 $Re<1000$
and
$Re<1000$
and
 $d/D\approx 0.08$
. However, there remained a concern that this upper limit of
$d/D\approx 0.08$
. However, there remained a concern that this upper limit of
 $Re$
may be overestimated, because at
$Re$
may be overestimated, because at
 $Re\approx 1000$
, only a small fraction of particles was observed on the SS annulus with the majority lying on the inner annulus, even in the most downstream cross-section (see figure 11
c).
$Re\approx 1000$
, only a small fraction of particles was observed on the SS annulus with the majority lying on the inner annulus, even in the most downstream cross-section (see figure 11
c).
As an extension of the study of MIS, the present study was aimed at investigating the evolution of the particle distribution in farther-downstream cross-sections until all particles were fully focused on an annulus (or annuli), preferably as sharply as on the SS annulus observed at low
 $Re$
. To this end, we employed significantly smaller tubes several hundreds of micrometres in diameter and several hundred millimetres in length, compared with the macroscale tubes 7.8 mm in diameter used by MIS. By applying the ‘enface’ observation method used by Shichi et al. (Reference Shichi, Yamashita, Seki, Itano and Sugihara-Seki2017) for similar-sized square tubes, we measured the distribution of neutrally buoyant spherical particles suspended in circular tube flows in the
$Re$
. To this end, we employed significantly smaller tubes several hundreds of micrometres in diameter and several hundred millimetres in length, compared with the macroscale tubes 7.8 mm in diameter used by MIS. By applying the ‘enface’ observation method used by Shichi et al. (Reference Shichi, Yamashita, Seki, Itano and Sugihara-Seki2017) for similar-sized square tubes, we measured the distribution of neutrally buoyant spherical particles suspended in circular tube flows in the
 $Re$
range of 100–1000 for the size-ratio (
$Re$
range of 100–1000 for the size-ratio (
 $d/D$
) range of 0.08–0.13 in tube cross-sections located at various distances (up to
$d/D$
) range of 0.08–0.13 in tube cross-sections located at various distances (up to
 $1000D$
) from the tube inlet.
$1000D$
) from the tube inlet.
We found that, at the most downstream cross-section, all the particles were sharply focused on one annulus or two annuli, depending on
 $Re$
. At low
$Re$
. At low
 $Re$
, the particles were focused on the SS annulus, in accordance with previous studies (Segré & Silberberg Reference Segré and Silberberg1962; MMG; MIS). However, for
$Re$
, the particles were focused on the SS annulus, in accordance with previous studies (Segré & Silberberg Reference Segré and Silberberg1962; MMG; MIS). However, for
 $Re$
higher than a certain critical value, the particles were focused on two annuli. For even higher
$Re$
higher than a certain critical value, the particles were focused on two annuli. For even higher
 $Re$
beyond another critical value, the particles were again focused on one annulus. We call these
$Re$
beyond another critical value, the particles were again focused on one annulus. We call these
 $Re$
regimes (A), (B) and (C), respectively.
$Re$
regimes (A), (B) and (C), respectively.
We also performed a numerical simulation corresponding to the experiments via the immersed boundary method (Nakagawa et al. Reference Nakagawa, Yabu, Otomo, Kase, Makino, Itano and Sugihara-Seki2015). The obtained profile of the lateral force exerted on a particle suspended in the circular tube flow accounted well for the present experimental results and confirmed the presence of the three regimes.
This paper is organised as follows. In § 2, the experimental and numerical methods are presented. The experimental and numerical results are presented in § 3. In § 4, we discuss the present results in relation to previous studies, along with the experimental errors.
2 Methods
2.1 Experimental methods
We applied the enface observation method used for submillimetre-sized square tube flows (Shichi et al.
Reference Shichi, Yamashita, Seki, Itano and Sugihara-Seki2017) to circular tube flows. Polystyrene spherical particles with a diameter of
 $d=50{-}80~\unicode[STIX]{x03BC}\text{m}$
(Thermo Scientific) were suspended in a glycerol–water mixture at a volume fraction of
$d=50{-}80~\unicode[STIX]{x03BC}\text{m}$
(Thermo Scientific) were suspended in a glycerol–water mixture at a volume fraction of
 ${\sim}0.001\,\%$
. The density of the solution was matched to that of the particles, i.e.
${\sim}0.001\,\%$
. The density of the solution was matched to that of the particles, i.e.
 $\unicode[STIX]{x1D70C}=(1.049{-}1.050)\times 10^{3}~\text{kg}~\text{m}^{-3}$
, and the viscosity was
$\unicode[STIX]{x1D70C}=(1.049{-}1.050)\times 10^{3}~\text{kg}~\text{m}^{-3}$
, and the viscosity was
 $(1.63{-}1.77)\times 10^{-3}~\text{Pa}~\text{s}$
. The temperature of the solution was monitored using a high-resolution thermistor thermometer (Omega HH42A).
$(1.63{-}1.77)\times 10^{-3}~\text{Pa}~\text{s}$
. The temperature of the solution was monitored using a high-resolution thermistor thermometer (Omega HH42A).
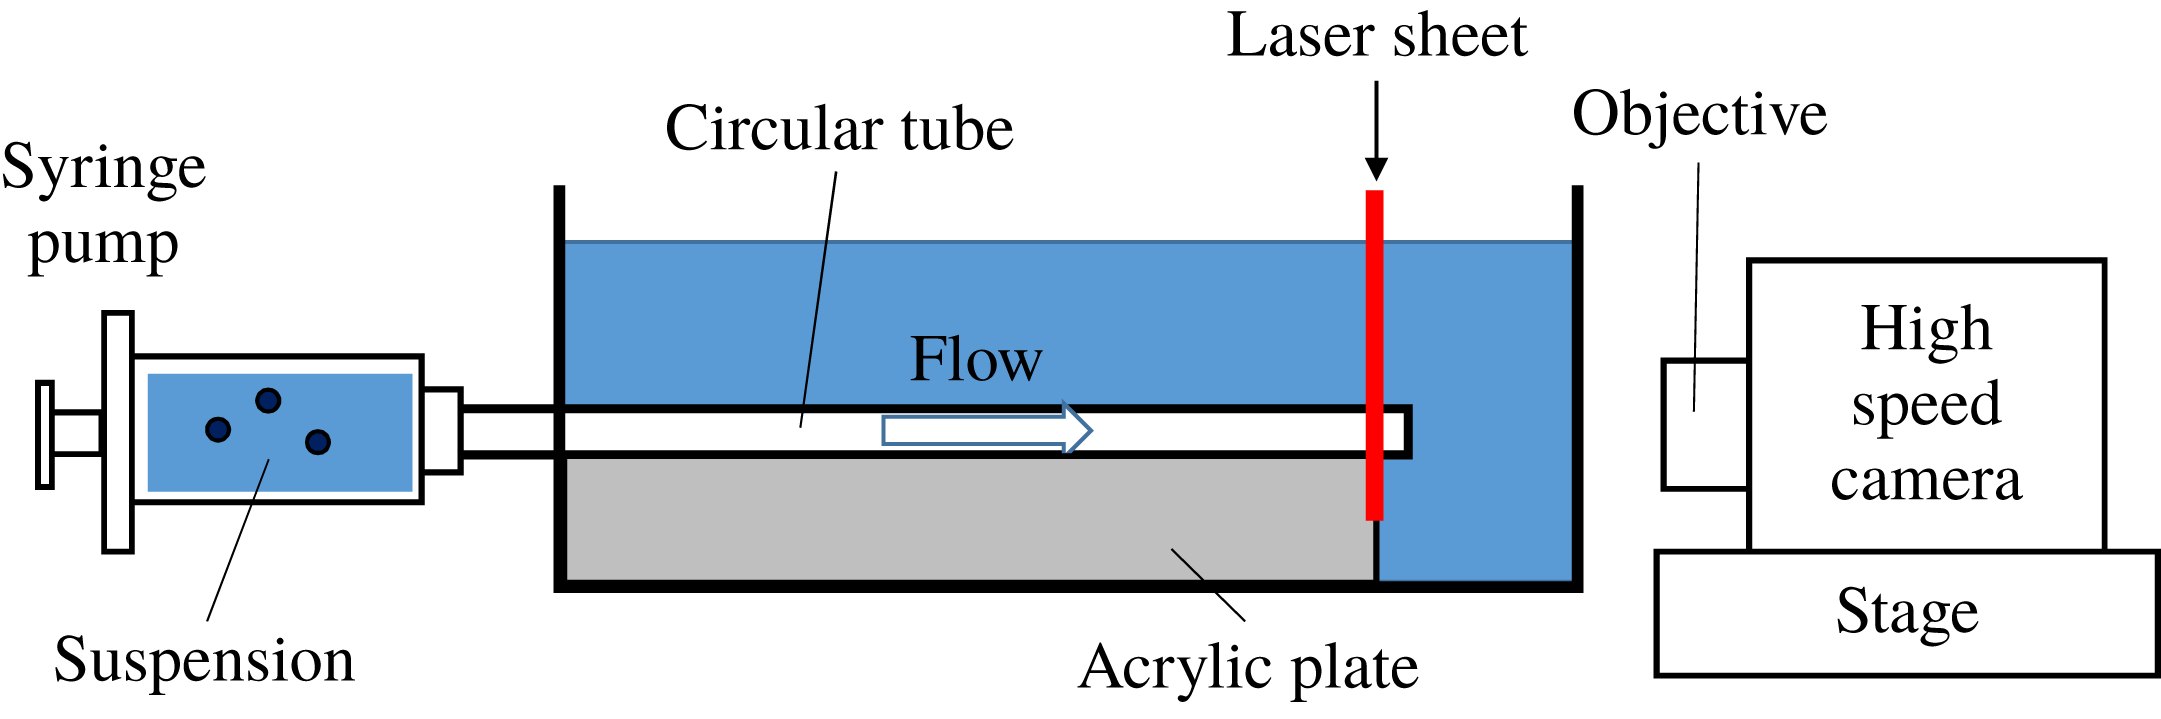
Figure 1. Experimental set-up.
The experimental set-up is shown in figure 1. A circular tube with an inner diameter of
 $D=600~\unicode[STIX]{x03BC}\text{m}$
and a length of
$D=600~\unicode[STIX]{x03BC}\text{m}$
and a length of
 $L=75{-}600~\text{mm}$
(VitroCom) was connected to a stainless steel syringe via a luer fitting with an inner diameter of 1.5 mm (ISIS VRF108). The tube was immersed in the glycerol–water mixture bath and held horizontally. The flow of the particle suspension was driven by a syringe pump (ISIS Nexus 6000) through the circular tube at controlled flow rates. The tube cross-section approximately
$L=75{-}600~\text{mm}$
(VitroCom) was connected to a stainless steel syringe via a luer fitting with an inner diameter of 1.5 mm (ISIS VRF108). The tube was immersed in the glycerol–water mixture bath and held horizontally. The flow of the particle suspension was driven by a syringe pump (ISIS Nexus 6000) through the circular tube at controlled flow rates. The tube cross-section approximately
 $2{-}3~\text{mm}$
upstream from the outlet was illuminated with a laser light sheet produced by a 100 mW optically pumped semiconductor laser (Coherent OBIS640, 640 nm). The cross-section of the tube was imaged from the downstream side along the centre axis of the tube using a high-speed camera (Photron FASTCAM Mini UX50) equipped with a long working distance objective (Olympus MDPlan 5). The frame rate of the camera was set to be 1000–8000 frames per second, depending on the flow velocity, in such a way that the fastest particle in each experiment could be imaged in three or four consecutive frames. This setting made it possible to detect all the particles passing through the focal plane of the objective.
$2{-}3~\text{mm}$
upstream from the outlet was illuminated with a laser light sheet produced by a 100 mW optically pumped semiconductor laser (Coherent OBIS640, 640 nm). The cross-section of the tube was imaged from the downstream side along the centre axis of the tube using a high-speed camera (Photron FASTCAM Mini UX50) equipped with a long working distance objective (Olympus MDPlan 5). The frame rate of the camera was set to be 1000–8000 frames per second, depending on the flow velocity, in such a way that the fastest particle in each experiment could be imaged in three or four consecutive frames. This setting made it possible to detect all the particles passing through the focal plane of the objective.
The obtained images were analysed using the public domain software ImageJ (NIH) to determine the centre positions of the particles in the tube cross-section. By representing each particle centre position as a dot, we obtained the particle distribution over the cross-section, as shown in figures 3 and 5. The pixel size was typically approximately
 $2.09\times 2.09~\unicode[STIX]{x03BC}\text{m}^{2}$
, which determined the accuracy of the measurement.
$2.09\times 2.09~\unicode[STIX]{x03BC}\text{m}^{2}$
, which determined the accuracy of the measurement.
In the present study, the size ratio
 $d/D$
was in the range 0.083–0.133, and
$d/D$
was in the range 0.083–0.133, and
 $Re$
was in the range 100–1000, corresponding to
$Re$
was in the range 100–1000, corresponding to
 $Re_{p}=0.69{-}17.8$
. The ratio of the tube length to the tube diameter
$Re_{p}=0.69{-}17.8$
. The ratio of the tube length to the tube diameter
 $L/D$
was in the range 125–1000. The development length from the tube entrance to reach the Poiseuille flow can be estimated as
$L/D$
was in the range 125–1000. The development length from the tube entrance to reach the Poiseuille flow can be estimated as
 ${\sim}(Re/30)\times D\sim 20~\text{mm}$
for
${\sim}(Re/30)\times D\sim 20~\text{mm}$
for
 $D=600~\unicode[STIX]{x03BC}\text{m}$
at
$D=600~\unicode[STIX]{x03BC}\text{m}$
at
 $Re=1000$
(Tritton Reference Tritton1988). This length is much smaller than the tube length
$Re=1000$
(Tritton Reference Tritton1988). This length is much smaller than the tube length
 $L$
, i.e. the distance of the observation site from the tube entrance. We assumed a random distribution of particles at the tube entrance.
$L$
, i.e. the distance of the observation site from the tube entrance. We assumed a random distribution of particles at the tube entrance.
2.2 Numerical methods
We analysed the lateral force exerted on a neutrally buoyant spherical particle (diameter
 $d$
) immersed in a pressure-driven flow of an incompressible Newtonian fluid through a circular tube (diameter
$d$
) immersed in a pressure-driven flow of an incompressible Newtonian fluid through a circular tube (diameter
 $D$
). The numerical procedure was that used by Nakagawa et al. (Reference Nakagawa, Yabu, Otomo, Kase, Makino, Itano and Sugihara-Seki2015) for a square tube flow. Using the immersed boundary method, we solved the Navier–Stokes equation and the continuity equation via the fractional step method (Kajishima et al.
Reference Kajishima, Takiguchi, Hamasaki and Miyake2001). The only difference from the study of Nakagawa et al. (Reference Nakagawa, Yabu, Otomo, Kase, Makino, Itano and Sugihara-Seki2015) was that we adopted the immersed boundary method at the boundary between the fluid and the tube wall owing to the circular geometry, in the same manner as the boundary between the fluid and the particle. The computational domain had a square cylindrical shape, in which a circular tube was embedded. The periodic boundary condition was applied at the upstream and downstream cross-sections with a given pressure difference.
$D$
). The numerical procedure was that used by Nakagawa et al. (Reference Nakagawa, Yabu, Otomo, Kase, Makino, Itano and Sugihara-Seki2015) for a square tube flow. Using the immersed boundary method, we solved the Navier–Stokes equation and the continuity equation via the fractional step method (Kajishima et al.
Reference Kajishima, Takiguchi, Hamasaki and Miyake2001). The only difference from the study of Nakagawa et al. (Reference Nakagawa, Yabu, Otomo, Kase, Makino, Itano and Sugihara-Seki2015) was that we adopted the immersed boundary method at the boundary between the fluid and the tube wall owing to the circular geometry, in the same manner as the boundary between the fluid and the particle. The computational domain had a square cylindrical shape, in which a circular tube was embedded. The periodic boundary condition was applied at the upstream and downstream cross-sections with a given pressure difference.
The lateral force exerted on a particle was calculated under the condition that the particle moves freely in the main flow direction and rotates freely in all directions but is fixed in the cross-sectional plane. The size of the spatial mesh (
 $0.05d$
) and the axial length of the computational domain (
$0.05d$
) and the axial length of the computational domain (
 $20d$
or
$20d$
or
 $30d$
) were the same as those used by Nakagawa et al. (Reference Nakagawa, Yabu, Otomo, Kase, Makino, Itano and Sugihara-Seki2015). These values were determined according to an accuracy assessment of the numerical computation as described by Nakagawa et al. (Reference Nakagawa, Yabu, Otomo, Kase, Makino, Itano and Sugihara-Seki2015).
$30d$
) were the same as those used by Nakagawa et al. (Reference Nakagawa, Yabu, Otomo, Kase, Makino, Itano and Sugihara-Seki2015). These values were determined according to an accuracy assessment of the numerical computation as described by Nakagawa et al. (Reference Nakagawa, Yabu, Otomo, Kase, Makino, Itano and Sugihara-Seki2015).
As an additional check of the numerical accuracy, the results of the present problem were compared with those of a previous numerical study. Yang et al. (Reference Yang, Wang, Joseph, Hu, Pan and Glowinski2005) analysed a similar problem with two packages (one based on a moving and adaptive grid and another using distributed Lagrange multipliers on a fixed grid) at relatively low
 $Re$
. As shown in figure 2, our results for the lateral-force profile for
$Re$
. As shown in figure 2, our results for the lateral-force profile for
 $d/D=0.15$
at
$d/D=0.15$
at
 $Re=50$
exhibited an excellent agreement with their corresponding results, except for the region adjacent to the tube wall. In figure 2, the horizontal axis
$Re=50$
exhibited an excellent agreement with their corresponding results, except for the region adjacent to the tube wall. In figure 2, the horizontal axis
 $r$
indicates the radial coordinate normalised by the tube radius
$r$
indicates the radial coordinate normalised by the tube radius
 $D/2$
. The relative error of the radial coordinate of the equilibrium position was approximately 1.5 % at
$D/2$
. The relative error of the radial coordinate of the equilibrium position was approximately 1.5 % at
 $Re=100$
for
$Re=100$
for
 $d/D=0.1$
and
$d/D=0.1$
and
 ${<}3\,\%$
at
${<}3\,\%$
at
 $Re=50$
, 100 and 200 for
$Re=50$
, 100 and 200 for
 $d/D=0.15$
.
$d/D=0.15$
.
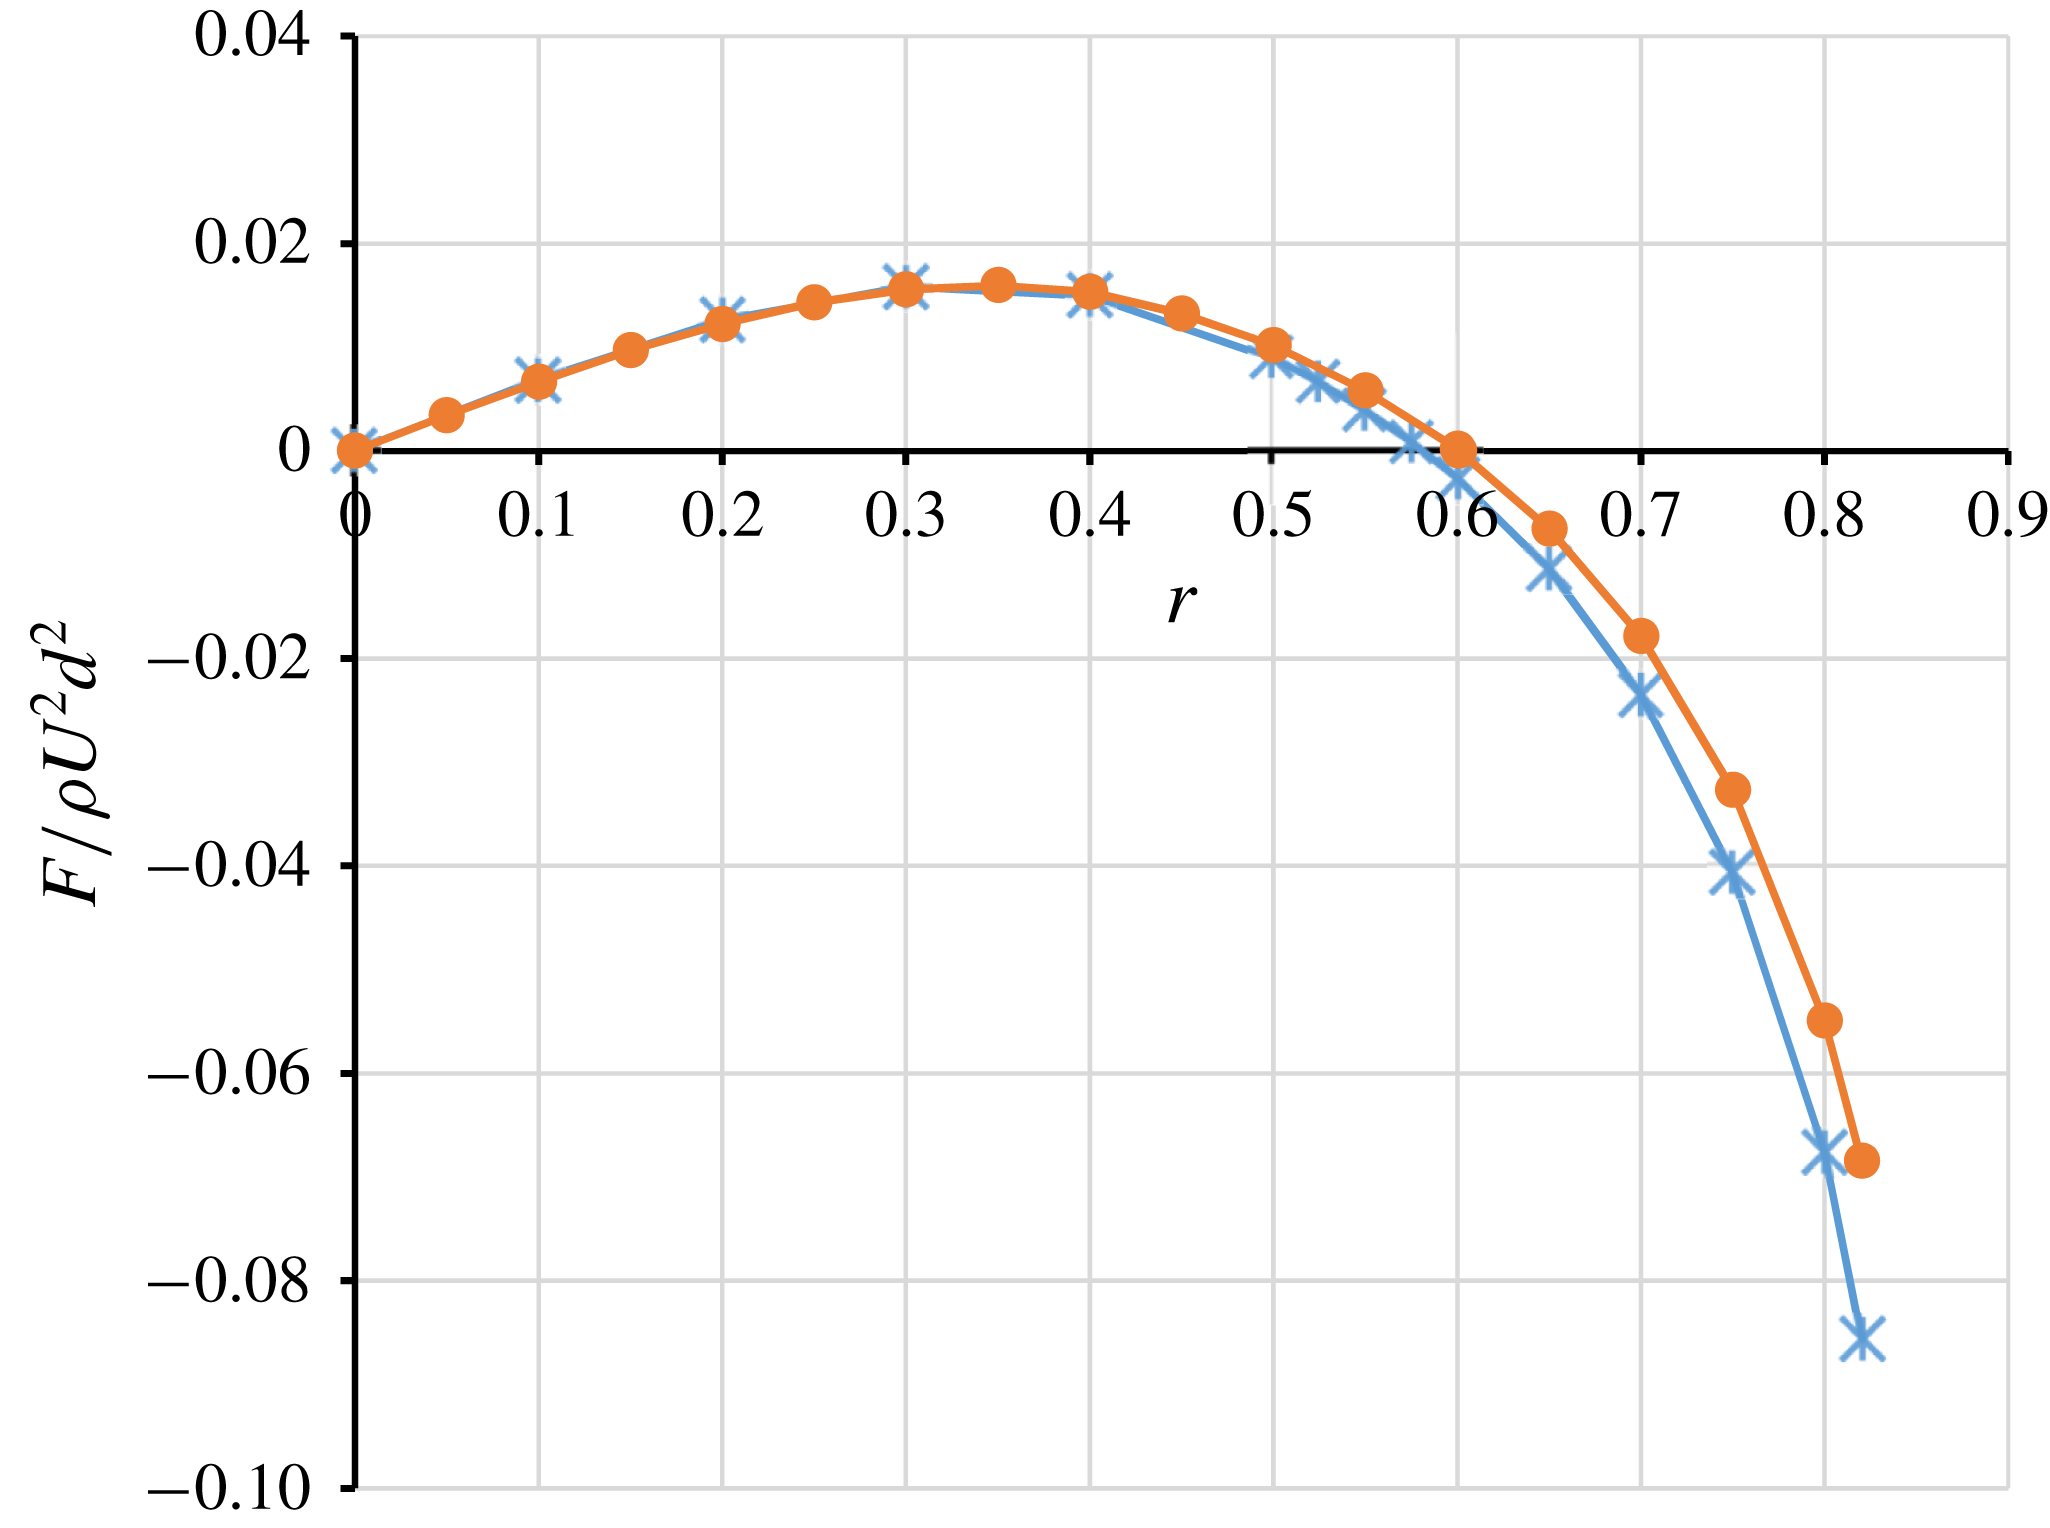
Figure 2. Non-dimensional lateral force exerted on a spherical particle suspended in circular tube flow for
 $d/D=0.15$
and
$d/D=0.15$
and
 $Re=50$
, in the present numerical computation obtained at the computed time
$Re=50$
, in the present numerical computation obtained at the computed time
 $=$
150
$=$
150
 $d/U$
(asterisks) and by Yang et al. (Reference Yang, Wang, Joseph, Hu, Pan and Glowinski2005) (circles).
$d/U$
(asterisks) and by Yang et al. (Reference Yang, Wang, Joseph, Hu, Pan and Glowinski2005) (circles).
Regarding the boundary condition, we also performed computations under a condition of a constant flow rate by adjusting the pressure drop between the upstream and downstream cross-sections in each time step, instead of giving a constant pressure drop. The difference between these two cases was found to be small and its effect on the lateral force was negligible for the present parameter values.
3 Results
3.1 Experimental results
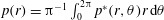
Figure 3 shows representative examples of the distributions of particles in the tube cross-section obtained at various distances from the tube inlet with
 $Re=100{-}700$
and
$Re=100{-}700$
and
 $d/D=0.1$
. Each dot in these figures represents the position of a particle centre. The evolutions of the particle distribution in the flow direction shown in figure 3(a,b) indicate prompt focusing of the particles on an annulus at low
$d/D=0.1$
. Each dot in these figures represents the position of a particle centre. The evolutions of the particle distribution in the flow direction shown in figure 3(a,b) indicate prompt focusing of the particles on an annulus at low
 $Re$
. This annulus was the SS annulus. As
$Re$
. This annulus was the SS annulus. As
 $Re$
increased, the fraction of particles located on the SS annulus in the upstream cross-sections decreased, with more particles located in the inner region. These inner particles appeared to form a broad annulus inside the SS annulus. MMG called this annulus ‘the inner annulus’. They observed the inner annulus at
$Re$
increased, the fraction of particles located on the SS annulus in the upstream cross-sections decreased, with more particles located in the inner region. These inner particles appeared to form a broad annulus inside the SS annulus. MMG called this annulus ‘the inner annulus’. They observed the inner annulus at
 $Re>600$
for
$Re>600$
for
 $d/D=0.06{-}0.11$
and found that it was significantly broader than the SS annulus, with most particles spreading from 0.3 to 0.7 of the tube radius from the tube centre. At the highest
$d/D=0.06{-}0.11$
and found that it was significantly broader than the SS annulus, with most particles spreading from 0.3 to 0.7 of the tube radius from the tube centre. At the highest
 $Re(=700)$
in figure 3, the left-most diagram of figure 3(d) shows that few particles were on the SS annulus, and only the inner annulus was clearly observed. The inner annulus, the remaining diagrams of figure 3(d) indicate that the fraction of particles on the inner annulus decreased farther downstream, accompanying an outward shift of the inner annulus towards the SS annulus and a decrease in its width, until almost all particles were focused on the SS annulus in the most downstream cross-section. Thus, in the range of
$Re(=700)$
in figure 3, the left-most diagram of figure 3(d) shows that few particles were on the SS annulus, and only the inner annulus was clearly observed. The inner annulus, the remaining diagrams of figure 3(d) indicate that the fraction of particles on the inner annulus decreased farther downstream, accompanying an outward shift of the inner annulus towards the SS annulus and a decrease in its width, until almost all particles were focused on the SS annulus in the most downstream cross-section. Thus, in the range of
 $Re$
shown in figure 3, all particles were focused on the SS annulus, and the inner annulus disappeared in the downstream cross-sections. These results agree with the previous experimental study of MIS using macroscale tubes with the size ratio
$Re$
shown in figure 3, all particles were focused on the SS annulus, and the inner annulus disappeared in the downstream cross-sections. These results agree with the previous experimental study of MIS using macroscale tubes with the size ratio
 $d/D\approx 0.08$
. As shown in figure 3, the entry length after which radial migration was fully developed was larger for higher
$d/D\approx 0.08$
. As shown in figure 3, the entry length after which radial migration was fully developed was larger for higher
 $Re$
, in accordance with the results of MIS.
$Re$
, in accordance with the results of MIS.

Figure 3. Particle distributions over the tube cross-section for
 $Re$
values of (a) 100, (b) 300, (c) 600 and (d) 700, with
$Re$
values of (a) 100, (b) 300, (c) 600 and (d) 700, with
 $d/D=0.10$
and
$d/D=0.10$
and
 $L/D=125$
, 250, 500 and 1000.
$L/D=125$
, 250, 500 and 1000.
To clarify the characteristics of the particle distribution, we estimated the probability density function (p.d.f.) by using the obtained data for the particle positions. First, we calculated the radial probability of a particle being detected at
 $r$
, i.e.
$r$
, i.e.
 $P(r)$
, among all the obtained radial positions of particles. Because we observed all the particles passing through the cross-section during each measurement time (at least 300 particles),
$P(r)$
, among all the obtained radial positions of particles. Because we observed all the particles passing through the cross-section during each measurement time (at least 300 particles),
 $P(r)$
represents the radial probability for the particle flux. Here, the suspending fluid is a Newtonian fluid, and the suspension is extremely dilute (volume fraction
$P(r)$
represents the radial probability for the particle flux. Here, the suspending fluid is a Newtonian fluid, and the suspension is extremely dilute (volume fraction
 ${\sim}10^{-5}$
); thus, the fluid is expected to have a Poiseuille velocity profile at the Reynolds numbers considered. Assuming that each particle travels at the same velocity with a Poiseuille flow at the position of the particle centre, we calculated the probability of a particle being located at a radial position
${\sim}10^{-5}$
); thus, the fluid is expected to have a Poiseuille velocity profile at the Reynolds numbers considered. Assuming that each particle travels at the same velocity with a Poiseuille flow at the position of the particle centre, we calculated the probability of a particle being located at a radial position
 $r$
as
$r$
as
 $p(r)=A^{-1}P(r)/(1-r^{2})$
, where
$p(r)=A^{-1}P(r)/(1-r^{2})$
, where
 $A=\int _{0}^{1}P(r)/(1-r^{2})\,\text{d}r$
. Our numerical simulation showed that, in the typical cases considered in this study, a particle located at an equilibrium radial position travels at an axial velocity approximately 3 % lower than the fluid velocity at the particle centre. The p.d.f., i.e.
$A=\int _{0}^{1}P(r)/(1-r^{2})\,\text{d}r$
. Our numerical simulation showed that, in the typical cases considered in this study, a particle located at an equilibrium radial position travels at an axial velocity approximately 3 % lower than the fluid velocity at the particle centre. The p.d.f., i.e.
 $p^{\ast }(r,\unicode[STIX]{x1D703})$
, associated with the probability of a particle being at a radial position
$p^{\ast }(r,\unicode[STIX]{x1D703})$
, associated with the probability of a particle being at a radial position
 $r$
and a given azimuthal angle
$r$
and a given azimuthal angle
 $\unicode[STIX]{x1D703}$
, can be related to
$\unicode[STIX]{x1D703}$
, can be related to
 $p(r)$
by
$p(r)$
by
 $p(r)=\unicode[STIX]{x03C0}^{-1}\int _{0}^{2\unicode[STIX]{x03C0}}p^{\ast }(r,\unicode[STIX]{x1D703})r\,\text{d}\unicode[STIX]{x1D703}$
. Assuming that
$p(r)=\unicode[STIX]{x03C0}^{-1}\int _{0}^{2\unicode[STIX]{x03C0}}p^{\ast }(r,\unicode[STIX]{x1D703})r\,\text{d}\unicode[STIX]{x1D703}$
. Assuming that
 $p^{\ast }$
depends only on
$p^{\ast }$
depends only on
 $r$
, this yields
$r$
, this yields
 $p^{\ast }(r)=p(r)/2r$
(MMG; MIS).
$p^{\ast }(r)=p(r)/2r$
(MMG; MIS).
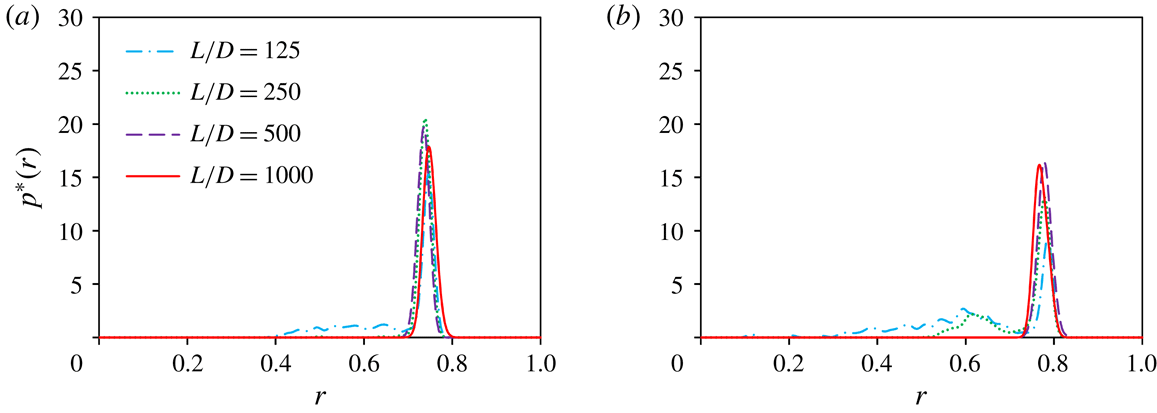
Figure 4 illustrates the
 $p^{\ast }(r)$
extracted from the particle distributions shown in figure 3(b,c). In figure 4(a), the p.d.f.s at various
$p^{\ast }(r)$
extracted from the particle distributions shown in figure 3(b,c). In figure 4(a), the p.d.f.s at various
 $L/D$
values exhibit a sharp peak at a radial position corresponding to the SS annulus, even in the most upstream cross-section at low
$L/D$
values exhibit a sharp peak at a radial position corresponding to the SS annulus, even in the most upstream cross-section at low
 $Re$
, and this position is almost independent of
$Re$
, and this position is almost independent of
 $L/D$
within the measurement error. The p.d.f.s shown in figure 4(b) also exhibit a sharp peak at the SS annulus. The p.d.f.s at
$L/D$
within the measurement error. The p.d.f.s shown in figure 4(b) also exhibit a sharp peak at the SS annulus. The p.d.f.s at
 $L/D=125$
and 250 have a second peak at
$L/D=125$
and 250 have a second peak at
 $r\approx 0.6$
, which corresponds to the inner annulus reported by MMG.
$r\approx 0.6$
, which corresponds to the inner annulus reported by MMG.

Figure 4. P.d.f.
 $p^{\ast }(r)$
for
$p^{\ast }(r)$
for
 $Re$
values of (a) 300 and (b) 600, with
$Re$
values of (a) 300 and (b) 600, with
 $d/D=0.10$
and
$d/D=0.10$
and
 $L/D=125$
, 250, 500 and 1000.
$L/D=125$
, 250, 500 and 1000.
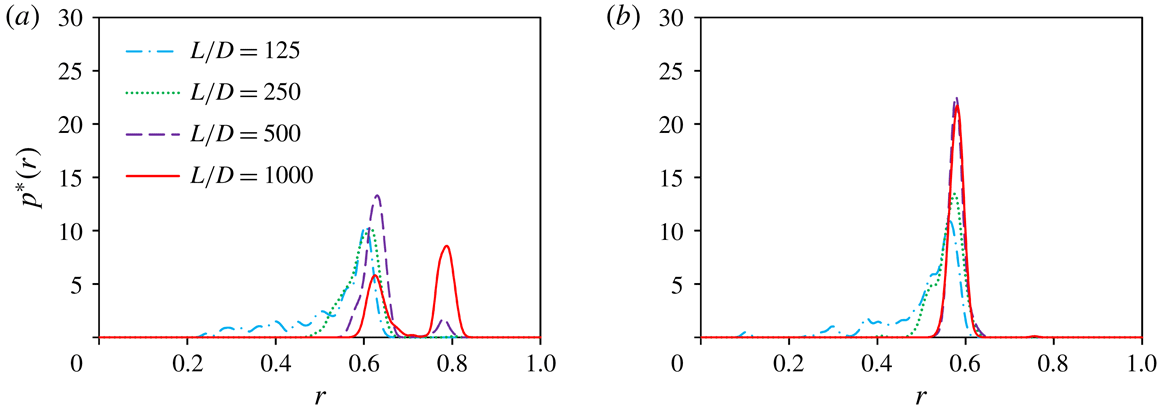
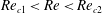
The distributions of the particles at
 $Re>700$
are shown in figure 5, for
$Re>700$
are shown in figure 5, for
 $d/D=0.1$
. The p.d.f.s
$d/D=0.1$
. The p.d.f.s
 $p^{\ast }(r)$
corresponding to figures 5(b) and 5(d) are plotted in figures 6(a) and 6(b), respectively. In contrast to figure 3 (low
$p^{\ast }(r)$
corresponding to figures 5(b) and 5(d) are plotted in figures 6(a) and 6(b), respectively. In contrast to figure 3 (low
 $Re$
), the left-most diagrams of figure 5 show no particles on the SS annulus in the most upstream cross-sections. Instead, the particles are located in the inner region. The absence of the SS annulus at the most upstream cross-section was reported by MIS. In their experiments, the SS annulus was absent in the cross-section at
$Re$
), the left-most diagrams of figure 5 show no particles on the SS annulus in the most upstream cross-sections. Instead, the particles are located in the inner region. The absence of the SS annulus at the most upstream cross-section was reported by MIS. In their experiments, the SS annulus was absent in the cross-section at
 $L/D=65$
for
$L/D=65$
for
 $Re>700$
and
$Re>700$
and
 $d/D\approx 0.08$
. In a downstream cross-section at
$d/D\approx 0.08$
. In a downstream cross-section at
 $L/D\approx 310$
, MMG observed the absence of the SS annulus at high
$L/D\approx 310$
, MMG observed the absence of the SS annulus at high
 $Re$
close to the transition to the intermittency, e.g.
$Re$
close to the transition to the intermittency, e.g.
 $Re=1650$
for
$Re=1650$
for
 $d/D=0.059$
. At these high
$d/D=0.059$
. At these high
 $Re$
, they claimed the possibility that the only equilibrium position could be the inner annulus, not the SS annulus.
$Re$
, they claimed the possibility that the only equilibrium position could be the inner annulus, not the SS annulus.
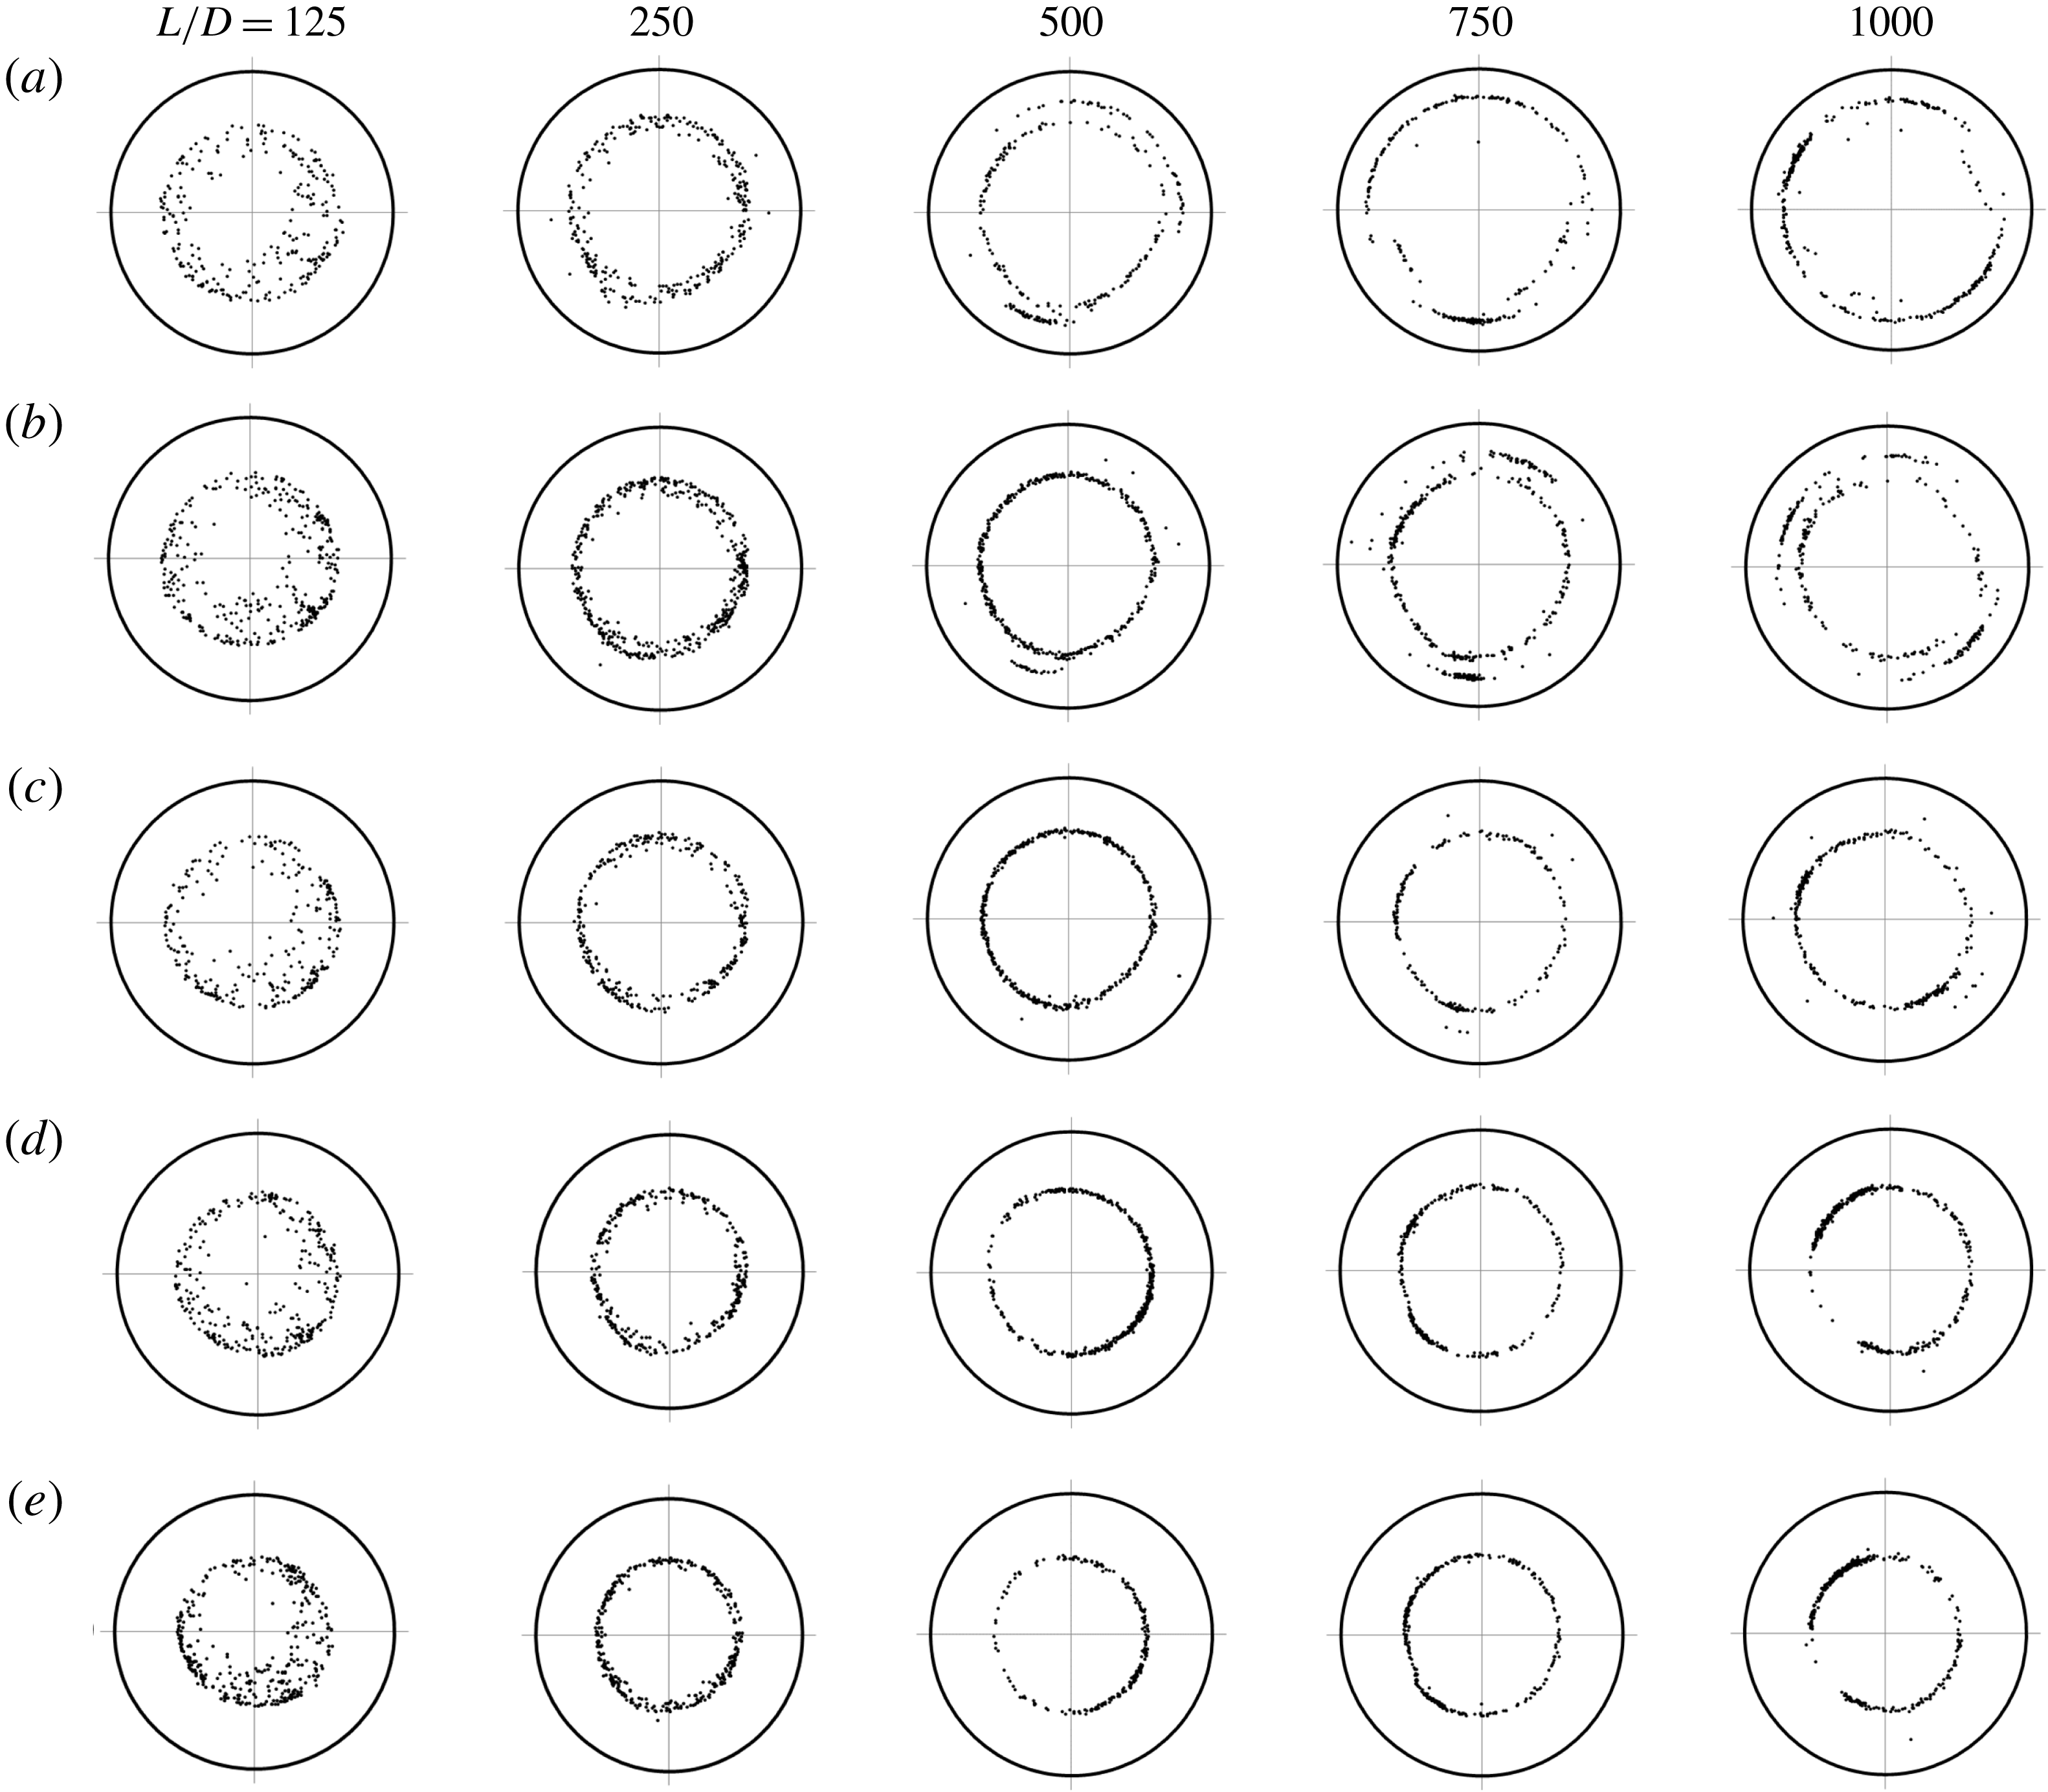
Figure 5. Particle distributions over the tube cross-section for
 $Re$
values of (a) 750, (b) 790, (c) 830, (d) 900 and (e) 1000, with
$Re$
values of (a) 750, (b) 790, (c) 830, (d) 900 and (e) 1000, with
 $d/D=0.10$
and
$d/D=0.10$
and
 $L/D=125$
, 250, 500, 750 and 1000.
$L/D=125$
, 250, 500, 750 and 1000.
The second diagrams from the left in figure 5 show that particles located in the inner region at the upstream cross-section (at
 $L/D=125$
) move outward, forming a thin annulus at
$L/D=125$
) move outward, forming a thin annulus at
 $L/D=250$
. As shown in figure 6, the location of this annulus is close to or slightly outside of the peak position of the p.d.f. in the upstream cross-section at
$L/D=250$
. As shown in figure 6, the location of this annulus is close to or slightly outside of the peak position of the p.d.f. in the upstream cross-section at
 $L/D=125$
. The remaining diagrams of figure 5 show the evolution of the particle distribution in the flow direction, indicating the presence of two types of particle-focusing patterns in this
$L/D=125$
. The remaining diagrams of figure 5 show the evolution of the particle distribution in the flow direction, indicating the presence of two types of particle-focusing patterns in this
 $Re$
range. Two annuli are observed at the most downstream cross-sections in figure 5(a–c), whereas only one annulus is observed in figure 5(d,e). We call the
$Re$
range. Two annuli are observed at the most downstream cross-sections in figure 5(a–c), whereas only one annulus is observed in figure 5(d,e). We call the
 $Re$
regime in figure 3 ‘regime (A)’, where particles are focused on the SS annulus. Figure 5 indicates the presence of two additional regimes for the particle-focusing pattern observed in the most downstream cross-section. In the regime of lower
$Re$
regime in figure 3 ‘regime (A)’, where particles are focused on the SS annulus. Figure 5 indicates the presence of two additional regimes for the particle-focusing pattern observed in the most downstream cross-section. In the regime of lower
 $Re$
, particles are focused on two annuli, as shown in figure 5(a–c) (regime (B)), whereas in the regime of higher
$Re$
, particles are focused on two annuli, as shown in figure 5(a–c) (regime (B)), whereas in the regime of higher
 $Re$
, particles are focused on one annulus, as shown in figure 5(d,e) (regime (C)).
$Re$
, particles are focused on one annulus, as shown in figure 5(d,e) (regime (C)).

Figure 6. P.d.f.
 $p^{\ast }(r)$
at
$p^{\ast }(r)$
at
 $Re$
values of (a) 790 and (b) 900, with
$Re$
values of (a) 790 and (b) 900, with
 $d/D=0.10$
and
$d/D=0.10$
and
 $L/D=125$
, 250, 500 and 1000.
$L/D=125$
, 250, 500 and 1000.
In regime (B), the particle distributions in figure 5(a–c) suggest that particles located in the inner region of the upstream cross-section move outward, accumulating on an annulus, and then some of them continue moving towards the tube wall until they reach another annulus. The p.d.f.s at various
 $L/D$
values shown in figure 6(a) support such a process. In these figures, the outer annulus is more clearly observed, i.e. more particles are located on the outer annulus, at lower
$L/D$
values shown in figure 6(a) support such a process. In these figures, the outer annulus is more clearly observed, i.e. more particles are located on the outer annulus, at lower
 $Re$
. On the other hand, in regime (C) shown in figure 5(d,e), only one annulus is observed, regardless of the observation site. In both regimes, as shown in figure 6(a,b), the particle distributions are sharply peaked on the focusing annuli, and their radial positions are nearly constant, independent of
$Re$
. On the other hand, in regime (C) shown in figure 5(d,e), only one annulus is observed, regardless of the observation site. In both regimes, as shown in figure 6(a,b), the particle distributions are sharply peaked on the focusing annuli, and their radial positions are nearly constant, independent of
 $L/D$
. These properties differ from the broad inner annulus observed at low
$L/D$
. These properties differ from the broad inner annulus observed at low
 $Re$
in regime (A).
$Re$
in regime (A).
In figure 7, the measured radii of the particle-focusing annuli in regimes (A), (B) and (C) are indicated by circles, squares and triangles, respectively, for
 $d/D=0.1$
. In regime (A), the particles are focused on the SS annulus (closed circles). The closed squares, which indicate the radii of the outer annulus in regime (B), lie on the extension of the closed circles; thus, the outer annulus in regime (B) corresponds to the SS annulus. On the other hand, the open squares, which indicate the radii of the other (inner) annulus in regime (B), and open triangles, which indicate the radii of the annulus in regime (C), lie on a single line. In the present study, we call the annulus located closer to the tube centre ‘the inner annulus’, although it differs from the broad accumulation of particles observed at low
$d/D=0.1$
. In regime (A), the particles are focused on the SS annulus (closed circles). The closed squares, which indicate the radii of the outer annulus in regime (B), lie on the extension of the closed circles; thus, the outer annulus in regime (B) corresponds to the SS annulus. On the other hand, the open squares, which indicate the radii of the other (inner) annulus in regime (B), and open triangles, which indicate the radii of the annulus in regime (C), lie on a single line. In the present study, we call the annulus located closer to the tube centre ‘the inner annulus’, although it differs from the broad accumulation of particles observed at low
 $Re$
. The particle-focusing patterns in the most downstream cross-section are summarised as follows: the particles are focused on the SS annulus in regime (A), on the SS annulus and the inner annulus in regime (B) and on the inner annulus in regime (C).
$Re$
. The particle-focusing patterns in the most downstream cross-section are summarised as follows: the particles are focused on the SS annulus in regime (A), on the SS annulus and the inner annulus in regime (B) and on the inner annulus in regime (C).
Figure 7. Radii of the particle-focusing annuli for
 $d/D=0.1$
and
$d/D=0.1$
and
 $L/D=1000$
, in regime (A) (circles), regime (B) (squares), and regime (C) (triangles). The closed symbols represent the radius of the SS annulus,
$L/D=1000$
, in regime (A) (circles), regime (B) (squares), and regime (C) (triangles). The closed symbols represent the radius of the SS annulus,
 $r_{s}$
, and the open symbols represent the radius of the inner annulus,
$r_{s}$
, and the open symbols represent the radius of the inner annulus,
 $r_{i}$
. Numerical results for the stable and unstable equilibrium positions are indicated by solid and dotted lines, respectively. Previous experimental results are indicated by diamonds (MIS for
$r_{i}$
. Numerical results for the stable and unstable equilibrium positions are indicated by solid and dotted lines, respectively. Previous experimental results are indicated by diamonds (MIS for
 $d/D=0.11$
at
$d/D=0.11$
at
 $L/D=250$
), crosses and plus signs (MMG for
$L/D=250$
), crosses and plus signs (MMG for
 $d/D=0.095$
and 0.11 at
$d/D=0.095$
and 0.11 at
 $L/D=313$
) and asterisks (Segré & Silberberg (Reference Segré and Silberberg1962) for
$L/D=313$
) and asterisks (Segré & Silberberg (Reference Segré and Silberberg1962) for
 $d/D=0.11$
at
$d/D=0.11$
at
 $L/D=214$
). The dashed line represents the numerical results of Yang et al. (Reference Yang, Wang, Joseph, Hu, Pan and Glowinski2005) for
$L/D=214$
). The dashed line represents the numerical results of Yang et al. (Reference Yang, Wang, Joseph, Hu, Pan and Glowinski2005) for
 $d/D=0.1$
.
$d/D=0.1$
.
We express the radius of the SS annulus as
 $r_{s}$
and that of the inner annulus as
$r_{s}$
and that of the inner annulus as
 $r_{i}$
. For comparison, the values of
$r_{i}$
. For comparison, the values of
 $r_{s}$
obtained in previous experiments with similar size ratios are plotted in figure 7. Previous numerical results for
$r_{s}$
obtained in previous experiments with similar size ratios are plotted in figure 7. Previous numerical results for
 $r_{s}$
with
$r_{s}$
with
 $d/D=0.1$
are also plotted. Additionally, the values of
$d/D=0.1$
are also plotted. Additionally, the values of
 $r_{i}$
obtained by MIS for
$r_{i}$
obtained by MIS for
 $d/D=0.11$
at
$d/D=0.11$
at
 $L/D=250$
are plotted, although in their study, the term ‘the inner annulus’ referred to both the transient accumulation of particles observed at low
$L/D=250$
are plotted, although in their study, the term ‘the inner annulus’ referred to both the transient accumulation of particles observed at low
 $Re$
as well as particle focusing observed at high
$Re$
as well as particle focusing observed at high
 $Re$
. The present results for
$Re$
. The present results for
 $r_{s}$
and
$r_{s}$
and
 $r_{i}$
agree well with the results of the previous studies. The inner annulus
$r_{i}$
agree well with the results of the previous studies. The inner annulus
 $r_{i}$
appeared at lower
$r_{i}$
appeared at lower
 $Re$
in the study of MIS than in the present study because at
$Re$
in the study of MIS than in the present study because at
 $L/D=250$
, the transient accumulation of particles closer to the tube centre was observed in regime (A), as shown in the second diagrams from the left in figure 3(c,d). The most significant difference between the present study and previous macroscale experiments may be that we did not observe the SS annulus at
$L/D=250$
, the transient accumulation of particles closer to the tube centre was observed in regime (A), as shown in the second diagrams from the left in figure 3(c,d). The most significant difference between the present study and previous macroscale experiments may be that we did not observe the SS annulus at
 $Re>850$
for
$Re>850$
for
 $d/D=0.10$
, whereas MMG observed the SS annulus even beyond
$d/D=0.10$
, whereas MMG observed the SS annulus even beyond
 $Re=1000$
for comparable
$Re=1000$
for comparable
 $d/D$
. In particular, they reported the presence of the SS annulus up to
$d/D$
. In particular, they reported the presence of the SS annulus up to
 $Re\approx 1200$
for
$Re\approx 1200$
for
 $d/D=0.095$
and up to
$d/D=0.095$
and up to
 $Re\approx 1400$
for
$Re\approx 1400$
for
 $d/D=0.11$
at
$d/D=0.11$
at
 $L/D\approx 310$
. The reason for this difference is discussed in § 4.
$L/D\approx 310$
. The reason for this difference is discussed in § 4.
In figure 7, with the increase of
 $Re$
, the SS annulus approaches the tube wall, while the inner annulus moves towards the tube centre. The former feature was first predicted theoretically by Asmolov (Reference Asmolov1999) and later confirmed in experiments by MMG. The latter feature was experimentally observed by MIS.
$Re$
, the SS annulus approaches the tube wall, while the inner annulus moves towards the tube centre. The former feature was first predicted theoretically by Asmolov (Reference Asmolov1999) and later confirmed in experiments by MMG. The latter feature was experimentally observed by MIS.
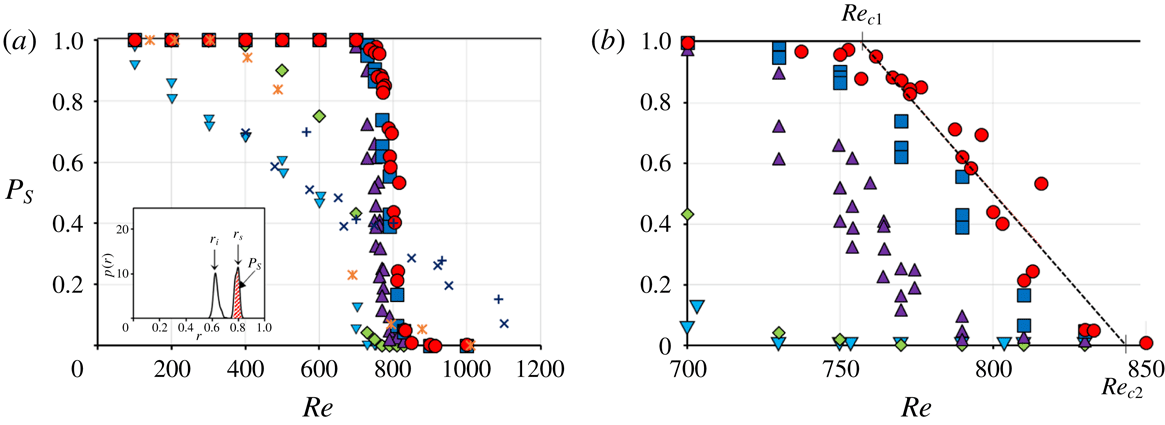
Next, we estimated the critical
 $Re$
between regimes (A) and (B), i.e.
$Re$
between regimes (A) and (B), i.e.
 $Re_{c1}$
, and that between regimes (B) and (C), i.e.
$Re_{c1}$
, and that between regimes (B) and (C), i.e.
 $Re_{c2}$
. To this end, we calculated the area between the curve
$Re_{c2}$
. To this end, we calculated the area between the curve
 $p(r)$
and the horizontal axis around the SS annulus, i.e. the hatched area shown in the inset of figure 8(a). This area, which is expressed as
$p(r)$
and the horizontal axis around the SS annulus, i.e. the hatched area shown in the inset of figure 8(a). This area, which is expressed as
 $P_{s}$
, represents the fraction of particles located on the SS annulus (MIS). In figure 8,
$P_{s}$
, represents the fraction of particles located on the SS annulus (MIS). In figure 8,
 $P_{s}$
is plotted with respect to
$P_{s}$
is plotted with respect to
 $Re$
for
$Re$
for
 $d/D=0.1$
and various values of
$d/D=0.1$
and various values of
 $L/D$
. Figure 8(b) is an expanded graph of figure 8(a). As expected from the left-most diagrams of figures 3 and 5, the
$L/D$
. Figure 8(b) is an expanded graph of figure 8(a). As expected from the left-most diagrams of figures 3 and 5, the
 $P_{s}$
values at
$P_{s}$
values at
 $L/D=125$
gradually decrease from
$L/D=125$
gradually decrease from
 ${\sim}1$
to 0 with the increase of
${\sim}1$
to 0 with the increase of
 $Re$
. As
$Re$
. As
 $L/D$
increases, the
$L/D$
increases, the
 $P_{s}$
values decline more rapidly near
$P_{s}$
values decline more rapidly near
 $Re=800$
. If the values of
$Re=800$
. If the values of
 $Re_{c1}$
and
$Re_{c1}$
and
 $Re_{c2}$
are approximated by the
$Re_{c2}$
are approximated by the
 $Re$
values of intersections between the linear regression of
$Re$
values of intersections between the linear regression of
 $P_{s}$
for
$P_{s}$
for
 $L/D=1000$
and the horizontal lines at
$L/D=1000$
and the horizontal lines at
 $P_{s}=1$
and 0, respectively, then we have
$P_{s}=1$
and 0, respectively, then we have
 $Re_{c1}\approx 757$
and
$Re_{c1}\approx 757$
and
 $Re_{c2}\approx 845$
for
$Re_{c2}\approx 845$
for
 $d/D=0.1$
(see figure 8
b). Here, we calculated the linear regression of
$d/D=0.1$
(see figure 8
b). Here, we calculated the linear regression of
 $P_{s}$
for
$P_{s}$
for
 $0.05<P_{s}<0.95$
. As shown in figure 8(b),
$0.05<P_{s}<0.95$
. As shown in figure 8(b),
 $P_{s}$
is not equal to unity in some range of
$P_{s}$
is not equal to unity in some range of
 $Re$
lower than the intersection between the linear regression of
$Re$
lower than the intersection between the linear regression of
 $P_{s}$
and the horizontal line of
$P_{s}$
and the horizontal line of
 $P_{s}=1$
, indicating that the critical
$P_{s}=1$
, indicating that the critical
 $Re$
could be lower than the intersection. In fact, two annuli are observed at
$Re$
could be lower than the intersection. In fact, two annuli are observed at
 $Re=750({<}757)$
in figure 5(a). However, as discussed later, the error of the
$Re=750({<}757)$
in figure 5(a). However, as discussed later, the error of the
 $Re$
in our experiments, i.e.
$Re$
in our experiments, i.e.
 $\unicode[STIX]{x0394}Re$
, was estimated to be a few per cent; thus, this difference is within
$\unicode[STIX]{x0394}Re$
, was estimated to be a few per cent; thus, this difference is within
 $\unicode[STIX]{x0394}Re$
.
$\unicode[STIX]{x0394}Re$
.

Figure 8. (a) Probability of the SS annulus, i.e.
 $P_{s}$
, for
$P_{s}$
, for
 $d/D=0.1$
at
$d/D=0.1$
at
 $L/D=125$
(inverted triangles), 250 (diamonds), 500 (triangles), 750 (squares) and 1000 (circles). Previous experimental results are indicated by asterisks (MIS for
$L/D=125$
(inverted triangles), 250 (diamonds), 500 (triangles), 750 (squares) and 1000 (circles). Previous experimental results are indicated by asterisks (MIS for
 $d/D=0.11$
at
$d/D=0.11$
at
 $L/D=250$
), and crosses and plus signs (MMG for
$L/D=250$
), and crosses and plus signs (MMG for
 $d/D=0.095$
and 0.11 at
$d/D=0.095$
and 0.11 at
 $L/D=313$
). (b) Expanded graph of (a).
$L/D=313$
). (b) Expanded graph of (a).
For comparison, in figure 8(a), the
 $P_{s}$
values obtained by MIS for
$P_{s}$
values obtained by MIS for
 $d/D=0.11$
and
$d/D=0.11$
and
 $L/D=250$
(
$L/D=250$
(
 $1-P_{i}$
in figure 9b of their paper) are indicated by asterisks, and the probability of finding a particle on the SS annulus reported by MMG (
$1-P_{i}$
in figure 9b of their paper) are indicated by asterisks, and the probability of finding a particle on the SS annulus reported by MMG (
 $P_{out}$
in figure 7 of their paper) is indicated by crosses for
$P_{out}$
in figure 7 of their paper) is indicated by crosses for
 $d/D=0.095$
and by plus signs for
$d/D=0.095$
and by plus signs for
 $d/D=0.11$
at
$d/D=0.11$
at
 $L/D\approx 310$
. The values of
$L/D\approx 310$
. The values of
 $P_{out}$
were reported to be almost independent of the size ratio
$P_{out}$
were reported to be almost independent of the size ratio
 $d/D$
for
$d/D$
for
 $d/D=0.059{-}0.11$
. The present results for
$d/D=0.059{-}0.11$
. The present results for
 $L/D=250$
agree well with the results of MIS. MMG reported that the probability of finding a particle on the inner annulus becomes higher than that of finding a particle on the SS annulus for
$L/D=250$
agree well with the results of MIS. MMG reported that the probability of finding a particle on the inner annulus becomes higher than that of finding a particle on the SS annulus for
 $Re\approx 650$
, which is consistent with the present results, where
$Re\approx 650$
, which is consistent with the present results, where
 $P_{s}$
at
$P_{s}$
at
 $L/D=250$
is nearly equal to 0.5 for
$L/D=250$
is nearly equal to 0.5 for
 $Re\approx 700$
. However, the values of
$Re\approx 700$
. However, the values of
 $P_{out}$
do not vanish beyond
$P_{out}$
do not vanish beyond
 $Re=1000$
, as previously noted.
$Re=1000$
, as previously noted.
Figure 9. (a) Critical channel Reynolds numbers
 $Re_{c1}$
(closed circles) and
$Re_{c1}$
(closed circles) and
 $Re_{c2}$
(open circles). (b) Critical particle Reynolds numbers
$Re_{c2}$
(open circles). (b) Critical particle Reynolds numbers
 $Re_{c1}(d/D)^{2}$
(closed squares) and
$Re_{c1}(d/D)^{2}$
(closed squares) and
 $Re_{c2}(d/D)^{2}$
(open squares), as well as
$Re_{c2}(d/D)^{2}$
(open squares), as well as
 $Re_{c1}(d/D)$
(closed triangles) and
$Re_{c1}(d/D)$
(closed triangles) and
 $Re_{c2}(d/D)$
(open triangles).
$Re_{c2}(d/D)$
(open triangles).
In figure 9, the critical Reynolds numbers, i.e.
 $Re_{c1}$
and
$Re_{c1}$
and
 $Re_{c2}$
, are plotted for
$Re_{c2}$
, are plotted for
 $d/D=0.083$
, 0.1 and 0.133, and their values are connected by lines. The results indicate that with the increase of the size ratio, the critical
$d/D=0.083$
, 0.1 and 0.133, and their values are connected by lines. The results indicate that with the increase of the size ratio, the critical
 $Re$
decreases for both
$Re$
decreases for both
 $Re_{c1}$
and
$Re_{c1}$
and
 $Re_{c2}$
. Additionally, the
$Re_{c2}$
. Additionally, the
 $Re$
range in regime (B) decreases. The decrease of
$Re$
range in regime (B) decreases. The decrease of
 $Re_{c1}$
and
$Re_{c1}$
and
 $Re_{c2}$
with the increase of
$Re_{c2}$
with the increase of
 $d/D$
is reasonable, because an increase of
$d/D$
is reasonable, because an increase of
 $d/D$
can increase the inertial effect at a constant
$d/D$
can increase the inertial effect at a constant
 $Re$
. In figure 9(b), we plot the corresponding particle Reynolds numbers
$Re$
. In figure 9(b), we plot the corresponding particle Reynolds numbers
 $Re_{c1}(d/D)^{2}$
and
$Re_{c1}(d/D)^{2}$
and
 $Re_{c2}(d/D)^{2}$
, as well as
$Re_{c2}(d/D)^{2}$
, as well as
 $Re_{c1}(d/D)$
and
$Re_{c1}(d/D)$
and
 $Re_{c2}(d/D)$
. The latter values appear to be nearly horizontal in this range of
$Re_{c2}(d/D)$
. The latter values appear to be nearly horizontal in this range of
 $d/D$
, even if the reason is not yet clear.
$d/D$
, even if the reason is not yet clear.
3.2 Numerical results
Figure 10 presents the profiles of the non-dimensional lateral (radial) force, i.e.
 $F/\unicode[STIX]{x1D70C}U^{2}d^{2}$
, exerted on a particle for
$F/\unicode[STIX]{x1D70C}U^{2}d^{2}$
, exerted on a particle for
 $d/D=0.10$
, at
$d/D=0.10$
, at
 $Re=100$
, 300, 600 and 700 (figure 10
a) and at
$Re=100$
, 300, 600 and 700 (figure 10
a) and at
 $Re=750$
, 800, 900 and 1000 (figure 10
b). Figure 10(a) shows that, in general, the non-dimensional lateral force decreases with the increase of
$Re=750$
, 800, 900 and 1000 (figure 10
b). Figure 10(a) shows that, in general, the non-dimensional lateral force decreases with the increase of
 $Re$
and has a local minimum between two local maxima, except at the lowest
$Re$
and has a local minimum between two local maxima, except at the lowest
 $Re$
. Each curve intersects the horizontal axis once at
$Re$
. Each curve intersects the horizontal axis once at
 $r>0.6$
. By expressing this intersection as
$r>0.6$
. By expressing this intersection as
 $r_{e}$
, we observe that the lateral force is positive (outward direction) for
$r_{e}$
, we observe that the lateral force is positive (outward direction) for
 $r<r_{e}$
and negative (inward direction) for
$r<r_{e}$
and negative (inward direction) for
 $r>r_{e}$
, indicating that the equilibrium position is stable. Additionally, the equilibrium radial position, i.e.
$r>r_{e}$
, indicating that the equilibrium position is stable. Additionally, the equilibrium radial position, i.e.
 $r_{e}$
, approaches the tube wall as
$r_{e}$
, approaches the tube wall as
 $Re$
increases. These properties of the non-dimensional lateral force are in accordance with those obtained via theoretical analyses based on the method of matched asymptotic expansions for a spherical particle in a two-dimensional Poiseuille flow by Asmolov (Reference Asmolov1999) and for a particle in a circular tube flow by Matas et al. (Reference Matas, Morris and Guazzelli2009).
$Re$
increases. These properties of the non-dimensional lateral force are in accordance with those obtained via theoretical analyses based on the method of matched asymptotic expansions for a spherical particle in a two-dimensional Poiseuille flow by Asmolov (Reference Asmolov1999) and for a particle in a circular tube flow by Matas et al. (Reference Matas, Morris and Guazzelli2009).
Figure 10. Non-dimensional lateral force exerted on a spherical particle for
 $d/D=0.1$
(a) at
$d/D=0.1$
(a) at
 $Re=100$
(diamonds), 300 (squares), 600 (triangles) and 700 (crosses), and (b) at
$Re=100$
(diamonds), 300 (squares), 600 (triangles) and 700 (crosses), and (b) at
 $Re=750$
(diamonds), 800 (squares), 900 (circles) and 1000 (triangles). In (b), the force curve for
$Re=750$
(diamonds), 800 (squares), 900 (circles) and 1000 (triangles). In (b), the force curve for
 $Re=700$
is indicated by a dotted line, for comparison.
$Re=700$
is indicated by a dotted line, for comparison.
Figure 10(b) shows the lateral-force profiles at
 $Re>700$
. The corresponding curve for
$Re>700$
. The corresponding curve for
 $Re=700$
is also plotted (dashed line), for comparison. As
$Re=700$
is also plotted (dashed line), for comparison. As
 $Re$
increases, the non-dimensional force curves continue to decrease, particularly in the region adjacent to the tube wall. Consequently, the local minimum becomes negative, and the force curves for
$Re$
increases, the non-dimensional force curves continue to decrease, particularly in the region adjacent to the tube wall. Consequently, the local minimum becomes negative, and the force curves for
 $Re=750$
and 800 intersect the horizontal axis three times. Although all of these intersections represent equilibrium positions, the inner and outer ones are stable, whereas the middle one is unstable. Thus, it can be deduced that the outer intersection corresponds to the SS annulus, and the inner intersection corresponds to the inner annulus (regime (B)). A further increase in
$Re=750$
and 800 intersect the horizontal axis three times. Although all of these intersections represent equilibrium positions, the inner and outer ones are stable, whereas the middle one is unstable. Thus, it can be deduced that the outer intersection corresponds to the SS annulus, and the inner intersection corresponds to the inner annulus (regime (B)). A further increase in
 $Re$
decreases the outer local maximum below zero (see the force curves for
$Re$
decreases the outer local maximum below zero (see the force curves for
 $Re=900$
and 1000). Thus, the force curve intersects the horizontal axis at one point again. The intersection is located at a radial position corresponding to the inner annulus, as indicated by the force curves for
$Re=900$
and 1000). Thus, the force curve intersects the horizontal axis at one point again. The intersection is located at a radial position corresponding to the inner annulus, as indicated by the force curves for
 $Re=900$
and 1000. At these
$Re=900$
and 1000. At these
 $Re$
values, the equilibrium position corresponding to the SS annulus vanishes, and the inner annulus is the only equilibrium position (regime (C)).
$Re$
values, the equilibrium position corresponding to the SS annulus vanishes, and the inner annulus is the only equilibrium position (regime (C)).
The numerically obtained radial coordinates of these equilibrium positions are plotted by lines in figure 7, where the unstable equilibrium position in regime (B) is indicated by a dotted line. Figure 7 indicates that the numerical results agree well with the present experimental results, as well as with the results of previous studies. In summary, our numerical results support the presence of three regimes for the focusing pattern of spherical particles in circular tube flows. According to our computations, for
 $d/D=0.1$
,
$d/D=0.1$
,
 $Re_{c1}$
lies between 740 and 750, and
$Re_{c1}$
lies between 740 and 750, and
 $Re_{c2}$
lies between 840 and 850. These values are comparable to the present experimental results.
$Re_{c2}$
lies between 840 and 850. These values are comparable to the present experimental results.
4 Discussion
4.1 Experimental errors
We investigated the inertial migration of neutrally buoyant spherical particles suspended in circular tube flows by measuring the particle distribution in the tube cross-section at various distances from the tube inlet. We performed the experiments carefully, but there were several potential sources of dispersions of the experimental results. One of these was the difficulty of precisely controlling the experimental conditions and another one was the measurement error. In each experiment, we measured the temperature, density and viscosity of the glycerol solution using a high-resolution thermistor thermometer (Omega HH42A), a cone-plate viscometer (Brookfield LVDV-II
 $+$
Pro), and a density/specific gravity meter (Kyoto Electronics DA-650), respectively. Although the viscometer was calibrated using standard solutions with known viscosity in each experiment, a comparison of the obtained values with those measured by a capillary viscometer (Sibata Ubbelohde viscometer) indicated a difference of
$+$
Pro), and a density/specific gravity meter (Kyoto Electronics DA-650), respectively. Although the viscometer was calibrated using standard solutions with known viscosity in each experiment, a comparison of the obtained values with those measured by a capillary viscometer (Sibata Ubbelohde viscometer) indicated a difference of
 ${<}1\,\%$
. We continuously monitored the temperature during the experiment and found a difference of up to
${<}1\,\%$
. We continuously monitored the temperature during the experiment and found a difference of up to
 $2\,^{\circ }\text{C}$
between the start and end of the experiment. Additionally, the density measurements may have had errors of
$2\,^{\circ }\text{C}$
between the start and end of the experiment. Additionally, the density measurements may have had errors of
 ${\sim}1\,\%$
. These errors caused uncertainty of
${\sim}1\,\%$
. These errors caused uncertainty of
 $Re$
(
$Re$
(
 $\unicode[STIX]{x0394}Re\approx$
a few per cent of
$\unicode[STIX]{x0394}Re\approx$
a few per cent of
 $Re$
).
$Re$
).
There were dispersions in the tube diameter and particle diameter. We measured the diameter of nominal
 $600~\unicode[STIX]{x03BC}\text{m}$
tubes at the outlet and found that it ranged from 590.9 to
$600~\unicode[STIX]{x03BC}\text{m}$
tubes at the outlet and found that it ranged from 590.9 to
 $609.7~\unicode[STIX]{x03BC}\text{m}$
, with a mean of
$609.7~\unicode[STIX]{x03BC}\text{m}$
, with a mean of
 $598.7~\unicode[STIX]{x03BC}\text{m}$
and a standard deviation of
$598.7~\unicode[STIX]{x03BC}\text{m}$
and a standard deviation of
 $5.3~\unicode[STIX]{x03BC}\text{m}$
(coefficient of variation (CV) of 0.9 %). We determined the flow rate using the average diameter measurement for each tube and applied this flow rate to the syringe pump. The flow rate was checked by collecting the outflow through the tube in a given period. The differences between the set value and the value estimated from the outflow were
$5.3~\unicode[STIX]{x03BC}\text{m}$
(coefficient of variation (CV) of 0.9 %). We determined the flow rate using the average diameter measurement for each tube and applied this flow rate to the syringe pump. The flow rate was checked by collecting the outflow through the tube in a given period. The differences between the set value and the value estimated from the outflow were
 ${\sim}1\,\%$
, and the maximum difference was 1.62 %.
${\sim}1\,\%$
, and the maximum difference was 1.62 %.
The polystyrene spherical particles used in the case of
 $d/D=0.1$
had a mean diameter of
$d/D=0.1$
had a mean diameter of
 $59.2~\unicode[STIX]{x03BC}\text{m}$
, with a standard deviation of
$59.2~\unicode[STIX]{x03BC}\text{m}$
, with a standard deviation of
 $0.8~\unicode[STIX]{x03BC}\text{m}$
(CV of 1.4 %). In their macroscale experiments, MIS used particles having a mean diameter of
$0.8~\unicode[STIX]{x03BC}\text{m}$
(CV of 1.4 %). In their macroscale experiments, MIS used particles having a mean diameter of
 $644~\unicode[STIX]{x03BC}\text{m}$
, with a standard deviation of
$644~\unicode[STIX]{x03BC}\text{m}$
, with a standard deviation of
 $24.8~\unicode[STIX]{x03BC}\text{m}$
(CV of 3.9 %), for
$24.8~\unicode[STIX]{x03BC}\text{m}$
(CV of 3.9 %), for
 $d/D\approx 0.08$
. Additionally, table 1 of MMG indicates significant variations in
$d/D\approx 0.08$
. Additionally, table 1 of MMG indicates significant variations in
 $D/d$
(from 5.5 % to 15 %) in their experiments. The variations of
$D/d$
(from 5.5 % to 15 %) in their experiments. The variations of
 $d/D$
can affect the particle distribution, because the particle-focusing pattern is highly dependent on the size ratio, as shown in figure 9. Smaller particles tend to lie on the SS annulus up to higher
$d/D$
can affect the particle distribution, because the particle-focusing pattern is highly dependent on the size ratio, as shown in figure 9. Smaller particles tend to lie on the SS annulus up to higher
 $Re$
. Thus, the large variation of
$Re$
. Thus, the large variation of
 $d/D$
in the macroscale experiments may be one of the reasons why the SS annulus was retained at higher
$d/D$
in the macroscale experiments may be one of the reasons why the SS annulus was retained at higher
 $Re$
than in the present study. MMG also reported the possibility that the pump flattened some particles during the flow circulation. They observed that non-spherical particles had a different migration behaviour from the spherical particles. The smaller dispersions in
$Re$
than in the present study. MMG also reported the possibility that the pump flattened some particles during the flow circulation. They observed that non-spherical particles had a different migration behaviour from the spherical particles. The smaller dispersions in
 $d/D$
in the present study may have resulted in sharper particle focusing on the annuli compared with the previous macroscale experiments (MMG; MIS).
$d/D$
in the present study may have resulted in sharper particle focusing on the annuli compared with the previous macroscale experiments (MMG; MIS).
We used a high-speed camera equipped with a long working distance objective to observe the particles. The pixel width in the images was typically
 ${\sim}2~\unicode[STIX]{x03BC}\text{m}$
(
${\sim}2~\unicode[STIX]{x03BC}\text{m}$
(
 ${\sim}0.007\times (D/2)$
), which is comparable to that of MIS.
${\sim}0.007\times (D/2)$
), which is comparable to that of MIS.
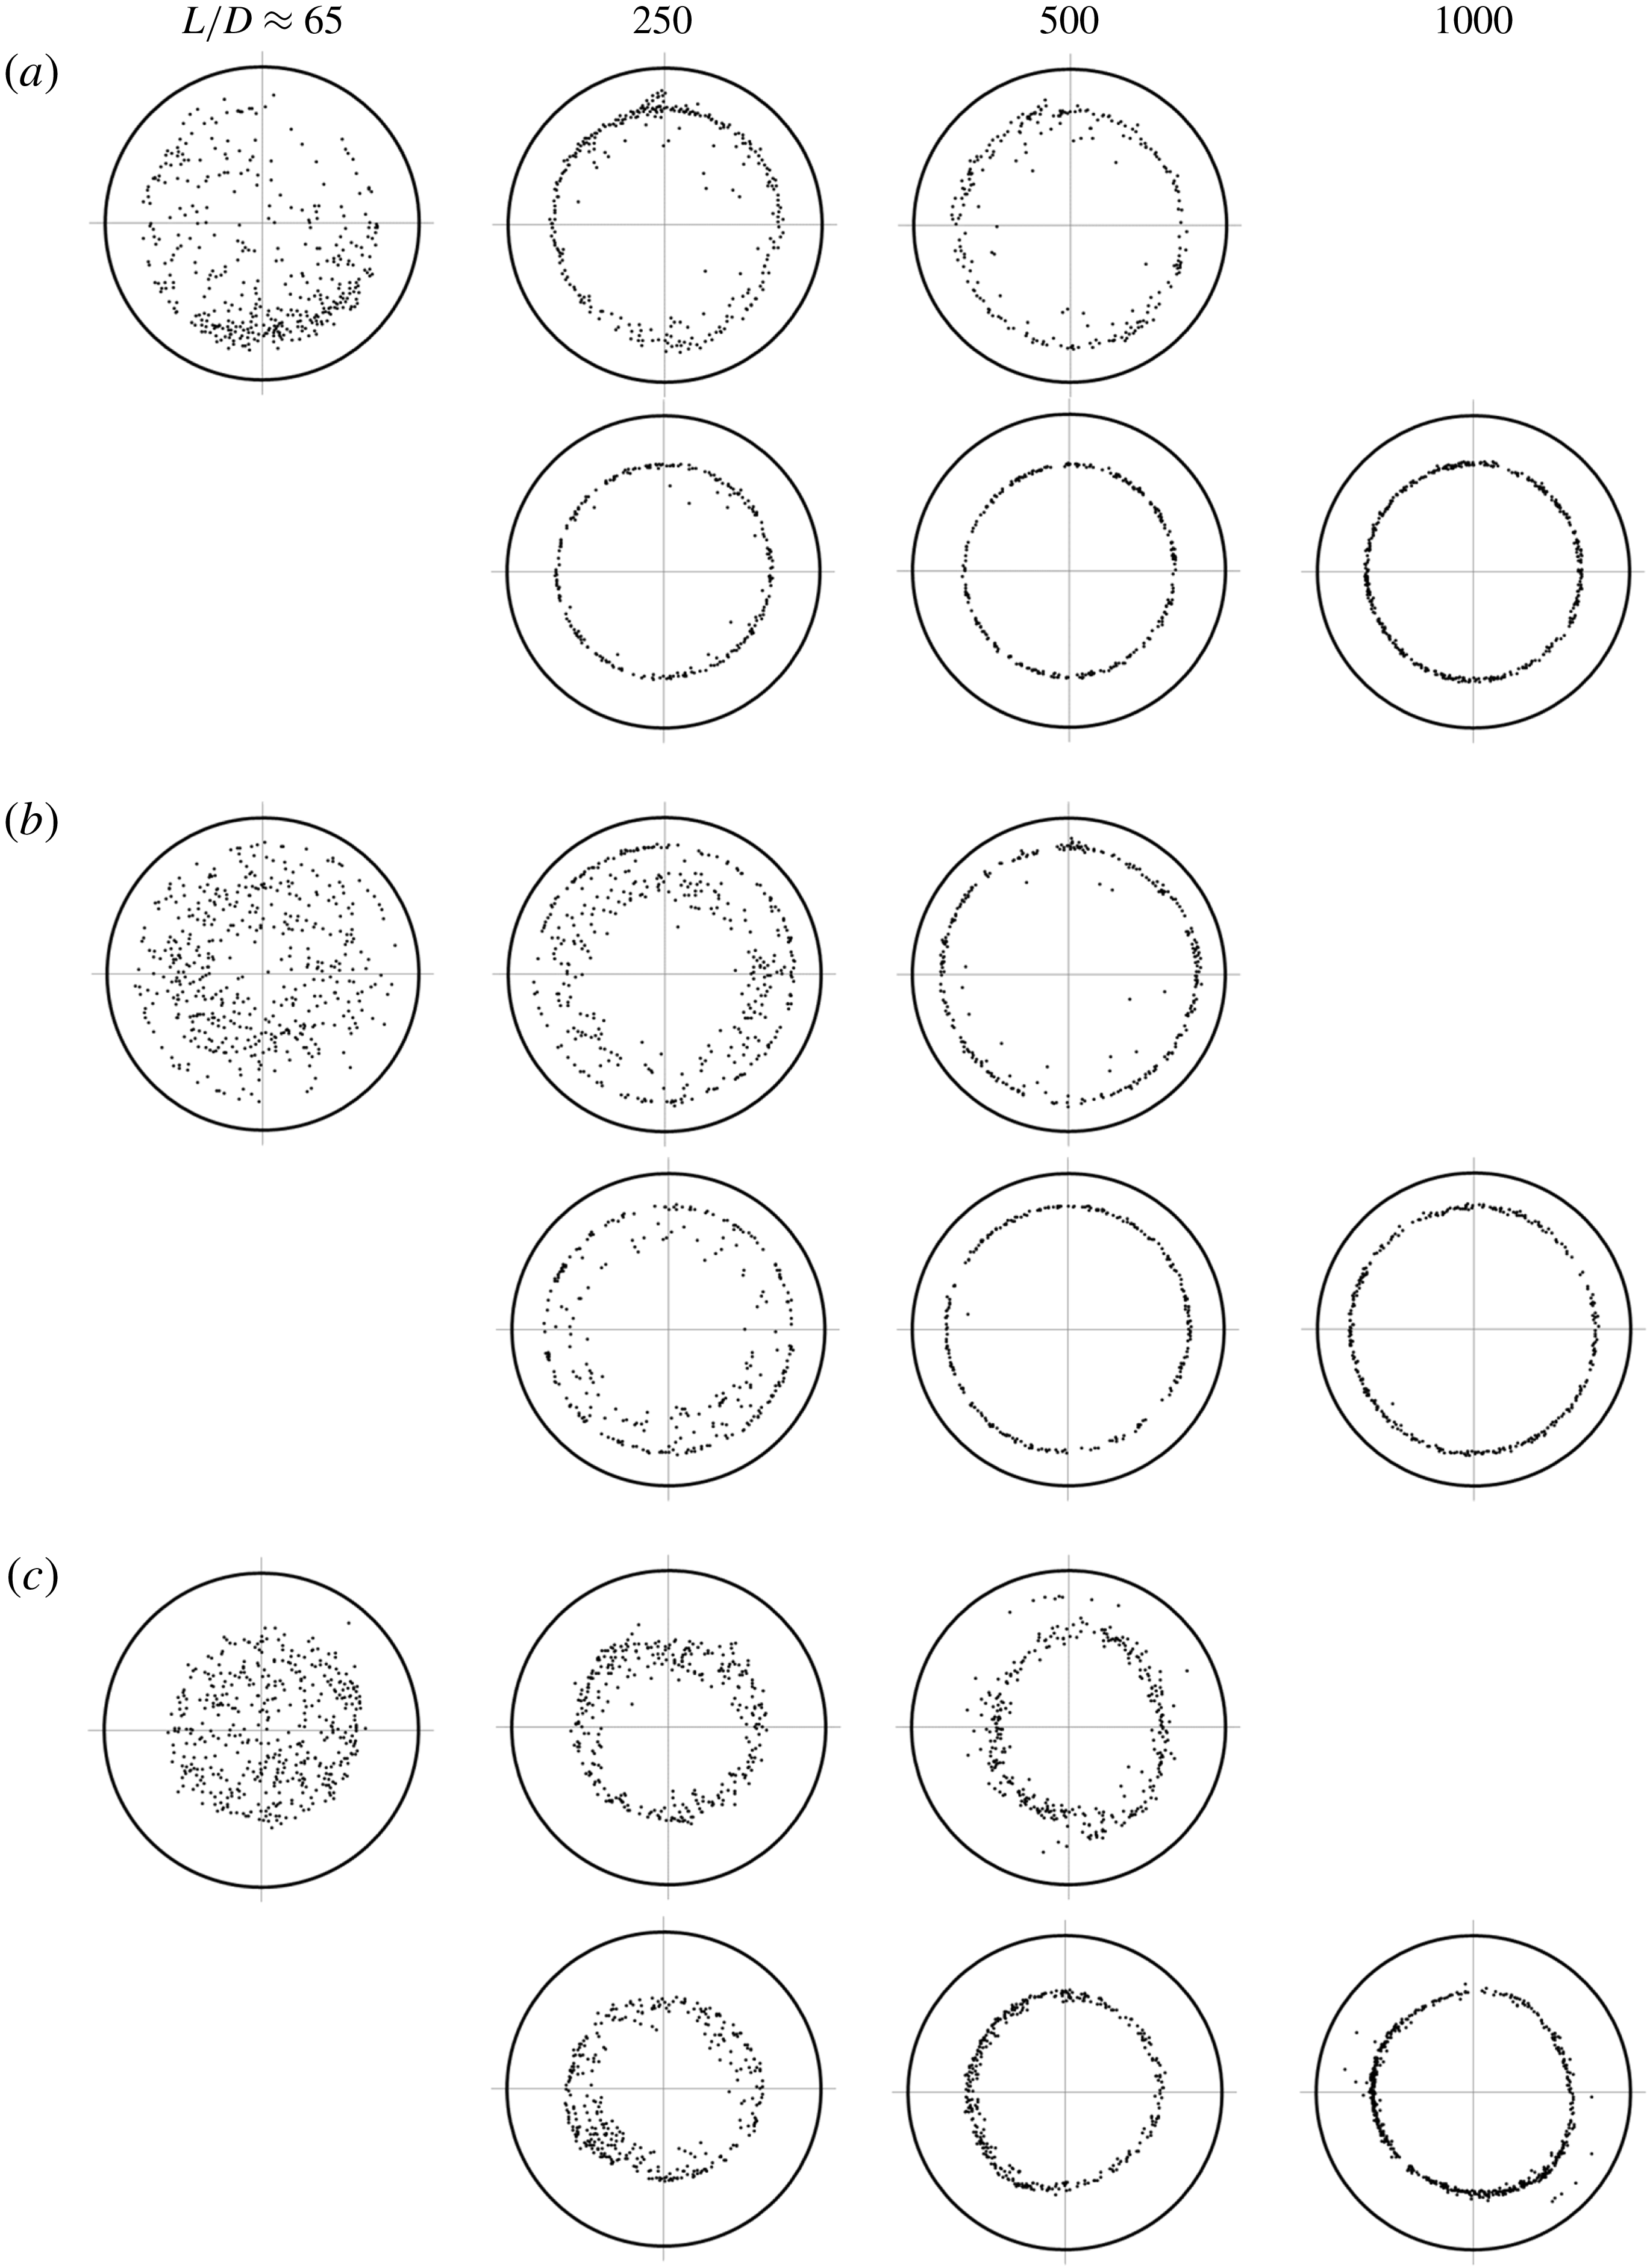
Figure 11. Comparison of particle distributions over the tube cross-section for
 $d/D\approx 0.08$
obtained by MIS (upper row) and in the present study (lower row), at
$d/D\approx 0.08$
obtained by MIS (upper row) and in the present study (lower row), at
 $Re$
values of (a)
$Re$
values of (a)
 ${\sim}100$
, (b)
${\sim}100$
, (b)
 ${\sim}500$
and (c)
${\sim}500$
and (c)
 ${\sim}1000$
.
${\sim}1000$
.
4.2 Comparison with previous studies
The present experimental and numerical investigations indicated the presence of three
 $Re$
regimes for the particle-focusing pattern: the particles were focused on the SS annulus at
$Re$
regimes for the particle-focusing pattern: the particles were focused on the SS annulus at
 $Re<Re_{c1}$
(regime (A)), on the SS annulus and the inner annulus at
$Re<Re_{c1}$
(regime (A)), on the SS annulus and the inner annulus at
 $Re_{c1}<Re<Re_{c2}$
(regime (B)), and on the inner annulus at
$Re_{c1}<Re<Re_{c2}$
(regime (B)), and on the inner annulus at
 $Re>Re_{c2}$
(regime (C)). The radii of
$Re>Re_{c2}$
(regime (C)). The radii of
 $r_{s}$
and
$r_{s}$
and
 $r_{i}$
obtained for
$r_{i}$
obtained for
 $d/D=0.1$
in the present study agree well with those obtained in previous experimental and numerical studies, as shown in figure 7.
$d/D=0.1$
in the present study agree well with those obtained in previous experimental and numerical studies, as shown in figure 7.
Figure 11 shows a comparison between the particle distributions obtained by MIS and the corresponding results of the present study, for the case of
 $d/D\approx 0.08$
at
$d/D\approx 0.08$
at
 $Re\approx 100$
, 500 and 1000. In each of figures 11(a)–11(c), the upper row represents the results of MIS (
$Re\approx 100$
, 500 and 1000. In each of figures 11(a)–11(c), the upper row represents the results of MIS (
 $L/D=65$
, 258, 516) and the lower row represents the results of this study (
$L/D=65$
, 258, 516) and the lower row represents the results of this study (
 $L/D=250$
, 500, 1000). Although the particles were more highly concentrated near the equilibrium positions (less dispersed) in the present study, the particle distributions of the two studies were similar. In particular, we observe the prompt focusing of particles towards the SS annulus in figure 11(a) and the emergence of the transient accumulation of particles closer to the tube centre in figure 11(b). Figure 11(c) indicates that at
$L/D=250$
, 500, 1000). Although the particles were more highly concentrated near the equilibrium positions (less dispersed) in the present study, the particle distributions of the two studies were similar. In particular, we observe the prompt focusing of particles towards the SS annulus in figure 11(a) and the emergence of the transient accumulation of particles closer to the tube centre in figure 11(b). Figure 11(c) indicates that at
 $Re\approx 1000$
, the SS annulus is absent in the upstream cross-sections, whereas several particles appear on the SS annulus in the downstream cross-sections, accompanying the majority of particles on the inner annulus. Nevertheless, owing to the disappearance of the inner annulus in the downstream cross-section observed at lower
$Re\approx 1000$
, the SS annulus is absent in the upstream cross-sections, whereas several particles appear on the SS annulus in the downstream cross-sections, accompanying the majority of particles on the inner annulus. Nevertheless, owing to the disappearance of the inner annulus in the downstream cross-section observed at lower
 $Re$
(see figure 11
b) and the larger entry length necessary to achieve lateral migration for higher
$Re$
(see figure 11
b) and the larger entry length necessary to achieve lateral migration for higher
 $Re$
, MIS considered that at
$Re$
, MIS considered that at
 $Re\approx 1000$
, if the tube is long enough, particles continue the outward migration from the inner annulus to the SS annulus, causing the inner annulus to disappear in farther downstream cross-sections for
$Re\approx 1000$
, if the tube is long enough, particles continue the outward migration from the inner annulus to the SS annulus, causing the inner annulus to disappear in farther downstream cross-sections for
 $d/D\approx 0.08$
. The present study showed that this conjecture is correct at
$d/D\approx 0.08$
. The present study showed that this conjecture is correct at
 $Re<Re_{c1}$
(
$Re<Re_{c1}$
(
 ${\approx}800$
for
${\approx}800$
for
 $d/D\approx 0.08$
), but the inner annulus does not disappear at
$d/D\approx 0.08$
), but the inner annulus does not disappear at
 $Re>Re_{c1}$
.
$Re>Re_{c1}$
.
4.3 Inner annulus
One of the most important results of this study is the presence of the inner annulus as a stable equilibrium position. The present experimental and numerical investigations indicated that in regime (B), the radial positions of both SS annulus and inner annulus are stable equilibrium positions, and in regime (C) only the radial position of the inner annulus is a stable equilibrium positon, i.e. that of the SS annulus is no longer a stable equilibrium position. Since we assumed that the particles entered the tube inlet randomly over the tube cross-section, the absence of particles adjacent to the tube wall and near the tube centre in the most upstream cross-sections (figure 5) indicates that the particles entering the tube inlet near tube wall promptly migrated in the inward direction, whereas the particles entering the tube inlet near the tube centre moved in the outward direction. At a certain distance from the tube inlet, the particles were focused on the inner annulus for
 $Re>Re_{c1}$
(regimes (B) and (C)). Because our experimental method involved observing the cross-section close to the tube outlet, the evolution of the particle distribution from the tube inlet could not be traced continuously in the flow direction; thus, we could not determine the aforementioned distance. In regime (C), the particles remained on the inner annulus, whereas in regime (B), some particles moved in the outward direction until they reached the SS annulus.
$Re>Re_{c1}$
(regimes (B) and (C)). Because our experimental method involved observing the cross-section close to the tube outlet, the evolution of the particle distribution from the tube inlet could not be traced continuously in the flow direction; thus, we could not determine the aforementioned distance. In regime (C), the particles remained on the inner annulus, whereas in regime (B), some particles moved in the outward direction until they reached the SS annulus.
Regarding regime (B), a question arises: if the inner annulus is an equilibrium position, why did the particles move to the SS annulus rather than remaining on the inner annulus? The lateral-force profiles at
 $Re=750$
and 800 (regime (B)) shown in figure 10(b) may provide a clue to answer this question. The lateral force changed its sign three times in the
$Re=750$
and 800 (regime (B)) shown in figure 10(b) may provide a clue to answer this question. The lateral force changed its sign three times in the
 $r$
range of 0.6–0.8: at
$r$
range of 0.6–0.8: at
 $r=r_{i}$
,
$r=r_{i}$
,
 $r_{m}$
and
$r_{m}$
and
 $r_{s}$
, where
$r_{s}$
, where
 $r_{m}$
represents the radial position of the unstable equilibrium position between the inner annulus and the SS annulus. Particles located in the range of
$r_{m}$
represents the radial position of the unstable equilibrium position between the inner annulus and the SS annulus. Particles located in the range of
 $r_{i}<r<r_{m}$
experienced an inward force that would prevent them from approaching the SS annulus. However, because the particles inside the inner annulus migrated in the outward direction to reach the inner annulus (
$r_{i}<r<r_{m}$
experienced an inward force that would prevent them from approaching the SS annulus. However, because the particles inside the inner annulus migrated in the outward direction to reach the inner annulus (
 $r=r_{i}$
), they possibly continued this outward migration beyond the inner annulus, owing to the particle inertia. The channel Reynolds number
$r=r_{i}$
), they possibly continued this outward migration beyond the inner annulus, owing to the particle inertia. The channel Reynolds number
 $Re=800$
corresponds to the particle Reynolds number
$Re=800$
corresponds to the particle Reynolds number
 $Re_{p}=8$
for
$Re_{p}=8$
for
 $d/D=0.1$
. The importance of the particle inertia at these
$d/D=0.1$
. The importance of the particle inertia at these
 $Re$
values was indicated by the observation results of MIS near the tube entrance: after entering the tube from a large space, particles retain the inward motion at a relatively high
$Re$
values was indicated by the observation results of MIS near the tube entrance: after entering the tube from a large space, particles retain the inward motion at a relatively high
 $Re({\approx}800)$
, whereas they move almost parallel to the tube axis at a low
$Re({\approx}800)$
, whereas they move almost parallel to the tube axis at a low
 $Re({\approx}200)$
.
$Re({\approx}200)$
.
Another possible reason for the particles reaching the SS annulus may be flow fluctuations. Because the positions of
 $r_{i}$
and
$r_{i}$
and
 $r_{m}$
are so close, flow fluctuations may have allowed particles to overcome the barrier of the inward force. For example, the particles were not perfectly spherical, and tubes were not perfectly straight and did not have uniform identical circular cross-sections. Occasional hydrodynamic interactions between particles may have occurred, despite the low volume fraction of particles (
$r_{m}$
are so close, flow fluctuations may have allowed particles to overcome the barrier of the inward force. For example, the particles were not perfectly spherical, and tubes were not perfectly straight and did not have uniform identical circular cross-sections. Occasional hydrodynamic interactions between particles may have occurred, despite the low volume fraction of particles (
 ${\sim}10^{-5}$
). Although the Reynolds numbers considered here are significantly lower than the so-called critical Reynolds number characterising the transition from laminar flow to turbulence (Nishi et al.
Reference Nishi, Ünsal, Durst and Biswas2008; Barkley Reference Barkley2016; Song et al.
Reference Song, Barkley, Hof and Avila2017), the aforementioned factors in addition to the presence of particles themselves may have generated flow fluctuations large enough for particles to pass beyond the zone of the inward force for
${\sim}10^{-5}$
). Although the Reynolds numbers considered here are significantly lower than the so-called critical Reynolds number characterising the transition from laminar flow to turbulence (Nishi et al.
Reference Nishi, Ünsal, Durst and Biswas2008; Barkley Reference Barkley2016; Song et al.
Reference Song, Barkley, Hof and Avila2017), the aforementioned factors in addition to the presence of particles themselves may have generated flow fluctuations large enough for particles to pass beyond the zone of the inward force for
 $r_{i}<r<r_{m}$
. Regarding the fluctuation due to the presence of particles, at higher
$r_{i}<r<r_{m}$
. Regarding the fluctuation due to the presence of particles, at higher
 $Re$
around the transition to turbulence, Matas, Morris & Guazzelli (Reference Matas, Morris and Guazzelli2003) demonstrated experimentally that for suspensions of
$Re$
around the transition to turbulence, Matas, Morris & Guazzelli (Reference Matas, Morris and Guazzelli2003) demonstrated experimentally that for suspensions of
 $d/D>1/65$
, the transition is moved to lower
$d/D>1/65$
, the transition is moved to lower
 $Re$
and the critical
$Re$
and the critical
 $Re$
decreases with the increase of the particle volume fraction
$Re$
decreases with the increase of the particle volume fraction
 $\unicode[STIX]{x1D719}$
for small
$\unicode[STIX]{x1D719}$
for small
 $\unicode[STIX]{x1D719}$
. The most plausible explanation for this observation was that the fluctuations induced by the particles trigger the subcritical transition.
$\unicode[STIX]{x1D719}$
. The most plausible explanation for this observation was that the fluctuations induced by the particles trigger the subcritical transition.
Shao, Yu & Sun (Reference Shao, Yu and Sun2008) performed numerical computations of the trajectories of a spherical particle in a tube flow via the friction domain method, for size ratios of
 $d/D=0.1$
and 0.15 and
$d/D=0.1$
and 0.15 and
 $100\leqslant Re\leqslant 2200$
under a periodic boundary condition with lengths of
$100\leqslant Re\leqslant 2200$
under a periodic boundary condition with lengths of
 $l=D$
or
$l=D$
or
 $2D$
in the flow direction. For
$2D$
in the flow direction. For
 $d/D=0.1$
and
$d/D=0.1$
and
 $l/D=2$
, they reported that particles approach the SS annulus at
$l/D=2$
, they reported that particles approach the SS annulus at
 $Re\leqslant 1000$
, and exhibit oscillatory motion at
$Re\leqslant 1000$
, and exhibit oscillatory motion at
 $Re=1200$
and 1300. If the oscillatory motion implies the oscillation of particles between two equilibrium positions, these properties indicate the presence of regime (A) (
$Re=1200$
and 1300. If the oscillatory motion implies the oscillation of particles between two equilibrium positions, these properties indicate the presence of regime (A) (
 $Re\leqslant 1000$
) and regime (B) (
$Re\leqslant 1000$
) and regime (B) (
 $Re=1200$
, 1300) identified in the present study. Although their
$Re=1200$
, 1300) identified in the present study. Although their
 $Re$
ranges are higher than those in the present study, their statement that the critical Reynolds number for the onset of the inner equilibrium position is higher for a smaller size ratio agrees qualitatively with the present results shown in figure 9.
$Re$
ranges are higher than those in the present study, their statement that the critical Reynolds number for the onset of the inner equilibrium position is higher for a smaller size ratio agrees qualitatively with the present results shown in figure 9.
In figure 9, it should be noted additionally that in the cases of the largest particle with
 $d/D=0.133$
and high
$d/D=0.133$
and high
 $Re({\gtrsim}800)$
, some particles exhibited a peculiar behaviour such as swirling, or moving in the azimuthal direction, while passing the focal plane of the objective. The images of these particles were shifted circumferentially in consecutive frames, typically by
$Re({\gtrsim}800)$
, some particles exhibited a peculiar behaviour such as swirling, or moving in the azimuthal direction, while passing the focal plane of the objective. The images of these particles were shifted circumferentially in consecutive frames, typically by
 ${\sim}18~\unicode[STIX]{x03BC}\text{m}~\text{frame}^{-1}$
or
${\sim}18~\unicode[STIX]{x03BC}\text{m}~\text{frame}^{-1}$
or
 ${\sim}0.08~\text{rad}~\text{frame}^{-1}$
(the frame-to-frame interval
${\sim}0.08~\text{rad}~\text{frame}^{-1}$
(the frame-to-frame interval
 $=1/8000~\text{s}$
). These particles were placed on an outer annulus, possibly corresponding to the SS annulus, despite
$=1/8000~\text{s}$
). These particles were placed on an outer annulus, possibly corresponding to the SS annulus, despite
 $Re$
being in regime (C) in figure 9 (
$Re$
being in regime (C) in figure 9 (
 $Re>Re_{c2}$
). In these cases, the inner annulus was also present, where the particles did not show such a swirling motion. This phenomenon may be related to the presence of alternative (unstable) solutions of the Navier–Stokes equations such as travelling wave solutions, some of which possess spiral features and exist at lower
$Re>Re_{c2}$
). In these cases, the inner annulus was also present, where the particles did not show such a swirling motion. This phenomenon may be related to the presence of alternative (unstable) solutions of the Navier–Stokes equations such as travelling wave solutions, some of which possess spiral features and exist at lower
 $Re$
than the critical
$Re$
than the critical
 $Re$
(Pringle & Kerswell Reference Pringle and Kerswell2007; Deguchi & Walton Reference Deguchi and Walton2013; Yu et al.
Reference Yu, Wu, Shao and Lin2013). These are intriguing issues, but beyond the scope of the present study.
$Re$
(Pringle & Kerswell Reference Pringle and Kerswell2007; Deguchi & Walton Reference Deguchi and Walton2013; Yu et al.
Reference Yu, Wu, Shao and Lin2013). These are intriguing issues, but beyond the scope of the present study.
5 Conclusions
We examined the evolution of the cross-sectional distributions of neutrally buoyant spherical particles suspended in circular tube flows. The particle-focusing patterns observed in the tube cross-section at a distance of 1000 times the tube diameter from the tube inlet indicated the presence of three
 $Re$
regimes: particles were focused on the SS annulus in regime (A), on the SS annulus and the inner annulus in regime (B), and on the inner annulus in regime (C). These results indicate that the radial position of the inner annulus was a stable equilibrium position in regimes (B) and (C), and the radial position of the SS annulus was no longer a stable equilibrium position in regime (C). The critical Reynolds numbers, i.e.
$Re$
regimes: particles were focused on the SS annulus in regime (A), on the SS annulus and the inner annulus in regime (B), and on the inner annulus in regime (C). These results indicate that the radial position of the inner annulus was a stable equilibrium position in regimes (B) and (C), and the radial position of the SS annulus was no longer a stable equilibrium position in regime (C). The critical Reynolds numbers, i.e.
 $Re_{c1}$
and
$Re_{c1}$
and
 $Re_{c2}$
, between neighbouring regimes decreased with the increase of the size ratio.
$Re_{c2}$
, between neighbouring regimes decreased with the increase of the size ratio.
Acknowledgements
We gratefully acknowledge Dr B. H. Yang for providing the numerical results shown in figure 2. Drs S. Wada, N. Yokoyama, S. Ishida and N. Takeishi (Osaka University) are greatly appreciated for the helpful discussion. This research was partially supported by JSPS KAKENHI grant no. 17H03176 and the ORDIST group fund of Kansai University.