


1. Introduction
Controlled high energy convergence in a small spatial scale, such as triggering reactions under extreme conditions (e.g. inertial confinement fusion Lindl Reference Lindl1998; Taleyarkhan et al. Reference Taleyarkhan, West, Cho, Lahey, Nigmatulin and Block2002) and destroying local tissue in medical applications (e.g. needle-free injection Kiyama et al. Reference Kiyama, Endo, Kawamoto, Katsuta, Oida, Tanaka and Tagawa2019, ultrasound-mediated drug and gene delivery Mitragotri Reference Mitragotri2005 and histotripsy Maxwell et al. Reference Maxwell, Wang, Cain, Fowlkes, Sapozhnikov, Bailey and Xu2011), is a very promising but challenging research direction. The shock-induced collapse of cavities in liquid is always accompanied by a series of local high-energy phenomena, including extreme peak pressure, high-speed microjets and even sonoluminescence (Hilgenfeldt et al. Reference Hilgenfeldt, Brenner, Grossmann and Lohse1998), making it a remarkable method for small-scale energy convergence.
Numerous studies have been conducted on shock-induced cavity collapse (Tomita, Shima & Takahashi Reference Tomita, Shima and Takahashi1983; Bourne & Field Reference Bourne and Field1992; Ball et al. Reference Ball, Howell, Leighton and Schofield2000). The side of the cavity impacted by the shock wave deforms inwards rapidly, and the asymmetric deformation of the cavity results in the development of a local high-speed re-entrant microjet, which is directed towards the opposite side of the cavity along the propagation direction of the shock wave. Then, the high-speed jet penetrates the cavity, which induces the generation of pressure peaks and evolution of pressure waves along with collapse of the cavity (Sankin et al. Reference Sankin, Simmons, Zhu and Zhong2006). These pressure waves emitted with the collapse of the cavity are called collapsing waves (Rasthofer et al. Reference Rasthofer, Wermelinger, Karnakov, Šukys and Koumoutsakos2019; Wu, Wang & Xiang Reference Wu, Wang and Xiang2019). According to previous studies, the luminescence phenomenon can be observed during the collapse of the cavity, which confirms the emergence of a local high-energy density point (Bourne & Field Reference Bourne and Field1999). Owing to the development of computer technology and numerical methods for multiphase flows, refined numerical simulations can be applied to investigate the process of shock-induced cavity collapse in which the generation and evolution of transient phenomena can be analysed in detail (Saurel, Gavrilyuk & Renaud Reference Saurel, Gavrilyuk and Renaud2003; Johnsen & Colonius Reference Johnsen and Colonius2006, Reference Johnsen and Colonius2009; Tully, Hawker & Ventikos Reference Tully, Hawker and Ventikos2016). Hawker & Ventikos (Reference Hawker and Ventikos2012) carefully simulated the interactions between a shock wave and a cavity in liquid, where various transmission and reflection wave structures were observed during the cavity deformation process. Their results showed that the remnant of the cavity would further evolve and it would be split by some local microjets after penetration by the main re-entrant jet; additional pressure peaks and collapsing waves may be generated at this stage. In this manner, the peak pressure can be effectively amplified when compared with that of the initial incident shock (Johnsen & Colonius Reference Johnsen and Colonius2009; Hawker & Ventikos Reference Hawker and Ventikos2012). Based on previous studies, it is known that the existence of a cavity during the propagation of a shock wave can effectively realise local energy convergence in the flow field (Michael & Nikiforakis Reference Michael and Nikiforakis2019).
In the natural cavitation process, the cavitation zone usually acts as a cavity cloud rather than a single cavity (Reisman, Wang & Brennen Reference Reisman, Wang and Brennen1998; Kumar & Saini Reference Kumar and Saini2010). According to previous studies (Hansson, Kedrinskii & Morch Reference Hansson, Kedrinskii and Morch1982; Tomita, Shima & Ohno Reference Tomita, Shima and Ohno1984), the evolution mechanism of a cavity cloud might be more complicated than that of a single cavity and the peak pressure may be further amplified during the collapse of the cavity cloud. Numerous studies have been conducted to understand the interaction mechanism between the cavities during the during the evolution of multiple cavities in an area (Fuster, Conoir & Colonius Reference Fuster, Conoir and Colonius2014; Fuster Reference Fuster2019). In terms of experimental research, the most representative work is the study of the collapse of cavity arrays by Dear & Field (Reference Dear and Field1988) and Dear, Field & Walton (Reference Dear, Field and Walton1988), where the configurations of the cavity arrays could be controlled using the water–gelatine mixture technique. A schlieren observation of the collapse process of cavity arrays arranged in different configurations showed that the collapse occurred layer by layer, accompanied by the shielding of upstream cavities. Subsequently, Swantek & Austin (Reference Swantek and Austin2010) investigated the collapsing dynamics of a two-cavity longitudinal array and a four-cavity staggered array by using a similar experimental approach as that adopted by Dear & Field (Reference Dear and Field1988), which showed that the characteristics of cavity collapse are very similar regardless of the level of shielding. Bremond et al. (Reference Bremond, Arora, Ohl and Lohse2006) observed the collapse process of the cavity group from the periphery to the centre through the regular arrangement of the cavity array on the plane, which emphasised the importance of the asymmetric collapse effects of the cavity-scale dynamics. Brujan, Ikeda & Matsumoto (Reference Brujan, Ikeda and Matsumoto2012) experimentally monitored the shock wave generation during the collapse of the hemispherical cavity cloud and proposed a collapse model of the cavity group. They suggested that the formation and inward propagation of the pressure wave determines the process of cavity cloud collapse, and the geometric focusing of the wave generates extremely high pressures at the cloud centre during the later stages of cloud collapse. Numerical studies have also been implemented to solve the problem of multicavity evolution (Bui et al. Reference Bui, Ong, Khoo, Klaseboer and Hung2006; Maeda & Colonius Reference Maeda and Colonius2019), although the process is challenging owing to large variations in the temporal and spatial scales (Rasthofer et al. Reference Rasthofer, Wermelinger, Karnakov, Šukys and Koumoutsakos2019). Through the detailed numerical simulation of cavitation cloud collapse, Tiwari (Reference Tiwari2014) and Tiwari, Pantano & Freund (Reference Tiwari, Pantano and Freund2015) investigated the dynamics of collapsing cavity clusters and presented a detailed quantitative analysis of the physical phenomenon, in which the effectiveness of cluster collapse was confirmed as a convergence mechanism. To analyse the interaction between cavities, the collapse problems of arrays with several simply arranged cavities were carefully simulated and analysed in detail (Chahine & Duraiswami Reference Chahine and Duraiswami1992; Betney et al. Reference Betney, Tully, Hawker and Ventikos2015; Apazidis Reference Apazidis2016). For the case of cavities aligned on a tandem array perpendicular to the shock front, the pressure peak of the cavity-tandem collapse can be amplified layer-by-layer when the cavities are suitably arranged (Lauer et al. Reference Lauer, Hu, Hickel and Adams2012; Wermelinger et al. Reference Wermelinger, Hejazialhosseini, Hadjidoukas, Rossinelli and Koumoutsakos2016). Moreover, Bempedelis & Ventikos (Reference Bempedelis and Ventikos2020) proposed that significant levels of focused energy could be obtained by properly setting the relative position and size of the cavity arrays. However, regarding the problem of cavity cluster collapse, the interaction mechanism between the collapse and evolution of complex waves among multiple cavities is yet to be investigated, and a quantitative analysis of the variation in collapse intensity for each cavity in the cluster is lacking.
Shock waves are generally used as the trigger and energy source for the rapid collapse of cavities (Ohl & Ohl Reference Ohl and Ohl2013). The strength of the shock wave may reflect the intensity of the cavity collapse (Bagabir & Drikakis Reference Bagabir and Drikakis2001; Felix, Stefan & Nikolaus Reference Felix, Stefan and Nikolaus2016), and the propagation direction of the shock wave can determine both the deformation direction of the cavity and the direction of the re-entrant microjet (Bourne & Field Reference Bourne and Field1999). The generation of shock waves on a small spatial scale in liquid media can be obtained in several ways, which include high-speed impingement (Field, Lesser & Dear Reference Field, Lesser and Dear1985), explosion (Hung & Hwangfu Reference Hung and Hwangfu2010) and piezoelectric technologies (Sankin et al. Reference Sankin, Simmons, Zhu and Zhong2006). The changes in the shape of the shock front are closely related to the spatial–temporal variations in the shock wave intensity during its propagation (Lapworth Reference Lapworth1959; Jones Reference Jones1963). When a uniform shock wave with a flat wavefront propagates in a homogeneous medium, the strength and shape of the wavefront remain unchanged; this type of wave is called a planar shock wave (Niederhaus et al. Reference Niederhaus, Greenough, Oakley, Ranjan, Anderson and Bonazza2008; Xiang & Wang Reference Xiang and Wang2017). If the initial wavefront is convex, the shock wave expands continuously in space and the strength of the wave gradually decreases during the propagation process; this type of shock wave is called a blast wave (Jeong, Greif & Russo Reference Jeong, Greif and Russo1998; Needham Reference Needham2010). In contrast, if the shape of the wavefront is initially concave, the shock wave tends to converge and the strength of the wave might gradually increase during the convergence process; this is known as a focusing shock wave (Sturtevant & Kulkarny Reference Sturtevant and Kulkarny1976; Apazidis & Lesser Reference Apazidis and Lesser1996).
Different types of shock waves can be generated using different methods. For example, for a water-hammer shock wave generated inside a droplet by high-speed impingement on a solid wall, different shapes of the shock wavefront might be generated owing to different initial relative geometries of the droplet interface and the solid surface (Field, Dear & Ogren Reference Field, Dear and Ogren1989; Wu, Xiang & Wang Reference Wu, Xiang and Wang2018; Wu, Liu & Wang Reference Wu, Liu and Wang2021), as shown in figure 1. If a droplet impacts on a solid surface having a synclastic curvature with the droplet in the impinging region (known as the synclastic curvature surface), a concave shock wave will be generated inside the droplet. The shock wave will gradually strengthen as it propagates inside the droplet. In contrast, if the impacted solid surface has a curvature of direction opposite to that of the droplet (known as an incongruous curvature surface), a convex shock wave will be generated, the strength of which will gradually weaken as it propagates towards the upper-pole of the droplet. In particular, the characteristics of concave focusing shock waves have attracted more attention owing to their strong convergence of energy (Sommerfeld & Müller Reference Sommerfeld and Müller1988; Lokhandwalla & Sturtevant Reference Lokhandwalla and Sturtevant2001). Some researchers have even proposed using a focusing shock wave generated by the impact of a high-speed droplet on solid walls with synclastic curvature as a beneficial condition for triggering nuclear fusion reactions in the future (Ventikos & Hawker Reference Ventikos and Hawker2017). Hence, the impact of a high-speed droplet on a synclastic curvature wall is a remarkable method for generating focusing shock waves, and this focusing shock wave might be employed to trigger cavity collapse to achieve further energy convergence on a small scale. However, studies on the influence of shock waves with different properties on the collapse process of cavity/cavity arrays are scarce and a theoretical prediction of this shock-induced cavity collapse strength is yet to be reported.

Figure 1. Simulation results of the shock front profiles of droplet impingement on (a) a concave surface, (b) a flat surface and (c) a convex surface with an initial velocity of  $150\ \textrm {m}\ \textrm {s}^{-1}$ (Wu et al. Reference Wu, Liu and Wang2021).
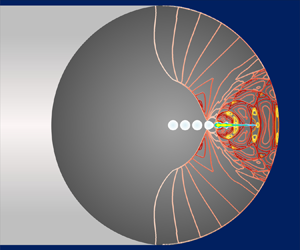
In this study, strong energy concentration in a small space is realised by combining high-speed droplet impingement on a synclastic curvature wall with a  $180^\circ$ constraint and the shock-induced collapse of a tandem cavity for the first time, as shown in figure 2. The energy converging mechanism and major influencing factors are investigated based on the detailed analysis of the dynamic process of flow evolution. The properties of the focusing shock wave and the mechanism of tandem cavity collapse induced by the impact of the focusing shock are revealed, and the effects of the water-hammer shock intensity, cavity properties and interval between the cavity layers on the collapse intensity are numerically investigated. Then, some important parameters that may govern the process are extracted, and a theoretical model is built to appropriately describe and predict the collapse intensity of each cavity in the tandem cavity, which may provide helpful guidance for possible future applications.

Figure 2. Schematic diagram of the physical configuration.
This paper is organised as follows. A physical model for small-scale energy convergence is introduced in § 2, and a mathematical model and numerical method are presented in § 3. Section 4 verifies the grid independence and analyses the properties of the focusing shock wave generated by the high-speed impingement on the droplet. The numerical results of droplets embedded with two different kinds of single cavities are discussed in § 5. In § 6, the evolution mechanism of an embedded tandem cavity is revealed and a theoretical analysis model for predicting the collapse intensity of the tandem cavity is established. The theoretical analysis of the influencing factors for the collapse intensity of the tandem cavity is presented in § 7. Section 8 concludes this paper.
2. Physical model
According to previous studies (Ventikos & Hawker Reference Ventikos and Hawker2017; Wu et al. Reference Wu, Liu and Wang2021), when a droplet impacts on a solid surface with a synclastic curvature, a shock wave with a concave wavefront is generated. In this study, the droplet is set to impact on a tube-shaped solid curved wall and the curvature of the curved part of the wall is equal to the curvature of the droplet interface, as shown in figure 2. The initial interaction area between the droplet and a tube-shaped wall is larger than that for any other shape of a curved wall and the droplet will be  $180^\circ$ constrained by the wall. Based on a previous study (Wu et al. Reference Wu, Liu and Wang2021), there exists a critical contact area between the droplet and the solid wall, which is associated with the strength of the water-hammer shock wave during the high-speed impinging process of the droplet. A larger contact area will result in a stronger intensity of the shock wave. This critical area, in the case of a droplet impinging on a
  $180^\circ$ constrained wall, will be the largest when compared with other different shapes of impacted surfaces. Therefore, if the initial impact velocity
  $V_0$ is fixed, the strength of the water-hammer shock wave inside the droplet arising from the high-speed impingement will be the strongest in the above configuration.
In this study, the initial radius ( $R_0 = 2.5\ \textrm {mm}$) and initial velocity (
 $V_0 = 300\ \textrm {m}\ \textrm {s}^{-1}$) of the droplet were fixed in all cases. In some cases, a series of small cavities was arranged at equal intervals (
 $\varDelta$) along the central axis (
 $y$-axis) within the droplet, as shown in figure 2. Considering the possible formation mechanism of the cavities, the initial radius of the small cavity was set as
  $r_0 = 0.1\ \textrm {mm}$ according to the research by Leppinen, Wang & Blake (Reference Leppinen, Wang and Blake2013) and Wermelinger et al. (Reference Wermelinger, Hejazialhosseini, Hadjidoukas, Rossinelli and Koumoutsakos2016), and the sizes of all the pre-set cavities were the same. The specific physical implementation of a tandem cavity in the present configuration can be referred from Dear & Field (Reference Dear and Field1988), Cui et al. (Reference Cui, Zhang, Wang and Liu2020) and Luo & Niu (Reference Luo and Niu2019). The initial static pressure
  $p_0$ and temperature
  $T_0$ in the flow field were
  $1.01325\times 10^5$ Pa and 300 K, respectively. The droplet was pure liquid water with embedded cavities and was surrounded by air. In the calculations presented here, the initial instant corresponds to the moment when the droplet has just impacted on the wall. This means that the interaction of the droplet with any surrounding medium was not considered before the impact. The size of the computational domain in the
  $y$ direction was 2.4
  $R_0$. The initial thermodynamic states of the fluids in the calculation domain are shown in table 1. The vapour inside the vapour cavity was initially in the saturated state. The Reynolds number (
 $Re = \rho _{l}R_0V_0/\eta$), Weber number (
 $We =\rho _{l}R_0V_0^2/\sigma$) and Froude number (
 $Fr = V_0^2/gR_0$) were
  $8.7\times 10^5$,
  $3.1\times 10^6$ and
  $3.6\times 10^6$, respectively, where
  $\rho _{l}$,
  $\eta$,
  $\sigma$ and
  $g$ represent the initial density of the liquid, liquid dynamic viscosity, surface tension coefficient and gravitational acceleration, respectively. Because
  $Re$,
$Re$,  $We$ and
  $Fr$ were sufficiently large under the calculation conditions considered in this study, the effects of viscosity, surface tension and gravity were negligible. All conditions considered in this study were two-dimensional. To analyse the influence of the axisymmetric effect, the results of the two-dimensional axisymmetric case and two-dimensional planar case are compared in § 7.1.
Table 1. Initial thermodynamic states for fluids in the computation domain.

3. Mathematical model and numerical methodology
In this study, the mathematical model of a compressible two-phase flow under a Eulerian framework was used to describe the high-speed droplet impingement problem. For the case of a vapour cavity contained inside the droplet, the phase change behaviour will manifest during the droplet impingement process. Hence, the phase transition model is further coupled with the original two-phase model to describe the influence of the phase change behaviour. The governing equations are as follows:
 \begin{equation} \left.\begin{gathered} \frac{{\partial {\alpha _k}{\rho _k}}}{{\partial t}} + \boldsymbol{\nabla}\boldsymbol{\cdot} \left( {{\alpha _k}{\rho _k}{\boldsymbol{u}}} \right) = {{\dot{S}}_{\rho ,k}}, \quad k = 1,\ldots,K,\\ \frac{{\partial \left( {\rho {\boldsymbol{u}}} \right)}}{{\partial t}} + \boldsymbol{\nabla}\boldsymbol{\cdot} \left( {\rho {\boldsymbol{u}} \otimes {\boldsymbol{u}} + p{\boldsymbol{I}}} \right) = 0,\\ \frac{{\partial E}}{{\partial t}} + \boldsymbol{\nabla}\boldsymbol{\cdot} \left[ {\left( {E + p} \right){\boldsymbol{u}}} \right] = 0,\\ \frac{{\partial {\alpha _k}}}{{\partial t}} + {\boldsymbol{u}} \boldsymbol{\cdot} \boldsymbol{\nabla} {\alpha _k} = {{\dot{S}}_{\alpha ,k}}, \quad k = 1,\ldots,K - 1, \end{gathered}\right\} \end{equation}
where  $\rho$,
  $p$,
$p$,  ${\boldsymbol {u}}$ and
  $E$ represent the density, pressure, velocity and total energy density, respectively;
  $E = \rho e + \frac {1}{2}\rho {{\boldsymbol {u}}^2}$, where
  $e$ is the internal specific energy of the fluid;
  $\boldsymbol {I}$ is the unit tensor; and
  $\alpha _k$,
  $\rho _k$ and
  $\alpha _k\rho _k$ represent the volume fraction, density and partial density of the component
  $k$, respectively. In the present study, three components – vapour, liquid and air – were considered, for which the subscript
  $k$ has the values 1, 2 and 3, respectively. The saturation constraint of the volume fraction yields
  ${\alpha _K} = 1 - \sum \nolimits _{k = 1}^{K - 1} {{\alpha _k}}$.
Because the interface will spread over a few cells owing to numerical diffusion, the mixed fluid variables in this diffusion region are expressed as shown below (Saurel, Petitpas & Abgrall Reference Saurel, Petitpas and Abgrall2008):
 \begin{gather} \rho = \sum_{k = 1}^K {{\alpha _k}{\rho _k}}, \end{gather}
 \begin{gather}{\boldsymbol{u}} = \left.\left( {\sum_{k = 1}^K {{\alpha _k}{\rho _k}{{\boldsymbol{u}}_k}} } \right)\right/\left( {\sum_{k = 1}^K {{\alpha _k}{\rho _k}} } \right), \end{gather}
 \begin{gather}\rho e = \sum_{k = 1}^K {{\alpha _k}{\rho _k}{e_k}}, \end{gather}
 \begin{gather}p = \frac{{\rho e - \sum\limits_{k = 1}^K {{\alpha _k}{\rho _k}{q_k}} - \sum\limits_{k = 1}^K {\dfrac{{{\alpha _k}{\gamma _k}{p_{\infty ,k}}}}{{{\gamma _k} - 1}}} }}{{\sum\limits_{k = 1}^K {\dfrac{{{\alpha _k}}}{{{\gamma _k} - 1}}} }}. \end{gather}
In the present paper, the fluid thermodynamic state is described by the stiffened gas equation of state (SG-EOS) (Menikoff & Plohr Reference Menikoff and Plohr1989; Saurel et al. Reference Saurel, Petitpas and Abgrall2008), as shown below:
 \begin{gather} {e_k}(p,{\rho _k}) = \frac{{p + {\gamma _k}{p_{\infty ,k}}}}{{{\rho _k}({\gamma _k} - 1)}} + {q_k}, \end{gather}
 \begin{gather}{\rho _k}(p,T) = \frac{{p + {p_{\infty ,k}}}}{{{C_{v,k}}T({\gamma _k} - 1)}}, \end{gather}
 \begin{gather}{h_k}(T) = {\gamma _k}{C_{v,k}} + {q_k}, \end{gather}
 \begin{gather}{g_k}(p,T) = ({C_{v,k}}{\gamma _k} - {q'_k})T - {C_{v,k}}T\log \frac{{{T^{{\gamma _k}}}}}{{{{(p + {p_{\infty ,k}})}^{{\gamma _k} - 1}}}} + {q_k}, \end{gather}
 \begin{gather}{\mu _1}(T,{g_1},{\alpha _1},{\alpha _2}) = {g_1} + ({\gamma _1} - 1){C_{v,1}}T\log \frac{{{\alpha _1}}}{{1 - {\alpha _2}}}. \end{gather}
Here,  ${\gamma _k}$ is the specific heat ratio,
  ${p_{\infty,k}}$ is the material parameter with pressure dimension,
  ${C_{v,k}}$ is the specific heat capacity at constant volume,
  ${q_k}$ is the heat of formation and
  ${q'_k}$ is the entropy constant of the component
  $k$. The corresponding values of these parameters are referred from Han, Hantke & Müller (Reference Han, Hantke and Müller2017), as shown in table 2.
Table 2. Parameters involved in SG-EOS.

The source terms  ${\dot {S}_{\rho,k}}$ and
  ${\dot {S}_{\alpha,k}}$ on the right-hand side of (3.1) are related to the phase transition, which can be respectively expressed as
 $$\begin{gather} {{{\dot{S}}_{\rho ,1}} = \dot{m} = \nu \left( {{\mu _{{2}}} - {\mu _{{1}}}} \right),}\quad {{{\dot{S}}_{\rho ,2}} ={-} \dot{m} = \nu \left( {{\mu _{{1}}} - {\mu _{{2}}}} \right),}\quad {{{\dot{S}}_{\rho ,3}} = 0,} \end{gather}$$
 $$\begin{gather}{\dot{S}_{\alpha ,1}} = \frac{{\dot{m}}}{{{{\varrho }_1}}} = \frac{\nu }{{{{\varrho }_1}}}\left( {{\mu _{{2}}} - {\mu _{{1}}}} \right) ,\quad {{{\dot{S}}_{\alpha ,2}} ={-} \frac{{\dot{m}}}{{{{\varrho }_2}}} = \frac{\nu }{{{{\varrho }_2}}}\left( {{\mu _{{1}}} - {\mu _{{2}}}} \right),} \end{gather}$$
where  $\mu _k$ is the chemical potential and
  $\nu$
$\nu$  $({\geqslant }0)$ is the relaxation parameter for the chemical potential. In this study, the local thermodynamic equilibrium was always assumed at the gas–liquid interface (Saurel et al. Reference Saurel, Petitpas and Abgrall2008), which means that phase transition will occur if one of the phases is metastable at the interface (overheated or subcooled state at the interface) (Le Martelot, Saurel & Nkonga Reference Le Martelot, Saurel and Nkonga2014). Considering the vapour condensation process as an example, the condition that triggers the phase transition of vapour to liquid is determined by the condition
  $p > p_{{sat}}(T)$. Here,
  $p_{{sat}}(T)$ is the saturated pressure at the local temperature
  $T$. As the phase transition condition is fulfilled, an instantaneous relaxation process is used to achieve the local thermodynamic equilibrium (i.e.
  $\mu _1 = \mu _2$) with the phase transition complete. For the current shock-induced vapour cavity collapse accompanied phase transition process, as the (kinetic) energy levels are much larger compared to the latent heat associated with the liquid–vapour transition, the assumption of the instantaneous relaxation is reasonable in this system. Therefore, the relaxation parameter
  $\nu$ can be taken as infinite when the phase transition condition is satisfied; otherwise, it is zero. This makes the present model free of empirical parameters. The specific expression for
  $\varrho _k$ can be found in Zein, Hantke & Warnecke (Reference Zein, Hantke and Warnecke2010, Reference Zein, Hantke and Warnecke2013).
In the present study, the governing equation (3.1) was solved using the finite volume method and the splitting approach was applied; accordingly, the hyperbolic operator and the source terms related to the phase transition were solved separately. A fifth-order incremental stencil weighted essentially non-oscillatory (WENO-IS) scheme was applied for the spatial reconstructions (Wang, Xiang & Hu Reference Wang, Xiang and Hu2018) to ensure computational stability. A Godunov-type Harten–Lax–van Leer contact (HLLC) approximate Riemann solver (Toro Reference Toro2013) was used to solve the numerical flux at the edges of the cells. By referring to Han et al. (Reference Han, Hantke and Müller2017), the source terms on the right-hand side of (3.1) were treated by a chemical relaxation procedure. A third-order total variation diminishing Runge–Kutta scheme (Gottlieb & Shu Reference Gottlieb and Shu1998) was used for time marching.
This study mainly explored the physical mechanism underlying the fluid dynamic behaviour of the impingement procedure of a high-speed droplet with embedded cavities, but neglected the analysis of coupling with the solid structure. The immersed boundary method was employed for the non-flat solid wall (Mittal & Iaccarino Reference Mittal and Iaccarino2004). Only half of the region was considered because the configuration of the computational domain was symmetric with the axis of symmetry ( $y$-axis). The symmetric boundary was considered along the
  $y$-axis, whereas the top boundary in the computational domain was specified as the non-reflection boundary (Thompson Reference Thompson1990). Uniform grids were employed in the simulation and there were initially 4000 grid cells per droplet diameter. The Courant–Friedrich–Lewis number was set to 0.4 for all the computations.
4. Numerical verification
The grid sensitivity was analysed through numerical simulations of two problems: (1) high-speed impingement of a pure water droplet without the embedded cavity and (2) single cavity collapse induced by a planar shock wave. In each problem, the grid sensitivity was analysed using three different grid resolutions: the grid cells per  $R_0$ corresponded to (I) 1000, (II) 2000 and (III) 3000.
4.1. High-speed impingement of pure droplet
First, the impingement of an initial dense droplet without a cavity was numerically simulated and the grid-independence was verified. When the high-speed droplet impinges on the tube-shaped  $180^\circ$ constrained wall, a concave shaped shock wave is generated, which propagates towards the normal direction of the curved wall.
The numerical results of the dense droplet impingement on the  $180^\circ$ constrained solid wall for three different grid resolutions are displayed in figure 3. The distributions of the colour bar are linear in this study. The initial instant (
 $t/(R_0/c_{{l\_0}}) = 0.0$) corresponds to the moment when the droplet has just impacted on the wall, where the centre of the droplet (
 $O_{{d}}$) overlaps with the centre of the bottom semi-circular wall (
 $W$), as shown in figure 2. Figure 3(a) shows the results at the instant
  $t/(R_0/c_{{l\_0}}) = 0.5$, and figure 3(b) shows the results at the instant
  $t/(R_0/c_{{l\_0}}) = 1.0$, where
  $c_{{l\_0}}$ is the initial speed of sound in the liquid water. The grid cells per column diameter correspond to (I) 2000, (II) 4000 and (III) 6000. The curves of the maximum pressure (
 $p_{{max}}$) of the entire impact process under three different grid resolutions are depicted in figure 4(a).

Figure 3. Numerical results of the pressure contours (left) and the schlieren image (right) of the impingement of a 5 mm water column on a tube-shaped  $180^\circ$ constrained wall with an initial speed of
  $300\ \textrm {m}\ \textrm {s}^{-1}$ at (a)
  $t/(R_0/c_{{l\_0}}) = 0.5$ and (b)
  $t/(R_0/c_{{l\_0}}) = 1.0$ under three different grid resolutions, denoted as I, II and III. By referring to the nonlinear wave propagation theory of Whitham & Fowler (Reference Whitham and Fowler1975), the trajectory of the points on the wavefront at the corresponding time instant is indicated (red curves with arrows).

Figure 4. Maximum pressure profiles during the entire impact process and linear theoretical prediction results of the strength of the focal shock wave: (a) two-dimensional planar case and (b) two-dimensional axisymmetric case for three different grid resolutions.
By comparing the numerical results, it can be seen that the simulated results under the three grid resolutions are similar. Owing to the relatively low resolution of grid level I, the wavefront of the water-hammer shock wave shown in figure 3 is slightly thicker than that of the other two resolutions; slight deviations are also observed in grid level I for the pressure curve in figure 4(a). Although the results of the other two higher grid resolutions are very similar, grid level II was chosen in the present study to balance the computational efficiency and resolution. Furthermore, as shown in figure 4(b), the grid independence verification results for the two-dimensional axisymmetric cases are quite similar to those for the two-dimensional planar cases.
At the instant of initial impingement, a water-hammer shock wave with a semi-circular wavefront is generated inside the droplet; the initial curvature of the wavefront is  $1/R_0$. As the shock wave propagates in the normal direction of the wavefront, the wavefront curvature increases. According to the linear theory (Lesser Reference Lesser1981), the amplitude of the wave is inversely proportional to the square root of the area of the wavefront; hence, the relation between the strength of this curved shock wave and its curvature for the three-dimensional spherical wavefront is
 \begin{equation} p_{{s}}^{3{{D}}}(t) = \frac{{{R_{{{shock}}}}({t_0})}}{{{R_{{{shock}}}}(t)}}{p_{{s}}}({t_0}), \end{equation}
where  $p_{{s}}(t)$ is the pressure after the shock front and
  $R_{{shock}}(t)$ is the curvature of the shock front at instant
  $t$. In the two-dimensional case (or the cylindrical wavefront), the relation is then formulated as
 \begin{equation} p_{{s}}^{2{{D}}}(t) = \sqrt {\frac{{{R_{{{shock}}}}({t_0})}}{{{R_{{{shock}}}}(t)}}} {p_{{s}}}({t_0}). \end{equation}
In the present study,  $p_{{s}}(t_0)$ is the water-hammer pressure at the instant of initial impingement instant, which is proportional to the initial impingement velocity normal to the wall. According to (4.2),
  $p_{{s}}(t)$ gradually increases when the concave-shaped shock wave propagates along the normal direction during the convergence stage (called the focal shock wave here). Here,
  $p_{{s}}(t)$ might reach its largest value at the focal position. Thereafter, the shock wave will change to a convex shape and expand outwards along the opposite of the normal direction of the wavefront, with its strength gradually decreasing (known as the blast shock wave).
As shown in figure 2, the different impact points  $A$ correspond to different initial impact angles
  $\theta$ as well as the different component velocities in the normal direction of the wall. According to the formula of the water-hammer pressure for liquid column impingement (Huang Reference Huang1973), the initial impinging water-hammer pressure at different impact points can be expressed as
 \begin{equation} p_{{s}}^\theta ({t_0}) = {\rho _{{l}}}V_0^\theta ({c_{{{l\_0}}}} + \chi V_0^\theta ) = {\rho _{{l}}}{V_0}\cos \theta ({c_{{{l\_0}}}} + \chi {V_0}\cos \theta ), \end{equation}
where  $\chi$ is a constant that depends on the liquid property, which is usually taken as 2.0 for liquid water (Heymann Reference Heymann1969). Hence, the initial impinging water-hammer pressure related to different impact angles
  $\theta$ is different and the strongest
  $p_{{s}}^\theta ({t_0})$ relates to the bottom impinging point of the droplet, where
  $\theta = 0^\circ$. Hence, the strength of the focal shock wave is distributed non-uniformly on the concave wavefront. As the shock wave propagates, the changing trend of its strength can be theoretically predicted using (4.2), where the strength of the shock wave increases as it gradually converges. The strongest
  $p_{{s}}$ is always related to the bottom point of the shock front that propagates along the
  $y$-axis; it is the highest pressure (
 $p_{{max}}$) in the entire flow field during the converging stage of the shock wave in the present case. The profiles of
  $p_{{max}}$ during the entire impact process and the linear theoretical prediction results of
  $p_{{s}}^{\theta = 0^\circ }(t)$ for both the two-dimensional planar (2-D-planar) and the two-dimensional axisymmetric (2-D-axisymmetric) cases are shown in figure 4(a,b), respectively. The numerical results and linear predicted results of the initial strength and variation trend of the shock wave are consistent, but deviation appears as the shock wave gradually focuses.
As shown in figure 4, the deviation between the numerical and theoretical results gradually appears with increase in the shock wave intensity. For both the 2-D-planar and 2-D-axisymmetric cases, an obvious deviation can be observed when the maximum pressure value is higher than  $1 \times 10^4$
  $p_0$, corresponding to the time period of
  $t/(R_0/c_{{l\_0}})\in [0.75, 1.25]$ in the 2-D-planar case and the time period of
  $t/(R_0/c_{{l\_0}})\in [0.5, 1.25]$ in the 2-D-axisymmetric case. This stage is called the focal stage in this paper. Owing to the strong nonlinear effect in the focal region of the shock wave, the strength of the wave can no longer be accurately described by the linear theory (Keller Reference Keller1954). By referring to Whitham's nonlinear theory (Whitham Reference Whitham1957; Whitham & Fowler Reference Whitham and Fowler1975; Whitham Reference Whitham2006) a schematic diagram of the trajectories of the points on the wavefront is presented in figure 3, where the effect of the wave speed changes when the wave amplitude is considered. In addition, the shape of the evolution curve of the maximum pressure obtained from the numerical results in the present study (as shown in figure 4) is consistent with the experimental results of the focal shock wave reported in a previous study (Sturtevant & Kulkarny Reference Sturtevant and Kulkarny1976). In the 2-D-planar case, the peak pressure is approximately 2.5 times that of the water-hammer pressure generated by the initial impact and it is more than 4 times in the 2-D-axisymmetric case. Wave reflection occurs when the shock wave propagates to the upper interface of the droplet. The reflected waves are rarefaction waves, which reduce the pressure inside the droplet. This process may also be reflected in the profile of the maximum pressure. As shown in figure 4, a sudden drop is observed at approximately
  $t/(R_0/c_{{l\_0}}) = 1.6$ in the 2-D-planar case and at approximately
  $t/(R_0/c_{{l\_0}}) = 1.4$ in the 2-D-axisymmetric case, which corresponds to the reflection of the shock wave in the maximum pressure curve.
4.2. Single cavity collapse induced by a planar shock wave
The grid independence verification of planar shock-induced cavity collapse corresponding to the two-dimensional planar configuration was additionally performed. The strength of the planar shock wave is equal to  $p_{{s}}^{\theta = 0^\circ }({t_0})$. This is the initial strength of the shock wave at the bottom impinging point of the droplet, as discussed in § 4.1. The initial radius of the vapour cavity is
  $r_0$. The grid cells per cavity diameter correspond to (I) 80, (II) 160 and (III) 240. As shown in figure 5, the simulation results of the planar shock-induced vapour cavity collapse process are presented for three different grid resolutions. By referring to Tiwari, Freund & Pantano (Reference Tiwari, Freund and Pantano2013), the density schlieren image is also shown at the instant when the lower-half interface of the cavity (LIC) begins to interact with the upper-half interface of the cavity (UIC). Further, the temporal variations in the maximum pressures for the three resolutions are compared in figure 6. During the interaction process between LIC and UIC, the fluid pressure increases dramatically owing to the high-speed impact; this is called the water-hammer pressure (Huang Reference Huang1973). The numerical results of the water-hammer pressure (
 $p_{{wh}}$) at the impact point when the LIC begins to interact with the UIC for three different grid resolutions are also shown in figure 6.

Figure 5. Numerical results of the pressure contours (left) and the schlieren image (right) of the planar shock induced vapour cavity collapse at (a)  $t/(r_0/c_{{l\_0}}) = 13.3$, (b)
  $t/(r_0/c_{{l\_0}}) = 15.0$, (c)
  $t/(r_0/c_{{l\_0}}) = 16.4$ and (d)
  $t/(r_0/c_{{l\_0}}) = 19.5$ for three different grid resolutions, denoted as I, II and III.

Figure 6. Temporal variation of maximum pressure during the cavity collapse process and the numerical results of  $p_{{wh}}$ for three different grid resolutions.
As shown in figure 5, the major deformation and collapse behaviours of the cavity can be captured for all the three grid resolutions. As the peak pressure can be significantly affected by the local collapse of the cavity (Hawker & Ventikos Reference Hawker and Ventikos2012), this point-wise value is a highly fluctuating quantity and is difficult to be accurately captured (Rasthofer et al. Reference Rasthofer, Wermelinger, Karnakov, Šukys and Koumoutsakos2019). However, as shown in figure 6, the values of  $p_{{wh}}$ under the three grid resolutions are very close. Here,
  $p_{{wh}}$ is physically interpreted as the impact intensity when the microjet penetrates the cavity, which can be directly associated with the characteristic phenomenon during the asymmetric cavity collapse. Therefore, the value of
  $p_{{wh}}$ is considered to describe the cavity collapse intensity in this study. As shown in figure 6, the value of
  $p_{{wh}}$ can be effectively captured in all the three grid resolutions. After comparing the numerical results for the different grid resolutions, the resolution of grid level II was finally chosen in the present study, as it was sufficient for studying the problems analysed here. Regarding the validation of the phase transition model and its numerical procedures, a Rayleigh collapse problem, including the phase transition, has been considered in a previous work (Wu et al. Reference Wu, Wang and Xiang2019), which shows that the present mathematical model and numerical procedure can satisfactorily solve the vapour bubble collapse accompanying the phase transition.
5. Impingement of droplet with one central cavity
If cavities exist during the propagation of the shock wave, part of the wave energy will be absorbed by the cavities, which will cause them to collapse; this may cause significant amplification of the local maximum pressure (Hawker & Ventikos Reference Hawker and Ventikos2012). To realise local energy convergence from the interaction of the shock wave and cavity, a small cavity was pre-set at the centre of the droplet in the basic configuration depicted in § 4, where the initial radius of the cavity was set as  $r_0 ({=}0.04\, R_0)$, as discussed in § 2. As air cavities and vapour cavities are the two most common cavities in the natural environment (Brennen Reference Brennen1995), each type of cavity was arranged at the centre of the droplet in this study. The evolution mechanism and characteristics of the two types of cavities are discussed and compared to analyse the effect of local energy convergence arising from cavity collapse.
Figures 7(a1–d1) and 7(a2–d2) display the numerical results of water column impingement on the  $180^\circ$ constrained wall, where an air cavity and a vapour cavity with an initial radius of
  $r_0 = 0.1\ \textrm {mm}$ are initially embedded at the centre of the droplet. As shown in figure 7, in both cases, the focus shock wave interacts with the cavity and then a circular blast shock wave is generated after the cavity collapses. The strengths of the shock waves generated by the cavity collapse in the two cases are very close, although the initial cavities are different.

Figure 7. Numerical results of the pressure contours (left) and the schlieren image (right) of water column impingement on the tube-shaped  $180\,^\circ$ constrained wall; the water column is initially embedded with (1) an air cavity and (2) a vapour cavity. The contours in the two rows correspond to the same time instants: (a)
  $t/(R_0/c_{{l\_0}}) = 0.5$; (b)
  $t/(R_0/c_{{l\_0}}) = 0.8$; (c)
  $t/(R_0/c_{{l\_0}}) = 0.9$ and (d)
  $t/(R_0/c_{{l\_0}}) = 1.1$.
To further analyse and compare the two types of cavity collapse mechanisms in detail, figure 8 presents an enlarged view of the collapse process of the embedded cavity in both cases. As seen from the contours of the modulus of velocity ( $| {\boldsymbol {u}} |$), the liquid behind the cavity interface will be accelerated rapidly after the shock wave acts on the cavity and then the re-entrant jet may be generated. However, different distributions of
  $| {\boldsymbol {u}} |$ can be observed for the gas flow field inside these two types of cavities. As shown in figure 8(b), a region of increasing pressure, induced by the acceleration of the transmitted shock wave, is observed inside the air cavity, whereas no pressure increase is observed in the vapour-filled cavity, as the vapour may condense into liquid instantaneously to maintain the thermodynamic equilibrium at the interface, yielding the phase transition model. In addition, the remaining cavity geometries and collapsing wave distributions are different in these two cases at the instant the LIC interacts with the UIC, as shown in figure 8(c).

Figure 8. Enlarged view of the numerical results of the embedded cavity evolution process in (1) air cavity and (2) vapour cavity. The contours in both cases are related to the same time instants: (a)  $t/(R_0/c_{{l\_0}}) = 0.78$; (b)
  $t/(R_0/c_{{l\_0}}) = 0.82$; (c)
  $t/(R_0/c_{{l\_0}}) = 0.86$ and (d)
  $t/(R_0/c_{{l\_0}}) = 0.92$. In each panel, the contours of the modulus of velocity (
 $| {\boldsymbol {u}} |$) and the pressure isolines are plotted.
Figure 9 shows a schematic of the evolution process of both the air cavity (the upper row) and the vapour cavity (the lower row) from the instant corresponding to figure 8(b) to the instant corresponding to figure 8(c). In the case of an air cavity (figure 9a1–d1), once the shock wave interacts with the LIC, a transmitted shock wave is generated, which accelerates the gas inside the air cavity. When this transmitted shock wave propagates to the UIC, it is reflected and transmitted again at the interface and evolves into a reflected shock wave propagating in the cavity, and the transmitted compression waves propagate in the liquid. Then, the transmitted waves continue to travel back and forth in the cavity, accompanied by transmission and reflection on the interface until the LIC interacts with the UIC. In the case of the vapour cavity (figure 9a2–d2), the local thermodynamic state of the vapour inside the cavity may change under the impact of the shock wave; when the local vapour pressure is higher than the saturated value, the vapour will rapidly condense into liquid water. Therefore, under the impact of the shock wave, the vapour cavity gradually condenses and shrinks, and no transmission wave appears inside the cavity, which is very different from the case of the air cavity.

Figure 9. Schematic diagram of shock wave interaction with the air cavity (upper row)/vapour cavity (lower row).
To more clearly understand the dynamic mechanism of the collapsing wave generation process, partially enlarged views of the black dotted square in figure 9, depicting the process of interaction between the LIC and UIC, are shown in figures 10(a) and 10(b). In addition, figure 10(c) shows the profiles of the maximum pressure ( $p_{{max}}$) of the entire droplet impingement process under the condition of two different initial cavities; the results of the case of a dense droplet without a cavity are also plotted for comparison.

Figure 10. Partially enlarged view of the process of LIC interaction with UIC: (a) air cavity; (b) vapour cavity and (c) curve of the maximum pressure ( $p_{{max}}$) in the entire droplet impingement process and the theoretically estimated value of
  $p_{{wh}}$ for cavity collapse.
Owing to the different curvatures of the UIC and LIC, the first interaction area between the UIC and LIC at the initial instant of interaction will be limited to one point ( $P$). The first compression wavelet is generated from point
  $P$ owing to the high relative speed of the liquid from the two sides (the velocity of the re-entrant jet,
  $v_{{j}}$, can reach the order of
  $1000\ \textrm {m}\ \textrm {s}^{-1}$). As the impact continues, the ends of the interaction area (
 $P$ and
  $P'$) expand laterally, and the expansion velocity of these end-points gradually decreases owing to the relative geometric relation between the outlines of the UIC and LIC. Owing to the acoustic limit (Lesser Reference Lesser1981), there is a critical instant when the expansion velocity of the interaction points is equal to the local sound speed, at which
  $\mathop{{PP^{\prime}}}\limits^\frown$ is the critical arc length of the impinging area. It is too late for the wavelets generated prior to that instant to propagate to the newly generated interaction point and the envelope of these continuously generated compression wavelets constitutes the water-hammer shock wavefront. After the critical instant, the water-hammer shock wave passes the end-points and the newly generated compression wavelet cannot catch-up with the shock wavefront. The curvature ratio between the UIC and the head of the re-entrant jet will significantly affect the critical arc length of
  $\mathop{{PP^{\prime}}}\limits^\frown$. In the case of the air cavity, because the curvature ratio between the UIC and the head of the re-entrant jet is very large, the expansion velocity of
  $P$ decreases rapidly after the impact. Therefore, as the critical
  $\mathop{{PP^{\prime}}}\limits^\frown$ is very short, a series of compression wavelets rather than an obvious shock wave is generated at the initial impingement stage, as shown in figure 10(a); a similar distribution of the collapsing wavelets was also observed by Hawker & Ventikos (Reference Hawker and Ventikos2012) and Wermelinger et al. (Reference Wermelinger, Hejazialhosseini, Hadjidoukas, Rossinelli and Koumoutsakos2016). However, a collapsing shock wave may still be formed by the subsequent catch-up and overlay of these wavelets at a later stage, as shown in figure 8(d1). In the case of the vapour cavity, because the curvatures of the head of the re-entrant jet and UIC are close, the critical
  $\mathop{{PP^{\prime}}}\limits^\frown$ is much longer. Hence, an obvious water-hammer shock wave will be directly generated owing to the re-entrant jet impaction on the UIC, as shown in figure 10(b); the generation of this shock wave was also observed in the experiment by Sankin et al. (Reference Sankin, Simmons, Zhu and Zhong2006).
The local fluid pressure will increase dramatically owing to the high-speed impact between LIC and UIC, which is the so-called water-hammer pressure (Huang Reference Huang1973). By referring to the previous study (Heymann Reference Heymann1969), when the high-speed liquid with a curved interface impacts on surfaces with different curvatures, the interaction area grows as the impact continues. Initially, the speed of outward expansion of the interaction area will exceed the propagation velocity of the water-hammer shock wave generated by the high-speed impact. During this period, the distribution of the water-hammer pressure in the interaction area is non-uniform, where the maximum pressure appears at the edge of the interaction area. An instantaneous pressure peak might appear at the critical instant when the water-hammer shock wave just exceeds the expanding speed of the end-points of the interaction area. As discussed above, the collapse mechanisms of the two types of cavities are different. In the case of a vapour cavity, the critical instant appears relatively later and the critical  $\mathop{{PP^{\prime}}}\limits^\frown$ is longer in the case of the vapour cavity than in the case of the air cavity. Hence, the related local peak pressure generated during the initial stage of the interaction between the LIC and UIC in the case of the vapour cavity will be larger than that in the case of the air cavity, as shown in figure 10(c).
However, because the peak pressure is strongly dependent on the local flow field, this value cannot represent the overall intensity of the collapsing waves. In fact, after the interaction between the LIC and UIC, the compression wavelets generated by the air cavity collapse may gradually catch-up and overlap with each other, and a collapsing shock wave is finally formed; subsequently, the collapsing shock waves in these two cases have similar strengths, as shown in figure 8(d). Figure 10(c) also shows that although the peak pressure values in these two cases are very different during the initial stage of the interaction between the LIC and UIC, the maximum pressure profiles mostly overlap with the profiles of the later processes ( $t/(R_0/c_{{l\_0}}) > 0.95$). This suggests that the strengths of the shock wave in these two cases gradually tend to equalise as the shock wave gradually expands in the droplet. The numerical results of the water-hammer pressure (
 $p_{{wh}}$) at the impact point when the LIC begins to interact with the UIC in both cases are also presented in figure 10(c). The values of
  $p_{{wh}}$, which are used to describe the cavity collapse intensity in this study, are very close to each other in both cases. Therefore, the intensity of cavity collapse under the two working conditions can be analysed using the same theoretical expression.
The intensity of cavity collapse is analysed by expressing the relationship between the strength of the initial shock wave acting on the cavity and the strength of the collapsing wave. By referring to a previous theoretical study on the spherically symmetric collapse of a (vapour) cavity, which is also called Rayleigh collapse (Brennen Reference Brennen1995), the cavity collapse time can be estimated using the following equation:
 \begin{equation} {t_{{{collapse}}}} = {C_{{s}}}{r_0}\sqrt {\frac{{{\rho _{{l}}}}}{{{p_{{s}}} - {p_{{g}}}}}}, \end{equation}
where  $p_{{s}}$ is the surrounding pressure,
  $p_{{g}}$ is the pressure inside the cavity,
  $r_0$ is the initial radius of the cavity and
  $C_{{s}}$ is a constant equal to 0.915 for Rayleigh collapse. For the shock-induced cavity collapse, a similar expression for the cavity collapse time as in (5.1) can be estimated (Ohl, Klaseboer & Khoo Reference Ohl, Klaseboer and Khoo2015), where
  $p_{{s}}$ can be regarded as the pressure behind the shock front when the shock wave interacts with the cavity. In this study, because the size of the cavity is very small relative to that of the droplet, it can be assumed that the pressure is mostly uniform behind the shock front at the region where the shock wave interacts with the cavity. In addition, as the cavity is always located on the central axis (
 $y$-axis), it can be considered that
  $p_{{s}}$ is approximately equal to the intensity of the wave front at the central axis (i.e.
  $p_{{s}}^{\theta = 0^\circ }$). Here,
  $C_{{s}}$ was set as
  $C_{{s}}^{{{planar}}} = \sqrt {2}$ and
  $C_{{s}}^{{{axisymmetric}}} = \sqrt [6]{2}$ for the 2-D-planar and 2-D-axisymmetric configurations, respectively; the detailed fitting process is described in Appendix A. Because
  $p_{{g}}$ is much smaller than
  $p_{{s}}$, the influence of
  $p_{{g}}$ on the collapse time is negligible regardless of whether air or vapour is embedded in the cavity. According to the water-hammer theory (Huang Reference Huang1973; Johnsen & Colonius Reference Johnsen and Colonius2009), the average water-hammer pressure inside the droplet arising from the impingement of the LIC and UIC can be estimated as
 \begin{equation} {p_{{{wh}}}} = \frac{{{\rho_{{l}}}{c_{{l}}}}}{{{\rho _{{l}}}{c_{{l}}} + {\rho _{{l}}}{c_{{l}}}}}{\rho _{{l}}}{c_{ {l}}}\left| {{\bar{v}_{{j}}} - {v_{{u}}}} \right| = \frac{1}{2}{\rho _{{l}}}{c_{{l}}}\left| {{\bar{v}_{{j}}} - {v_{{u}}}} \right|, \end{equation}
where  $v_{{u}}$ is the velocity of the liquid at the UIC and
  $\overline {{v_{{j}}}}$ is the average velocity of the re-entrant jet. Assuming that the state of the liquid at the UIC is not affected by the shock wave,
  $v_{{u}} = V_0$, the average velocity of the re-entrant jet can be roughly estimated as
 \begin{equation} {\bar{v}_{{j}}} = \frac{{{C_{{j}}}{r_0}}}{{{t_{{{collpase}}}}}}, \end{equation}
where  $C_{{j}}$ is the coefficient of the jet velocity. In the previous studies(Klaseboer et al. Reference Klaseboer, Turangan, Fong, Liu, Hung and Khoo2006; Ohl et al. Reference Ohl, Klaseboer and Khoo2015), the value of
  ${C_{{j}}}/{C_{{s}}}$ is assumed to be
  $2 \sim 3$ for the axisymmetric case. In this study, through the comparison between the theoretical and numerical results of
  $p_{{wh}}$ (as shown in figure 10c),
  $C_{{j}}$ was set as 2.4, where the values of
  ${C_{{j}}}/{C_{{s}}}$ are approximately 1.70 for the 2-D-planar configuration and approximately 2.14 for the 2-D-axisymmetric configuration. The theoretical estimation of the average water-hammer pressure (
 $p_{{wh}}$) obtained from (5.2) is shown in figure 10(c) (the black solid point), where the values of
  $p_{{wh}}$ are the same for the two different cavities. The value of
  $p_{{wh}}$ can be used to estimate the intensity of cavity collapse.
During the propagation of the shock wave, the existence of a cavity can be regarded as a way to absorb the partial energy of the shock wave and then centrally release the absorbed energy through cavity collapse. In this way, the peak pressure in the flow field can be significantly amplified locally.
6. Impingement of droplet with cavities in a tandem array
6.1. Physical mechanism of tandem cavity collapse
As shown in figure 7, although the shock energy is partially absorbed by the cavity at the centre of the droplet, a significant shock wave propagates to the downstream flow field inside the droplet after passing through the cavity. Therefore, more than one cavity was pre-set in the droplet for better absorption of the shock energy and further amplification of the peak pressure. According to previous studies on different cavity distributions, further amplification of the pressure may occur when the shock wave acts on the cavity tandemly aligned along the direction of the shock wave propagation (Lauer et al. Reference Lauer, Hu, Hickel and Adams2012; Wermelinger et al. Reference Wermelinger, Hejazialhosseini, Hadjidoukas, Rossinelli and Koumoutsakos2016). To investigate the interaction mechanism and the pressure amplification effect between the cavities, the high-speed impinging droplet embedded with a tandem cavity along the central axis ( $y$-axis) was studied using the basic configuration in § 4, where the initial size of the cavity was always fixed at
  $r_0 = 0.1\ \textrm {mm}$.
As an important influencing factor, the cavity number can be changed in the study. Similar to the configuration used by Wermelinger et al. (Reference Wermelinger, Hejazialhosseini, Hadjidoukas, Rossinelli and Koumoutsakos2016), ten vapour cavities of the same size ( $r_0 = 0.1\ \textrm {mm}$) and at equal intervals ((
 $\varDelta = 0.5$
  $r_0$) were initially tandemly arranged along the
  $y$-axis at [
 $0, R_0$] inside the droplet in the simulation. This tightly arranged tandem cavity is expected to absorb the shock energy more effectively. The numerical results of high-speed impingement of the droplet embedded with the tandem cavity are presented in figure 11. The corresponding results of the space–time diagrams of the pressure and vertical component of the velocity (
 $v$) along the
  $y$-axis are shown in figure 12. The results show that except for the first layer of the tandem cavity (the cavity closest to the bottom wall), which is affected only by the initial shock wave generated by droplet impaction, the other nine cavities are all affected by more than one shock wave as they collapse. For example, the second layer cavity is affected by both the initial shock wave and the shock wave generated by the collapse of the cavity in the first layer, as shown in figure 12(b). In addition, as the shock wave generated by the cavity collapse is a blast shock wave, it will act on the cavity in the next layer and expand towards the curved solid wall. Once the blast shock wave propagates to the solid wall, wave reflection will occur. The reflected shock wave will propagate towards the upper interface of the droplet. As shown in figure 11, along with the successive collapse of the tandem cavity, a netted shock wave system appears owing to the interweaving of the collapsing and reflected shock waves. This netted shock wave system can also be recognised from the space–time diagrams of the droplet's central axis, as shown in figure 12. There is always a lumpy area of velocity increase during the collapse process of each cavity (related to the generation of the re-entrant jet) and a banded area of pressure increase after the collapse of each cavity (related to the generation of the collapsing shock wave).

Figure 11. Numerical results of the pressure contours (left) and the schlieren image (right) of water column impingement on the tube-shaped  $180^\circ$ constrained wall, which are initially embedded with ten vapour cavities arranged along the central axis (
 $y$-axis). The contours are related to the time series: (a)
  $t/(R_0/c_{{l\_0}}) = 0.04$; (b)
  $t/(R_0/c_{{l\_0}}) = 0.18$; (c)
  $t/(R_0/c_{{l\_0}}) = 0.28$; (d)
  $t/(R_0/c_{{l\_0}}) = 0.50$; (e)
  $t/(R_0/c_{{l\_0}}) = 0.76$; (f)
  $t/(R_0/c_{{l\_0}}) = 0.84$; (g)
  $t/(R_0/c_{{l\_0}}) = 0.90$ and (h)
  $t/(R_0/c_{{l\_0}}) =1.12$.

Figure 12. (a-1) Schematic diagram, and space–time diagrams of (a-2) the pressure and (b) vertical-component velocity  $v$ along the
  $y$-axis for the case of a water column embedded with ten vapour cavity impingements on the
  $180^\circ$ constrained wall.
Meanwhile, as shown in figure 12, the strengths of both the collapsing wave and the re-entrant jet show a layer-by-layer increasing trend along with the successive collapse of the tandem cavity. In addition, it can be observed from the space–time diagrams that the collapse time ( $t_{{{collapse}}}^n$) of the cavities shows a gradually decreasing trend from one layer to the next. To analyse the influence mechanism of the cavity collapse of each layer in detail, the step-by-step results of the evolution of a middle layer cavity is discussed. Figure 13 shows the partially enlarged views of the numerical results of the evolution of the cavity in layer six for both the cases of (1) tandem air cavities and (2) vapour cavities. As shown in figure 13(a), the initial water-hammer shock wave first propagates to this cavity and the lower half of the cavity is compressed into a nose shape under the influence of
  $p_{{s}}^{{6}}$. Then, after the collapse of the cavity in the
  $5\textrm {{th}}$ layer, the associated collapsing shock wave is generated and the pressure value behind this collapsing shock front when it propagates to the cavity of layer six is
  $p_{{{collapse}}}^{{5}}$, as shown in figure 13(c). As the collapsing shock wave further expands outwards, it will interact with the remaining cavities as its strength gradually decreases. In other words, the evolution of the cavity in each layer might be influenced by the collapsing waves generated from the collapse of all the previous cavity layers. However, as shown in figure 13(d), the major influencing factor among these collapsing waves should correspond to the collapsing wave generated from the last (nearest) layer, as the other collapsing waves originating from the previous (farther) layers are comparatively much weaker when they propagate to the current layer. As shown in figure 13(c–e), after the interaction of the collapsing waves, the cavity in the sixth layer gradually deforms inwards and the re-entrant jet forms towards the UIC of the cavity. Finally, the LIC interacts with the UIC and the collapsing shock wave of the cavity in the sixth layer is generated, which will also expand outwards and interact with the remaining cavities, as shown in figure 13(e,f). These similar processes successively proceed until the cavity in the last layer collapses, as shown in figure 13(g). Further, as the tandem cavity collapse procedures are very similar in both cases, a schematic diagram applicable to both cases for the collapse process of the cavity in the layer
  $n$ is depicted in figure 14. Moreover, as shown in figure 13, the re-bound and re-collapse phenomena are observed after the collapse of each cavity (especially in the case of the air cavity), where the cavity re-bound and re-collapse processes might be accompanied by the phase transition behaviour. However, as these processes have little effect on the current issues and results, they are not discussed here in detail.

Figure 13. Enlarged views of the numerical results of water column impingement on the  $180^\circ$ constrained wall, which are initially embedded with (1) ten air cavities and (2) ten vapour cavities. The contours in the first row are related to the time series: (a-1)
  $t/(R_0/c_{{l\_0}}) = 0.497$; (b-1)
  $t/(R_0/c_{{l\_0}}) = 0.526$; (c-1)
  $t/(R_0/c_{{l\_0}}) = 0.535$; (d-1)
  $t/(R_0/c_{{l\_0}}) = 0.582$; (e-1)
  $t/(R_0/c_{{l\_0}}) = 0.602$; (f-1)
  $t/(R_0/c_{{l\_0}}) = 0.612$ and (g-1)
  $t/(R_0/c_{{l\_0}}) =0.893$. The contours in the second row are related to the time series: (a-2)
  $t/(R_0/c_{{l\_0}}) = 0.496$; (b-2)
  $t/(R_0/c_{{l\_0}}) = 0.527$; (c-2)
  $t/(R_0/c_{{l\_0}}) = 0.537$; (d-2)
  $t/(R_0/c_{{l\_0}}) = 0.576$; (e-2)
  $t/(R_0/c_{{l\_0}}) = 0.605$; (f-2)
  $t/(R_0/c_{{l\_0}}) = 0.614$ and (g-2)
  $t/(R_0/c_{{l\_0}}) = 0.899$. In each panel, the contours of the modulus of velocity (
 $| {\boldsymbol {u}} |$) and the pressure isolines are plotted.

Figure 14. Schematic of several typical instants during the collapse process of the cavity in the layer  $n$. The arrows indicate the direction of propagation of the corresponding flow structures.
6.2. Theoretical analysis of tandem cavity collapse
Based on the above discussion, for the tandem cavity evolution problem in the present study, the collapse intensity of the cavity in the  $n\textrm {{th}}$ layer mainly depends on the following aspects:
(i) the strength of the initial water-hammer shock wave when it interacts with the cavity in layer
 $n$;
$n$;(ii) the intensity of collapse of the cavity in layer
$n-1$;(iii) the length of the interval between the cavities in layer
$n-1$ and layer $n$.


Similar to the theoretical analyses in § 5, the theoretical estimated value of  $p_{{wh}}$ of the cavity in each layer is given here to estimate the intensity of collapse of each cavity in the tandem cavity arrangement, where the effects of the above three aspects are included. In addition, the reflected rarefaction waves arising from the reflection of the shock wave from the interface of the cavity in the next layer has also been mentioned as another affecting factor in the study by Lauer et al. (Reference Lauer, Hu, Hickel and Adams2012). The rarefaction waves that interact on the cavity are the waves reflected from the cavity in the next layer. In the present study, the cavity in layer
  $n$ was severely deformed and was already penetrated before the arrival of the reflected rarefaction waves. Therefore, these reflected rarefaction waves had a very weak influence on the cavity collapse process. Although this can have an obvious effect on the local peak pressure value, as analysed by Lauer et al. (Reference Lauer, Hu, Hickel and Adams2012), its influence is not considered in the following theoretical analysis, as it is not a major influencing factor for the cavity collapse intensity.
Considering the cavity in layer  $n$, its collapse is induced by the combined effects of the initial water-hammer shock wave and the collapsing shock wave generated from the collapse of the cavity in layer
  $n-1$. In the present study, we assumed that in the problem of cavity collapse induced by two successive shock waves, the combined effect of the two shock waves (
 $p_{{s1}}$ and
  $p_{{s2}}$) might be approximately equal to the effect of a single shock wave whose intensity is the sum of the two waves (
 $p_{{s1}} + p_{{s2}}$), provided certain conditions are met. The following conditions may be necessary for the current assumption: (a) these two shock waves should act on the same side of the cavity; (b) before the action of the second shock wave, the cavity does not deform inwards obviously (that is, the time interval between the two shock waves acting on the cavity should not be very long, and the intensity of the first shock wave should not be very high). Then, the combined pressure acting on the cavity in the
  $n\textrm {{th}}$ layer (
 $p_{{c}}^n$) can be expressed as
 \begin{equation} p_{{c}}^n = p_{{s}}^n + p_{{{collapse}}}^{n - 1}, \end{equation}
where  $p_{{s}}^n$ is the pressure behind the water-hammer shock front when it propagates to the cavity in layer
  $n$ and
  $p_{{{collapse}}}^{n - 1}$ is the pressure behind the collapsing shock front generated from the collapse of the cavity in layer
  $n-1$ when it propagates to the cavity in layer
  $n$. For the cavity in the first layer, the combined pressure acting on it can be directly expressed as
  $p_{{c}}^{{1}} = p_{{s}}^1$. The value of
  $p_{{s}}^n$ can be approximately obtained in figure 4, where the value of
  $p_{{s}}^n$ corresponding to different layers can be regarded as the strength of the focal shock wave when it propagates to different positions during the impingement of an initially dense droplet.
As discussed above, the collapsing shock wave generated from the collapse of the cavity in each layer is a blast shock wave. Based on a previous study (Lesser Reference Lesser1981), the amplitude of the blast pressure wave is inversely proportional to the square root of the area of the wavefront. Hence, if the strength of the collapsing shock wave at a certain position is known, its strength as it expands to any position can then be estimated. For the two-dimensional case discussed here,  $p_{{{collapse}}}^{n - 1}$ is formulated as
 \begin{equation} p_{{{collpase}}}^{n - 1}\left| {^{2{{D}}}} \right. = p_{{{wh}}}^{n - 1}\sqrt{ \frac{{{r_{{i}}}}}{{{\varDelta ^n} + {r_{{i}}}}}}, \end{equation}
where  $\varDelta ^n$ is the interval between the cavities in layer
  $n-1$ and layer
  $n$, and
  $p_{{{wh}}}^{n - 1}$ is the average water-hammer pressure arising from the impingement of the re-entrant jet for the cavity in layer
  $n-1$, which can be used to estimate the intensity of cavity collapse, as discussed in § 5. Here,
  $r_{{i}}$ is the characteristic size of the jet tip when the jet penetrates the cavity, which will be affected by some parameters (Klaseboer et al. Reference Klaseboer, Fong, Turangan, Khoo, Szeri, Calvisi, Sankin and Zhong2007; Johnsen & Colonius Reference Johnsen and Colonius2009; Bempedelis & Ventikos Reference Bempedelis and Ventikos2020). In this study, based on comparison with the numerical results (in the cases of air cavity and vapour cavity),
  $r_{{i}}$ is taken as 1/6
  $r_0$. Similarly, for the asymmetric case,
  $p_{{{collapse}}}^{n - 1}$ is formulated as
 \begin{equation} p_{{{collpase}}}^{n - 1}\left| {^{{{3D}}}} \right. = p_{{{wh}}}^{n - 1} \frac{{{r_{{i}}}}}{{{\varDelta ^n} + {r_{{i}}}}}. \end{equation}
Then, the theoretical approximate collapse time ( $t_{{{collapse}}}^n$) and average velocity of the re-entrant jet (
 $\bar v_{{j}}^n$) of the cavity in layer
  $n$ can be expressed as
 \begin{gather} t_{{{collapse}}}^n = {C_{{s}}}{r_0}\sqrt {\frac{{{\rho _{{l}}}}}{{p_{{c}}^n}}}, \end{gather}
 \begin{gather}\bar{v}_{{j}}^n = \frac{{{C_{{j}}}{r_0}}}{{t_{{{collapse}}}^n}}. \end{gather}
Hence, the average water-hammer pressure arising from the impingement of the re-entrant jet for the cavity in the  $n\textrm {{th}}$ layer is formulated as
 \begin{equation} p_{{{wh}}}^n = \tfrac{1}{2}{\rho _{{l}}}{c_{{l}}}\left| {\bar{v}_{{j}}^n - v_{{u}}^n} \right|. \end{equation}
The value of  $p_{{{wh}}}^{{1}}$ related to the cavity in the first layer can be theoretically estimated through a similar process ((5.1) to (5.3)), as given in § 5. In addition, the instant of collapse of the cavity in the layer
  $n$ can be expressed as
 \begin{equation} {t^n} = {t^{n - 1}} + {\varDelta ^n}/{c_{{{shock}}}} + t_{{{collapse}}}^n, \end{equation}
where  $c_{{shock}}$ is the propagation velocity of the shock wave, approximately taken as the speed of sound in a liquid, and the effect of the first wave (
 $p_{{{s}}}^{n}$) on the cavity collapse time may be ignored before the second wave arrives. Here,
  $t^{n-1}$ is the instant of cavity collapse in layer
  $n-1$. The value of
  $t^1$ is the instant of collapse of the cavity in the first layer, which can be calculated as
  ${t^1} = {\varDelta ^1}/{c_{{{shock}}}} + t_{{{collapse}}}^1$. Then, the theoretical estimation of
  $p_{{{wh}}}^n({t^n})$ of the cavity in each layer can be successively obtained through the above calculation process, which can be used to predict the intensity of the collapsing wave as well as the collapse time of each cavity in the tandem cavity arrangement.
The dotted line in figure 15 shows the theoretical result of  $p_{{{wh}}}^n({t^n})$ for the case of the droplet initially embedded with ten cavities arranged along the central axis, as discussed above. Figure 15 also presents the numerical results of
  $p_{{{wh}}}^n({t^n})$ related to the collapse of the cavity in each layer and the profiles of the maximum pressure of the entire droplet impingement process, where the droplets are initially embedded with ten vapour cavities or ten air cavities arranged along the central axis. As shown in figure 15, regardless of the tandem vapour cavity or the tandem air cavity, a clear layer-by-layer increasing trend can be observed from the peak pressure values related to each cavity collapse. Moreover, the results show that the increasing trend of the collapse intensity of the first few layers is more significant and gradually becomes gentle in the last few layers, which is consistent with the results of Lauer et al. (Reference Lauer, Hu, Hickel and Adams2012). As shown in figure 15, the theoretical results of
  $p_{{{wh}}}^n({t^n})$ can well reflect the changing trend of the corresponding numerical results of each cavity collapse and is properly regarded as an indicator to characterise the collapse intensity of each cavity in the tandem cavity arrangement considered in the current case. Therefore, the theoretical analysis of
  $p_{{{wh}}}^n({t^n})$ can be used to effectively explain the amplification mechanism and predict the conditions of the pressure amplification under different working conditions. Based on the analysis above, it is known that the collapse intensification condition between the layers is
  $p_{{c}}^n > p_{{c}}^{n - 1}$ in the current case. In addition, the results of the case of a planar shock wave inducing the collapse of tandem cavities are presented in Appendix B. The results show that the theoretical prediction of the variation in the collapse intensity with collapse time of the tandem cavity in each layer (
 $p_{{{wh}}}^n({t^n})$) is in good agreement with the numerical results for both the 2-D-planar and 2-D-axisymmetric configurations. This further verifies the validity of the present theoretical model for different types of initial shock waves.

Figure 15. Temporal variations of the maximum pressure ( $p_{{max}}$) during the entire droplet impingement process for the cases related to the droplet embedded with ten vapour cavities arranged along the
  $y$-axis, with ten air cavities and the pure droplet without any cavity. The dash–dotted line shows the value of
  $p_{{wh\_theoretical}}$ of the case of only one cavity is pre-set at the centre of the droplet. The numerical and theoretical results of
  $p_{{{wh}}}^n({t^n})$ related to the collapse of the cavity in each layer are also presented.
7. Factors influencing tandem cavity collapse
In this section, the theoretical model of the collapse intensity for the tandem cavity, presented in § 6.2, is used to analyse the effects of different factors on the cavity collapse intensity and the layer-by-layer intensification trends.
7.1. Cavity number
As shown in figure 15, in the case of the droplet initially embedded with ten cavities of the same size ( $r_0 = 0.1\ \textrm {mm}$) evenly arranged from the bottom of the droplet to the centre along the
  $y$-axis at intervals of
  $\varDelta = 0.5$
  $r_0$, the collapse of the tandem cavity presents a trend of gradual intensification from the first layer to the tenth layer. The strongest collapse intensity (
 $p_{{wh}}$) and the largest peak pressure value (
 $p_{{max}}$) are related to the cavity in the tenth layer. To further explore the trend of the collapse intensity along the tandem cavity, the case of a longer tandem cavity (i.e. greater number of cavity layers) was studied. The case of droplets initially embedded with 20 vapour cavities arranged with the same interval from the bottom to the top side of the droplet along the
  $y$-axis was examined; all other settings were the same as in § 6.
The numerical results of the maximum pressure profiles and numerical values of  $p_{{{wh}}}^n({t^n})$ for the case of the droplet initially embedded with 20 cavities are depicted in figure 16 and the dotted line is the corresponding theoretical result of
  $p_{{{wh}}}^n({t^n})$, which expresses the collapse intensity along the tandem cavity. Figure 16(a) corresponds to the case of the 2-D-planar condition as in the other cases considered above, and figure 16(b) corresponds to the case of the 2-D-axisymmetric condition. The trends of the numerical and theoretical values of
  $p_{{{wh}}}^n({t^n})$ for the different layers match well in the results of the 2-D-planar case (figure 16a) and the 2-D-axisymmetric case (figure 16b). Both of them show a trend of gradual increase for the layers in the lower half, followed by a trend of gradual decrease for the layers in the upper half and the peak value occurs in the middle layer. As analysed in § 6.2, the intensification condition for the layer-by-layer collapse intensity is
  $p_{{c}}^n > p_{{c}}^{n - 1}$, where
  $p_{{c}}^n$ consists of
  $p_{{s}}^n$ and
  $p_{{{collapse}}}^{n-1}$. As discussed in § 4.1, the strength of the focal shock wave,
  $p_{{s}}$, shows a trend of initial increase followed by decrease, and the greatest strength occurs at the focal region, which is around the centre of the droplet. This trend coincides with that of the collapse intensity along the tandem cavity. Therefore, in the present cases, the trend of the strength of the initial water-hammer shock wave seriously affects the intensification of cavity collapse in the different layers and is a major influencing factor for the peak pressure values.

Figure 16. Profiles of the maximum pressure value ( $p_{{max}}$) when the droplets are initially embedded with 20 vapour cavities arranged with
  $\varDelta = 0.5$
  $r_0$ along the
  $y$-axis, and the theoretical and numerical values of
  $p_{{{wh}}}^n({t^n})$ for the cavity in each layer. The dash–dotted line shows the value of
  $p_{{{wh\_theoretical}}}^{{{2-D/3-D}}}$ for the corresponding case, where only one cavity is pre-set at the centre of the droplet.
In addition, by comparing the results of the 2-D-planar case and 2-D-axisymmetric case, it can be seen that the collapse intensity and peak pressure values are higher in the axisymmetric case, because the corresponding water-hammer shock wave is stronger. Furthermore, as shown in the profile of  $p_{{max}}$ in figure 16(b), owing to the wave-focusing effect at some local points in the 2-D-axisymmetric case, the peak pressure values in the first few layers are abnormally high. In addition, the comparison between the profiles of the maximum pressure and collapse intensity of the tandem cavity shows that the peak pressure value is more susceptible to the local focusing effect in the axisymmetric case. However, this local peak pressure might have little influence on the intensity of the cavity collapse.
7.2. Layer interval
As discussed previously in § 6.2, there are two main components that determine the collapse intensity of each layer, one of which is  $p_{{{collapse}}}^{n - 1}$. Referring to (6.2),
  $p_{{{collapse}}}^{n - 1}$ depends on the collapse intensity of the cavity in layer
  $n-1$ (
 $p_{{{wh}}}^{n - 1}$) and the interval between layer
  $n-1$ and layer
  $n$ (
$n$ ( $\varDelta ^n$); therefore, the effects of different layer intervals were investigated.
As shown in figure 17(a-1), the case of the droplet initially embedded with five vapour cavities of the same size ( $r_0 = 0.1\ \textrm {mm}$) arranged from the bottom of the droplet to the centre along the
  $y$-axis at equal intervals (
 $\varDelta = 3$
  $r_0$) was considered. The numerical results of the space–time diagrams of the pressure and vertical-component velocity (
 $v$) along the
  $y$-axis in this case are shown in figure 17, and the corresponding maximum pressure profile during the high-speed impingement of the droplet as well as the numerical and theoretical results of
  $p_{{{wh}}}^n({t^n})$ of the tandem cavity are depicted in figure 18(a). As shown in figure 17(a-2), owing to the successive collapse of the tandem cavity, a netted shock wave system is generated, as shown in figure 12(a-2), which is very similar to the case described in § 6.1. However, as the cavities in this case are more loosely arranged, the size of each ‘wave mesh’ is larger in figure 17(a-2) than in figure 12(a-2). In addition, owing to the shock-induced rapid deformation of the cavity, the re-entrant jet is generated around the central axis and the collapse of each cavity is followed by a high-velocity strip, as shown in figure 17(b). The velocity distribution in figure 17(b) shows an obvious banded shape where there is always an undisturbed low-velocity region between two high-velocity strips. The velocity distribution in figure 17(b) is different from that in figure 12(b), where the high-velocity regions fuse with each other owing to the smaller cavity interval and stronger jet intensity. Moreover, although the collapse intensity continues to present an increasing trend layer by layer, the intensity is weaker in the current case with five cavities than in the case with ten cavities in § 6.1, owing to the larger interval between the layers, which results in a smaller
  $p_{{{collapse}}}^{n - 1}$. For example, considering the cavity with centre at
  $y = 0.6$
  $R_0$ in both cases, the value of
  $p_{{wh}}$ of this cavity is
  $1.6\times 10^4$
  $p_0$ for the previous more tightly arranged case in § 6.1, whereas the value is only
  $1.9\times 10^4$
  $p_0$ for the current relatively loosely arranged case, as shown in figure 18(a). In addition, the maximum pressure profile and the numerical and theoretical results of
  $p_{{{wh}}}^n({t^n})$ for the corresponding 2-D-axisymmetric case are given in figure 18(b). From figure 18, by comparing the results of the 2-D-planar case and 2-D-axisymmetric case, it can be seen that the collapse intensity and peak pressure values are higher in the axisymmetric case, which is similar to that in figure 16.

Figure 17. (a-1) Schematic diagram, and space–time diagrams of (a-2) the pressure and (b) the vertical-component velocity  $v$ along the
  $y$-axis for the case of a water column embedded with five vapour cavities with
  $\varDelta = 3$
  $r_0$, impinged on a
  $180^\circ$ constrained wall.

Figure 18. Profiles of the maximum pressure ( $p_{{max}}$) of droplets initially embedded with five vapour cavities with
  $\varDelta = 3$
  $r_0$ arranged along the
  $y$-axis, and the theoretical and numerical values of
  $p_{{{wh}}}^n({t^n})$ for the cavity in each layer.
In addition, as shown in figure 18, the theoretical results provide a good prediction of the trend of the layer-by-layer cavity collapse intensity, where the influence of the layer interval is included. Hence, the influence of different intervals between the cavity layers can be further studied with the help of theoretical analysis. The cases of droplets embedded with different initial numbers of cavities evenly arranged along the  $y$-axis at
  $[0, R_0]$ are investigated, where the number of cavities are set to 10, 5, 3 and 2, and the related layer intervals are
  $\varDelta = 0.5$
  $r_0$,
  $\varDelta = 3$
  $r_0$,
  $\varDelta = 5.5$
  $r_0$ and
  $\varDelta = 10.5$
  $r_0$. The theoretical lines of
  $p_{{{wh}}}^n({t^n})$ for the cases with different layer intervals are presented in figure 19(a) (the solid lines); the theoretical values of
  ${p_{{{wh}}}}$ for the cases with only one cavity initially located at different positions on the
  $y$-axis are also presented (the dashed line). The collapse intensity is intensified layer by layer in all cases under the present working condition, whereas the degree of intensification decreases with increasing
  $\varDelta$, which can be easily understood from the relation between
  $p_{{{collapse}}}^{n - 1}$ and
  $\varDelta ^n$ in (6.2). As shown by the dashed line in figure 19(a), in the case with only one cavity, the collapse intensity is stronger when the cavity is initially located closer to the centre of the droplet, which conforms to the changing trend of the strength of the focal shock wave (
 $p_{{s}}$). Based on the above discussion, it is clear that the influencing factors of cavity collapse intensity can be mainly separated into two parts, namely,
  $p_{{s}}^n$ and
  $p_{{{collapse}}}^{n - 1}$. To clearly segregate the influence of each factor, their effects are discussed separately with the help of the theoretical model.

Figure 19. Theoretical prediction curves of  $p_{{{wh}}}^n$ (a) for different layer intervals and (b) for evenly arranged tandem cavities with different layer intervals, where only the first cavity is affected by the shock wave.
To further study the layer-by-layer effect separately, the cases of evenly arranged tandem cavities with different layer intervals were investigated, where only the first cavity was affected by the shock wave. The post-wave pressure of the shock impacted on the first cavity is  $p_{{s}}^1$ in all cases, which is the value of the post-wave pressure when the shock wave propagates to the first cavity in the case discussed in § 6.1. The layer interval (
 $\varDelta$) of the evenly arranged tandem cavities was set to range from 0.1
  $r_0$ to 10
  $r_0$ in the different cases. The theoretical results of
  $p_{{wh}}^n$ for the cases with different layer intervals are given in figure 19(b). As shown in figure 19(b), there is a critical length of the layer interval; when the interval between the layers is equal to this value, the collapse intensity of the cavity in each layer is unchanged. If the length of the interval is larger than this critical value, the collapse intensity will increase layer by layer, which is called the tightly arranged case here. If the layer interval is smaller than this critical value, the collapse intensity will gradually decrease, which is called the loosely arranged case here. As shown in figure 19(b), this critical interval is approximately 0.7
  $r_0$ in the current cases. Regardless of the tight or loose arrangement, the curves of
  ${p_{{{wh}}}}$ quickly converge to a constant value. In addition, it can also be seen that the degree of change in the collapse intensity with the change in the layer interval is not uniform. In the tightly arranged cases, a smaller value of
  $\varDelta$ will result in a more significant layer-by-layer intensification effect. The degree of intensification of
  ${p_{{{wh}}}}$ is accelerated with the decrease in
  $\varDelta$. The limiting case is
  $\varDelta$ tending to zero, where the cavities are arranged tightly in a sequence. As shown in figure 19(b), the maximum magnification of
  ${p_{{{wh}}}}$ arising from the layer-by-layer intensification effect is approximately 1.5 times in the current cases. In the loosely arranged case, a larger value of
  $\varDelta$ will result in a weaker layer-by-layer effect, i.e. the degree of attenuation of
  ${p_{{{wh}}}}$ decreases with increasing
  $\varDelta$. In general, with increasing
  $\varDelta$, the layer-by-layer effect gradually weakens. This phenomenon can be explained by the evolution of the strength of the collapsing waves. As the collapsing wave is a blast shock wave, based on (6.2), the rate of decrease of
  $p_{{collapse}}$ slows down with the expansion distance (
 $\varDelta$). Hence, the rate of change of
  ${p_{{{wh}}}}$ also slows down with increasing
  $\varDelta$.
7.3. Shock wave property
Moreover, by referring to (6.1), it is noted that  $p_{{s}}^n$ is another important influencing factor affecting the intensification of the collapse intensity of a tandem cavity, which depends on the properties of the water-hammer shock wave generated from the initial impingement.
The theoretical values of  $p_{{{wh}}}^n({t^n})$ for different initial water-hammer pressures (
 $p_{{s}}^n$) in both the 2-D-planar and 2-D-axisymmetric cases are presented in figure 20, in which ten cavities are evenly arranged with the same layer interval
  $\varDelta = 0.5$
  $r_0$. Here, (I) the uppermost red solid curve corresponds to the case in which a focusing shock wave propagates across the tandem cavity, as in the case in § 6.1 (i.e. the cavities are affected by both
  $p_{{s}}^n$ and
  $p_{{{collapse}}}^{n - 1}$). (II) The second pink dashed curve from the top corresponds to the case in which a planar shock wave propagates across the tandem cavity, and the post-wave pressure is always
  $p_{{s}}^1$ (i.e. the cavities are affected by both
  $p_{{s}}^n$ and
  $p_{{{collapse}}}^{n - 1}$, where
  $p_{{s}}^n \equiv p_{{s}}^1$). (III) The bottommost black dashed curve corresponds to the case where only one cavity is initially located at different positions of the
  $y$-axis (i.e. all cavities are affected only by
  $p_{{s}}^n$); this is related to the cases in which only the influence of
  $p_{{s}}^n$ is considered and is the same as the dashed black curve in figure 19(a).

Figure 20. Theoretical results of  $p_{{{wh}}}^n({t^n})$ for the cases with ten evenly arranged cavities with
  $\varDelta = 0.5$
  $r_0$ under different working conditions.
As shown in figure 20, through the comparison of the results under different working conditions, it can be seen that if the influence of the changes in the shock wave strength ( $p_{{s}}$) is removed, the trends of the layer-by-layer cavity collapse intensity are very similar (as shown by curve (II)). Curve (II) quickly converges to a constant value, where the intensification effect is significant at the beginning. Then, the rate of increase gradually slows down, and the value of
  ${p_{{{wh}}}}$ remains almost unchanged after reaching a certain layer. However, when
  $p_{{s}}$ is not constant, for example, in the case related to curve (I), as shown in figure 20, the overall trend is the superposition of both the layer-by-layer effect and the changes in
  $p_{{s}}$.
The above analyses show that the property of the water-hammer shock wave will seriously affect the intensification of cavity collapse in the different layers; it is also a major influencing factor for the peak pressure values, as shown in figure 16. In the present study, when a high-speed droplet impinges on the tube-shaped  $180^\circ$ constrained wall, a concave focus shock wave is generated, and the strength of the water-hammer shock increases in its focusing stage and decreases in its expanding stage. The curves (II) in figure 20 are equivalent to the case of planar shock wave interaction with the tandem cavity, as shown in Appendix B. By referring to a previous article on the water-hammer shock wave generated by the high-speed droplet impact (Wu et al. Reference Wu, Xiang and Wang2018, Reference Wu, Liu and Wang2021), it is deduced that the property of the water-hammer shock wave depends on both the initial impact velocity and the relative curvature between the droplet interface and the impacted surface. When the impingement velocity is fixed, the strongest water-hammer shock wave can be produced under the current setting of droplet impingement on the tube-shaped
  $180^\circ$ constrained wall. Moreover, by comparing the results of the 2-D-planar case and 2-D-axisymmetric case, it is inferred that the influence of
  $p_{{{collapse}}}^{n - 1}$ is relatively weakened whereas the influence of the convergence effect of
  $p_{{s}}^n$ is more significant for the 2-D-axisymmetric case, as shown in figure 20.
In summary, the three main factors influencing the change in the collapse intensity of the tandem cavity are the number of cavities, layer interval between the cavities and property of the water-hammer shock wave. The first influencing factor is the number of cavity layers. When the influence of only the layer-by-layer effect is considered, the cavity collapse intensity varies significantly in the first few layers and remains basically unchanged after reaching a certain number of layers. The second influencing factor is the layer interval between the cavities. A critical layer interval exists; when the interval is less than this value (tightly arranged), the collapsing wave can maintain the intensity of the layer-by-layer collapse, whereas when the interval exceeds this value (loosely arranged), the collapsing wave cannot maintain the collapse intensity of the cavity by itself. In addition, the property of the initial water-hammer shock wave also seriously affects the collapse intensity of the tandem cavity. The overall trend is the superposition of both the layer-by-layer effect and the changes in the profile of the shock strength.
8. Conclusion
The configuration of a droplet embedded with tandem cavities was proposed for studying the high-speed impingement of a droplet on a  $180^\circ$ constrained wall, and the dynamic processes of high-speed droplet impingement and embedded tandem cavity collapse were numerically studied based on a multicomponent two-phase compressible model coupled with a phase-transition model. The following conclusions are drawn from this study.
The focusing water-hammer shock wave generated by high-speed droplet impingement on a surface with the same curvature and  $180^\circ$ constrained wall has a concave wavefront with non-uniform intensity. During the process of shock wave convergence, the intensity increases according to a theoretical linear trend. However, as the shock wave gradually converges to the focal region, the nonlinear trend becomes prominent owing to the influence of the change in the speed of sound. In the focal region, the peak pressure after the wavefront is approximately 2.5 times the value of the water-hammer pressure generated by the initial impact. After that, the shock wave expands and its intensity gradually decreases.
The shock energy is partly absorbed and peak pressure amplification can be effectively realised by pre-setting a cavity in the droplet. The two kinds of cavities, i.e. the air cavity and the vapour cavity, have different collapse mechanisms, which causes a difference in the peak pressure value. As the collapsing shock wave is directly generated during the collapsing process of the vapour cavity, its peak pressure is higher than that in the air cavity collapsing process. However, the final intensities of the collapsing waves in both cases are equal after the subsequent propagation and superposition of the waves. In addition, the shock-induced cavity collapse intensity was theoretically estimated.
A tandem cavity evenly arranged on the central axis of the droplet ( $y$-axis) can better absorb the energy of the shock wave and further amplify the peak pressure to realise better energy convergence. The qualitative and quantitative analyses show that with the successive collapse of the tandem cavity, as the collapsing shock waves and reflected shock waves interweave with each other, a netted shock wave system appears inside the droplet. It is also found that the collapse intensity of the cavity in each layer mainly depends on the strength of the water-hammer shock wave, the intensity of the cavity collapse in the last layer and the length of the interval between the cavity layers. When the collapse intensification condition is met, the peak pressure and collapse intensity may increase with cavity collapse in successive layers.
A theoretical analysis model for predicting the collapse intensity of each cavity in the tandem array was established, which provides an approach to understand the physical process of shock-induced tandem cavity collapse. With the help of the theoretical model, three factors that influence the changes in the collapse intensity of the tandem cavity were theoretically analysed. The results show that both the higher strength of the shock wave and shorter layer interval between the cavities intensify the collapse of the tandem cavity. If the effects of the changes in the initial water hammer shock waves are removed, the cavity collapse intensity varies significantly in the first few layers and remains basically unchanged after reaching a certain number of layers. In addition, a critical layer interval was observed; when the interval is less than this value (tightly arranged), the collapsing wave can maintain the collapse intensity layer by layer, whereas when the interval exceeds this value (loosely arranged), the collapsing wave cannot maintain the cavity collapse intensity by itself.
Based on the above analysis, the evolution mechanism and basic influencing factors of this energy convergence configuration are explained, which may provide guidance for possible future applications. Further analysis of the influence of different spatial distributions and the size and shape of the cavities will be discussed in our future work.
Funding
The authors are grateful for the support of the National Natural Science Foundation of China (grant nos 12002039, 12032005, 51676111) and the China Postdoctoral Science Foundation (grant nos 2021T140056, 2020M670145).
Declaration of interests
The authors report no conflict of interest.
Appendix A
In this appendix, the cavity collapse time is theoretically estimated. It is known that the time of symmetric cavity collapse (also known as the Rayleigh collapse) can be approximated as (Brennen Reference Brennen1995)
 \begin{equation} t_{{{collapse}}}^{\textrm{{Rayleigh}}} = 0.915{r_0}\sqrt{\frac{{{\rho _{{l}}}}}{{{p_{{s}}} - {p_{{g}}}}}}. \end{equation}
In the case of the shock-induced cavity collapse, which is a type of asymmetric collapse, similar to the theoretical expression in (A1), the collapse time can be regarded as
 \begin{equation} {t_{{{collapse}}}} = {C_{{s}}}{r_0}\sqrt {\frac{{{\rho _{{l}}}}}{{{p_{{s}}} - {p_{{g}}}}}}, \end{equation}
where  $C_{{s}}$ is the coefficient related to the asymmetric condition. Based on the fitting of the experimental and numerical results reported in previous studies (Ding & Gracewski Reference Ding and Gracewski1996; Bourne & Field Reference Bourne and Field1999; Ball et al. Reference Ball, Howell, Leighton and Schofield2000; Allaire, Clerc & Kokh Reference Allaire, Clerc and Kokh2002; Johnsen & Colonius Reference Johnsen and Colonius2009; Hawker & Ventikos Reference Hawker and Ventikos2012),
  $C_{{s}}$ can be set as
  $C_{{s}}^{{{2-D}}} = \sqrt {2}$ and
  $C_{{s}}^{{{3-D}}} = \sqrt [6]{2}$ for the 2-D-planar and 2-D-axisymmetric configurations, respectively, as shown in figure 21.

Figure 21. Comparison of the numerical results with the theoretical estimations for the non-dimensionalised collapse time.
Both the results from the previous studies and the present theoretical estimation for the non-dimensionalised collapse time are compared in figure 21. In addition, the present numerical results of the collapse time under the condition in § 4.2 for both the 2-D-planar and 2-D-axisymmetric configurations are presented in figure 21. As shown in figure 21, the theoretical estimation of the collapse time shows good agreement with the numerical results for both configurations. Hence, the theoretical model can be applied in the present study for the estimation of the collapse time of the shock-induced asymmetric cavity collapse.
Appendix B
For comparison, the problem of tandem cavity collapse induced by a planar shock wave is considered in this appendix. Both the 2-D-planar and 2-D-axisymmetric configurations are included here, but the bottom wall is flat.
As shown in figure 22, similar to the configuration in § 7.1, 20 vapour cavities of the same size ( $r_0 = 0.1\ \textrm {mm}$) and equal interval (
 $\varDelta = 0.5$
  $r_0$) are initially arranged in tandem along the
  $y$-axis in liquid media. The initial distance between the bottom interface of the flat fluid and the cavity centroid in the first-layer is 3.75
  $r_0$ (
 ${=} 0.15\,R_0$), and the other three boundaries of the liquid region are unbounded. Initially, the entire fluid region moves towards the solid wall at the speed of
  $V_0 =300\ \textrm {m}\ \textrm {s}^{-1}$. Here, the initial instant (
 $t/(R_0/c_{{l\_0}}) = 0.0$) corresponds to the moment when the bottom interface of the liquid comes in contact with the plane solid wall. Thus, a planar shock wave is generated in the liquid owing to the high-speed impingement, which is the water-hammer shock wave. The numerical results of the pressure contours (left) and the schlieren image (right) at different time instants during the evolution process of the embedded cavities are shown in figure 22.

Figure 22. Numerical results of the pressure contours (left) and the schlieren image (right) of the liquid impingement on the solid wall, which are initially embedded with 20 vapour cavities arranged along the  $y$-axis. The contours are related to the time series: (a)
  $t/(R_0/c_{{l\_0}}) = 0.09$; (b)
  $t/(R_0/c_{{l\_0}}) = 0.60$; (c)
  $t/(R_0/c_{{l\_0}}) = 1.05$; (d)
  $t/(R_0/c_{{l\_0}}) = 1.49$ and (e)
  $t/(R_0/c_{{l\_0}}) = 1.92$.
As shown in figure 22, the tandem cavities collapse successively owing to the impact of the planar shock wave. The tandem cavity collapse process, as well as the morphology and distribution of the collapsing wave structure, are very similar to those presented in §§ 6 and 7.1. The results show that the cavity collapse mechanism is the same as that described in the schematic diagram in figure 14, where the cavity collapse in layer  $n$ (
$n$ ( $n \neq 1$) is mainly affected by both the initial shock wave and the shock wave generated by the foregoing cavity collapse. Hence, a similar analysis can be conducted for the intensity of cavity collapse by using the theoretical model established in § 6.2.
Figure 23 further shows the variation in the maximum pressure and comparison between the numerical and theoretical results of  $p_{{{wh}}}^n({t^n})$ related to the collapse of the cavity in each layer, for both the 2-D-planar and 2-D-axisymmetric configurations. Because of the difference in the shape of the shock wave from those in §§ 6 and 7.1, the trends of the variation in the cavity collapse intensity are different. As seen from the variation in
  $p_{{{wh}}}^n({t^n})$ in figure 23, the cavity collapse intensity increases in the first few layers but then tends to be flattened, which is consistent with the analysis in § 7. Meanwhile, through the comparison between the numerical and theoretical results of
  $p_{{{wh}}}^n({t^n})$, it can be seen that the theoretical prediction of the collapse time and collapse intensity in each layer is in good agreement with the numerical results for both the 2-D-planar and 2-D-axisymmetric configurations. This further verifies the validity of the theoretical model in § 6.2 for predicting the trend of the tandem cavity collapsing strength for different shapes of the initial shock waves. Moreover, as shown in the profile of
  $p_{{max}}$ for the 2-D-axisymmetric case in figure 23(b), the peak pressure values in the first few layers are abnormally high, which is similar to the profile in the 2-D-axisymmetric case in figure 16(b). Mostly, this is because the wave-focusing effect is very strong at some local points when the cavity is impacted by the planar shock wave in the axisymmetric case. However, as discussed before, this local peak pressure might have little influence on the intensity of cavity collapse.

Figure 23. Temporal variation in the maximum pressure ( $p_{{max}}$) in the case of a liquid embedded with 20 vapour cavities arranged along the
  $y$-axis, and the comparison between the numerical and theoretical results of
  $p_{{{wh}}}^n({t^n})$ related to the collapse of the cavity in each layer.


