


1 Introduction
When a liquid drop falls on the surface of its homophase, coalescence is expected to occur (Charles & Mason Reference Charles and Mason1960; Klyuzhin et al. Reference Klyuzhin, Ienna, Roeder, Wexler and Pollack2010). Coalescence of drops is ubiquitous in nature as well as in industrial applications such as transportation of oil mixtures with water (Venkataraman et al. Reference Venkataraman, Tang, Frenkel, McPherson, He, Raghavan, Kolesnichenko, Bose and John2013; Farhadi et al. Reference Farhadi, Riahi, Ayatollahi and Ahmadi2016), milk processing (Tcholakova et al. Reference Tcholakova, Denkov, Ivanov and Campbell2006), spray painting (Dalili et al. Reference Dalili, Esmaeelpanah, Chandra and Mostaghimi2017) and drug encapsulation (Andrade et al. Reference Andrade, Song, Li, Zimmerman, Cheng, Moore, Harris and Katz2015). In some applications, such as oil–water separation (Kavehpour Reference Kavehpour2015), rapid coalescence is desirable, while in other areas, including the food, pharmaceuticals and cosmetics industries (Jafari et al. Reference Jafari, Assadpoor, He and Bhandari2008; Deng et al. Reference Deng, Wang, Ju, Xie and Chu2016; Muijlwijk et al. Reference Muijlwijk, Colijn, Harsono, Krebs, Berton-Carabin and Schroën2017), coalescence should be prevented to maintain the stability of emulsions. In some cases, the drops rest on the liquid surface for a long time before they coalesce. As early as 1881, Reynolds discussed this phenomenon and indicated that impurities of the surface might lead to coalescence (Reynolds Reference Reynolds1881). In contrast, later studies found an increase of the drop rest time when detergents or surfactants were added (Yeo & Matar Reference Yeo and Matar2003; Dai & Leal Reference Dai and Leal2008; Dong et al. Reference Dong, Weheliye, Chausset and Angeli2017; Dong, Weheliye & Angeli Reference Dong, Weheliye and Angeli2019). In fact, surfactants are widely used to stabilize emulsions or dispersions (Sajjadi, Zerfa & Brooks Reference Sajjadi, Zerfa and Brooks2002; Li, Zhang & Thoroddsen Reference Li, Zhang and Thoroddsen2013).
Delay of drop coalescence with an interface can also be achieved by other means. Previous research by J. A. Raymond, as reported by Walker (Reference Walker1978), showed that mechanical vibrations were able to increase the rest time of drops on a liquid surface for as long as 18 min. In a similar experiment, Walker (Reference Walker1978) tested the delayed coalescence of drops on an oscillating plate at  $10{-}150~\text{Hz}$, and found that oscillations in the middle of the amplitude range resulted in the longest drop rest time, while a smaller or larger amplitude reduced the drop life. When a drop approaches the interface of its homophase with air, a thin film of air is trapped and coalescence occurs when the thin film drains out. Accordingly, Walker (Reference Walker1978) attributed the delay of coalescence to the refill of the air film as a result of the vibrations. The refill mainly happens with small drops (Couder et al. Reference Couder, Fort, Gautier and Boudaoud2005). With large drops, vibrations are dampened, and the drainage of the air film is delayed. Vibrating interfaces have recently been used to delay the coalescence of drops (Couder et al. Reference Couder, Fort, Gautier and Boudaoud2005; Damiano et al. Reference Damiano, Brun, Harris, Galeano-Rios and Bush2016; Pucci et al. Reference Pucci, Harris, Faria and Bush2018; Sáenz, Cristea-Platon & Bush Reference Sáenz, Cristea-Platon and Bush2018). Moláček & Bush (Reference Moláček and Bush2013) combined the properties of the fluids and the vibration parameters of the interface in a map of drop behaviour, which included coalescence, bounce, walk and chaotic behaviour. Sáenz et al. (Reference Sáenz, Cristea-Platon and Bush2018) recently discovered a statistically well-defined pattern of the speed of the floating drops on vibrating surfaces. More specifically, they found that, under their experimental conditions, the velocity distribution resembled a series of concentric annuli.
A temperature difference between the drop surface and the interface can delay coalescence as well. For example, a temperature difference of  $\unicode[STIX]{x0394}T=30\,^{\circ }\text{C}$ between two drops of 5 cSt silicone oil can delay coalescence for 1 h until
  $\unicode[STIX]{x0394}T$ reduces below a critical value of
  $\unicode[STIX]{x0394}T_{c}=3.0\pm 1.0\,^{\circ }\text{C}$ (Dell’Aversana, Banavar & Koplik Reference Dell’Aversana, Banavar and Koplik1996). Geri et al. (Reference Geri, Keshavarz, McKinley and Bush2017) found that the delay increased monotonically with the initial temperature difference
  $\unicode[STIX]{x0394}T_{0}$. The thermally induced Marangoni effect was considered to be responsible for preventing coalescence in such cases (Napolitano, Monti & Russo Reference Napolitano, Monti and Russo1986). The magnitude of the thermally induced Marangoni flow is characterized by the velocity
  $v_{m}=\unicode[STIX]{x1D70E}_{T}\unicode[STIX]{x0394}T/\unicode[STIX]{x1D707}$ (Dell’Aversana et al. Reference Dell’Aversana, Banavar and Koplik1996; Savino, Paterna & Lappa Reference Savino, Paterna and Lappa2003), where
  $\unicode[STIX]{x1D70E}_{T}$ is the interfacial tension corresponding to temperature
  $T$,
$T$,  $\unicode[STIX]{x0394}T$ is the temperature difference and
  $\unicode[STIX]{x1D707}$ is the dynamic viscosity of the liquids. According to the lubrication theory, the pressure that resists coalescence is estimated to be equal to
  $\unicode[STIX]{x0394}P=\unicode[STIX]{x1D707}_{a}\unicode[STIX]{x1D70E}_{T}R\unicode[STIX]{x0394}T/(\unicode[STIX]{x1D707}_{p}h^{2})$, where
  $\unicode[STIX]{x1D707}_{a}$ and
  $\unicode[STIX]{x1D707}_{p}$ are the viscosity of the air and the bulk liquid pool, and
  $h$ is the thickness of the trapped air film (Savino et al. Reference Savino, Paterna and Lappa2003). By equating the lubrication pressure over the drop to the weight of the drop, Davanlou (Reference Davanlou2016) correlated the film thickness at equilibrium to the temperature gradient for the drop to float upon a liquid pool,
  $h=\sqrt{3\unicode[STIX]{x1D70E}_{T}\unicode[STIX]{x1D707}_{a}\unicode[STIX]{x0394}T/(16\unicode[STIX]{x1D70C}_{d}g\unicode[STIX]{x1D707}_{p})}$. According to the equation, an increase in temperature difference leads to a thicker air film.
Dell’Aversana et al. (Reference Dell’Aversana, Banavar and Koplik1996) suggested that the main reason for the delay in coalescence of drops with moving bulk liquid layers of the same phase, compared to stationary ones, is the change in the tangential velocities along the drop surface and the bulk liquid interface. The modified tangential velocities increase the lubrication pressure while they help the surrounding fluid to be entrained in the film, thus resisting the contact of the drop with the bulk liquid homophase. They found that a drop can float on a moving interface in the absence of a temperature gradient. The phenomenon was confirmed by subsequent works (Sreenivas, De & Arakeri Reference Sreenivas, De and Arakeri1999; Lhuissier et al. Reference Lhuissier, Tagawa, Tran and Sun2013). Sreenivas et al. (Reference Sreenivas, De and Arakeri1999) investigated the non-coalescence of drops at the hydraulic jump of a flowing film. It was, however, shown that the drops do not always stay at the hydraulic jump steadily but oscillate (Pirat et al. Reference Pirat, Lebon, Fruleux, Roche and Limat2010), which is not conducive to the study of the dynamics of the trapped film. Similarly, steady drop floating was achieved by releasing drops on the inner surface of a rotating cylinder coated with a thin layer of the same liquid as in the drop (Davis, Dransfield & Tan Reference Davis, Dransfield and Tan1980; Thoroddsen & Mahadevan Reference Thoroddsen and Mahadevan1997; Lhuissier et al. Reference Lhuissier, Tagawa, Tran and Sun2013; Sawaguchi et al. Reference Sawaguchi, Matsuda, Hama, Saito and Tagawa2019). Whether the drops can levitate on the surface or not depends a lot on the impact conditions. A phase map was plotted by Castrejón-Pita et al. (Reference Castrejón-Pita, Muñoz-Sánchez, Hutchings and Castrejón-Pita2016) to indicate the different patterns using  $We\,Re^{1/2}$ and
  $v_{t}/(v_{n}Re^{1/2})$ as coordinates, where
  $We$ and
  $Re$ are the Weber and Reynolds numbers, and
  $v_{t}$ and
  $v_{n}$ are the velocity of the surface and the impact velocity of the drop. Drop levitation was observed on the liquid surface at large values of
  $v_{t}/(v_{n}Re^{1/2})$, which requires a high viscosity of the liquids, a low impact velocity and a large rotation speed. Through direct observation, Davis et al. (Reference Davis, Dransfield and Tan1980) found that the shape of the floating drop is affected by the rotation speed of the cylinder: a flatter bottom of the drop could be produced at higher speeds.
The rest time of drops on a moving liquid surface depends on two parameters, the thickness and the pressure in the film that separates the drop from the interface. Lhuissier et al. (Reference Lhuissier, Tagawa, Tran and Sun2013) used interferometry and found that, when drops were levitated at the inner surface of a cylinder, the distribution of the film thickness was uneven. Using lubrication theory, the air film thickness was estimated, and was found to be partially in agreement with the measurements. For large drops, the film thickness is  $h\sim Ca^{2/3}\unicode[STIX]{x1D705}_{b}^{-1}$, while for small drops it is
  $h\sim Ca^{4/5}(a\unicode[STIX]{x1D705}_{b})^{4/5}\unicode[STIX]{x1D705}_{b}^{-1}$, where the capillary number
  $Ca$ is based on the velocity of the air film,
  $\unicode[STIX]{x1D705}_{b}$ is the surface curvature at the bottom of the drop and
  $a=(\unicode[STIX]{x1D70E}/\unicode[STIX]{x1D70C}g)^{1/2}$ is the capillary length. According to the predictions, the film thickness increases with the air film velocity at a higher rate for small drops. Sawaguchi et al. (Reference Sawaguchi, Matsuda, Hama, Saito and Tagawa2019), in similar measurements, found that the thickness of the air film was evenly distributed at the bottom of low-viscosity drops, while large oscillations were observed for high-viscosity drops.
Sreenivas et al. (Reference Sreenivas, De and Arakeri1999), who studied the levitation of drops at a hydraulic jump, suggested that the force needed to balance the weight of the drop was  $W=f_{L}\unicode[STIX]{x1D707}_{a}vL_{y}L_{x}^{2}/h^{2}$, where
  $v$ is the velocity of the trapped film,
  $L_{x}$ and
  $L_{y}$ refer to the length and width of the drop as it is deformed, and
  $f_{L}$ is related to the shape factor
  $L_{x}/L_{y}$ and inclination of the drop. However, no calculated results were given. Based on the lubrication theory, Sawaguchi et al. (Reference Sawaguchi, Matsuda, Hama, Saito and Tagawa2019) found the two-dimensional pressure distribution in the trapped film for a steadily floating drop. As the drop shape is controlled by the balance between the inner pressure of the drop given by the weight, the outer pressure in the film and the Laplace force, the film pressure can also be calculated if the local drop surface curvature is known. The results obtained from the two methods were in good agreement for most of the film apart from the small region at the exit of the film.
In many industrial applications where the drop is levitated over an interface, including oil petroleum transportation and oil–water separation (Rommel, Blass & Meon Reference Rommel, Blass and Meon1993), the drops are surrounded by another liquid and the fluid interface is significantly deformed when the drop approaches it because of gravity. In most of the previous investigations, drops were generated in air and approached the interfaces of liquid films with air (Lhuissier et al. Reference Lhuissier, Tagawa, Tran and Sun2013; Castrejón-Pita et al. Reference Castrejón-Pita, Muñoz-Sánchez, Hutchings and Castrejón-Pita2016; Sawaguchi et al. Reference Sawaguchi, Matsuda, Hama, Saito and Tagawa2019). In such cases, drop levitation can be realized only when the interfaces have high speed and the liquids have large viscosity. In addition, as the liquid films were thin and close to the bottom wall, the interfaces were not significantly deformed. Lee et al. (Reference Lee, Li, Marston, Bonito and Thoroddsen2013) studied the lubrication phenomenon in the air layer between the curved jet of non-Newtonian liquids with greatly deformed surfaces. For other investigations, such as a drop levitated at the hydraulic jump of a film flow (Sreenivas et al. Reference Sreenivas, De and Arakeri1999), wakes were observed in the vicinity of the drops while the drops were oscillating during the levitation (Pirat et al. Reference Pirat, Lebon, Fruleux, Roche and Limat2010). Recently, Hale & Akers (Reference Hale and Akers2016) investigated drop deceleration on a stationary liquid surface. However, in this case surfactants were used, and the delayed coalescence could be due either to the presence of the surfactants or to the relative motion between the drop and the bulk liquid.
In the previous studies, drop surfing and delayed coalescence were investigated on liquid surfaces with air. In many applications, however, drops coalesce with liquid–liquid interfaces and their surfing has not been studied. In this present study, a novel flow channel was designed, which allowed an oil–aqueous interface to move at different speeds as an aqueous drop was released on it. High-speed planar laser-induced fluorescence (PLIF) and particle image velocimetry (PIV) were used to obtain the shapes of the drop and the interface, the shape and thickness of the film trapped between the drop and the bulk liquid, and the velocities of the drop surface and the bulk interface bounding the film. The rest times of the drop on the interfaces are measured and the mechanism of delayed coalescence is discussed based on the lubrication pressure in the film and its dependence on the film shape and on the velocities of the drop bottom surface and of the bulk liquid interface. The changes of the drop shape at the initial stages of drop impact and rebound on the interface, as well as the acceleration of the drop immediately after the impact with the interface, are analysed. Lastly, new observations on the shape of the ruptured film and on entrainment of oil in the water phase are presented.
2 Experiment design and methodology
2.1 Experimental set-up and materials
The experimental set-up for the investigation of the delayed coalescence of drops with a liquid–liquid interface is shown in figure 1(a). A rectangular flow channel with a 5 cm  $\times$ 5 cm cross-section and 1 m length was built for the tests. The flow channel was connected to an inlet chamber and an outlet chamber through two openings at 5 mm above the bottom wall, as shown in figure 1(b). Initially, an aqueous phase of glycerol solution in water (density
  $\unicode[STIX]{x1D70C}_{d}=1210~\text{kg}~\text{m}^{-3}$, viscosity
  $\unicode[STIX]{x1D707}_{d}=54~\text{mPa}~\text{s}^{-1}$) was introduced into the channel by a Cole-Parmer® magnetic drive centrifugal pump. The pump was stopped and the valves were closed to hold the liquid in the channel with a surface height approximately equal to 15 mm from the bottom. The organic phase (Exxsol D80 oil, density
  $\unicode[STIX]{x1D70C}_{o}=804~\text{kg}~\text{m}^{-3}$, viscosity
  $\unicode[STIX]{x1D707}_{o}=1.75~\text{mPa}~\text{s}^{-1}$) was then added into the channel through an oil inlet at 10 cm away from the outlet. The thickness of the oil film was set at approximately 20 mm. A flat stationary interface (interfacial tension
  $\unicode[STIX]{x1D70E}=26.73~\text{mN}~\text{m}^{-1}$) formed in the flow channel. The volume concentration of the glycerol was set at 78 % to match the refractive index of the Exxsol D80 oil (
 $r_{ref}=1.443$ at
  $20\,^{\circ }\text{C}$) and prevent light aberration at the interface in the optical experiments. The refractive indices of the fluids were measured with an Abbe 5® refractometer.

Figure 1. (a) Schematic of the experimental set-up. (b) Design details of the main flow channel along with the inlet chamber and the outlet chamber. (c) Image of the PLIF tests showing the nozzle position for delivering the drops. (d) Typical PIV raw image showing a drop surfing on the interface.
Subsequently, the valves were opened and the pump was restarted to circulate the 78 % glycerol solution in the channel. Because of the motion of the water phase, the interface was also set in motion. As shown in figure 1(b), a baffle was placed opposite the aqueous-phase inlet to dampen any disturbances on the flat interface. In addition, the bottom of the wall that separated the inlet chamber from the main channel had a smooth shape to reduce any waves at the interface. In the outlet chamber, a cross-shaped obstacle was placed in the drain hole to prevent any vortices forming. In the experiments, the interface speed was varied by changing the flow rate of the aqueous phase through the centrifugal pump. A rotameter with a maximum flow rate at  $1~\text{l}~\text{min}^{-1}$ with 5 % accuracy was installed in the inlet tube to monitor the flow rate.
As shown in figure 1(b), the aqueous-phase drops were generated by supplying the fluids from a syringe to a flat-ended nozzle that was located 30 cm away from the inlet. The flow rate in the nozzle was controlled by a programmable Aladdin® syringe pump and was set at  $0.2~\text{ml}~\text{min}^{-1}$. The inner diameter of the nozzle is 2 mm, which produces drops of an average size of
  $5\pm 0.15$ mm. As mentioned by Klyuzhin et al. (Reference Klyuzhin, Ienna, Roeder, Wexler and Pollack2010), the drop rest time, which is the difference between the time that the drop contacts the interface and the coalescence time, could be affected by the height of the nozzle from the interface. It was also found that the rest time was reduced when the nozzle was closer to the interface. The height of the nozzle was set at 10 mm above the interface for all tests, as shown in figure 1(c). To decide upon the design of the experimental set-up, some computational fluid dynamics simulations were carried out initially, which showed that for the aqueous-phase velocities used there was a weak circulation of the oil phase in the upper part of the channel. Placing the nozzle at 10 mm above the interface avoids the effect of the backflow on the drops. In addition, it was found from the simulations that the flow of the two phases reaches steady state in approximately 40 s. In the experiments, several drops were released and measurements were taken when the drops were found to move at a constant speed on the interface. For brevity in what follows, the drop interface is called the drop surface while the liquid–liquid interface between the oil and the aqueous bulk phases is called the (bulk) interface.
2.2 Experimental methodology
The rest times of the drops on the interface moving at different speeds were initially measured to evaluate the delay in coalescence. The falling time of the drops from the nozzle to the interface at the beginning and the coalescence time at the end were neglected, as they were very short compared to the rest period. A stopwatch with an accuracy of 0.01 s was used to measure the rest times. It was previously found that approximately 50 runs were sufficient to capture the distribution of the rest times of the drops with a stationary interface (Dong et al. Reference Dong, Weheliye, Chausset and Angeli2017, Reference Dong, Weheliye and Angeli2019). In the current experiments, approximately 200 runs were conducted for each set of conditions to reduce uncertainties caused by the moving interface.
High-speed PLIF was then utilized to visualize the motion of the drop and the shape of the film, as was also shown by Oldenziel, Delfos & Westerweel (Reference Oldenziel, Delfos and Westerweel2012). The PLIF system consists of a Laserglow® continuous-wave laser (532 nm, 3 W) placed below the flow channel, which emits a laser beam with 4 mm diameter (see figure 1a). A spherical lens and a cylindrical lens were connected to the head of the laser in series to create a 1 mm thick laser sheet, which was directed to the flow channel by a  $45^{\circ }$ angle mirror. As the drop was generated in the middle of the channel in the
  $y$ direction and no appreciable deviation from the centre was observed when it travelled with the interface along the
  $x$ direction (see figure 1c), the middle plane of the drop could be illuminated when it went through the laser plane. A small amount of the fluorescent dye Rhodamine 6G was dissolved in both the drop and the aqueous film to help distinguish the interfaces and the structure of the oil film trapped between the drop and the bulk interface. A Phantom® V1212 high-speed camera, equipped with a mono-zoom Nikkon lens, which gave a spatial resolution of
  $14~\unicode[STIX]{x03BC}\text{m}~\text{pixel}^{-1}$, was placed perpendicular to the laser sheet to capture the whole process. Since it was quite challenging to track the motion of the drops by moving the high-speed PLIF system, the laser plane and the high-speed camera were located at different distances up to 20 cm away from the location of the drop impact onto the interface. The frame rate of the high-speed camera was set at 1000 frames per second to record clear images at each instant. The PLIF video showing the drop travelling along the interface from the impact position is given as Movie 1 in the supplementary movies available online at https://doi.org/10.1017/jfm.2020.192.
The velocity fields in the drop were also studied with PIV. For these measurements, the drops were seeded with  $1~\unicode[STIX]{x03BC}\text{m}$ Rhodamine-coated spherical particles. A typical PIV raw image of an aqueous drop close to the oil–aqueous interface is shown in figure 1(d). As the size of the droplet is larger than the thickness of the laser sheet, the drop surface curvature should not affect the measurements. The open-source freeware JPIV was used to post-process the images obtained from the camera through the adaptive correlation tracking of the full image with a final interrogation window of
  $32\times 32$ pixels. A 50 % window overlap was used for a final resolution of
  $16\times 16$ pixels, corresponding to an area of
  $0.2~\text{mm}\times 0.2~\text{mm}$.

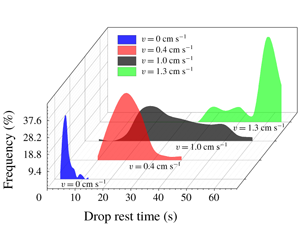
Figure 2. Probability distribution of drop rest time at the liquid–liquid interfaces with different speeds.
3 Delayed coalescence and lubrication model
The experiments showed that drop coalescence is significantly delayed when the oil–water interface is moving. Figure 2 shows the probability distribution of the drop rest times at interfaces of different speeds. When the interface is stationary, most of the drops break in less than 10 s with a peak coalescence time at approximately 4 s. When the interface is moving, however, an increase of the drop rest time is observed. At an interface speed of  $v=0.4~\text{cm}~\text{s}^{-1}$, the drop rest time presents a normal distribution, while no drop was found to coalesce in less than 10 s. Compared to the distribution with stationary interfaces, the peak shifts to approximately 20 s. When the speed of the interface reaches
  $v=1.0~\text{cm}~\text{s}^{-1}$, the distribution of the drop rest time becomes wider than the former two at
  $v=0$ and
  $v=0.4~\text{cm}~\text{s}^{-1}$; some of the drops survive until 60 s, while a few break in less than 10 s. At
  $v=1.3~\text{cm}~\text{s}^{-1}$, the rest time shows a multimodal distribution, with three peak values located at various times. Despite this, however, the rest time is greatly increased compared to that at
 $v=1.0~\text{cm}~\text{s}^{-1}$. For many of the drops at
  $v=1.3~\text{cm}~\text{s}^{-1}$, coalescence does not happen within the channel. As these cases are not included in the statistical analysis, a sharp decrease is seen after the peak.
The coalescence of drops with liquid–liquid interfaces is complex and can be influenced by many factors (Chan, Klaseboer & Manica Reference Chan, Klaseboer and Manica2011), which explains the deviations of the rest time distributions from the normal one. Figure 2 clearly shows that coalescence is significantly delayed when the interface speed is increased. This is attributed to the lubrication pressure that develops in the film between the drop and the bulk interface, which resists the settling of the drop (Hamrock, Schmid & Jacobson Reference Hamrock, Schmid and Jacobson2004). As will be discussed in the following section, after the initial impact and rebound on the interface, the released drop moves forwards under the influence of the moving interface. After the drop rebounds, the Reynolds number of the draining film,  $Re=\unicode[STIX]{x1D70C}_{o}uh/\unicode[STIX]{x1D707}_{o}$, is lower than 1, where
  $h$ and
  $u$ refer to the film thickness and the velocity of the film liquid. Thus the inertial term in the Navier–Stokes equations can be considered negligible (Geri et al. Reference Geri, Keshavarz, McKinley and Bush2017; Nakayama Reference Nakayama2018; Sawaguchi et al. Reference Sawaguchi, Matsuda, Hama, Saito and Tagawa2019). During the drop impact and rebound,
  $Re$ might be close to 1 because the film is thick and the inertia of the film fluid should not be ignored. However, according to Sambath et al. (Reference Sambath, Garg, Thete, Subramani and Basaran2019), the inertia of the film liquids has little effect on the impact dynamics compared to the liquid in the drop. The corresponding two-dimensional momentum equation for the lubrication film can be reduced to
 $$\begin{eqnarray}\frac{\unicode[STIX]{x2202}p}{\unicode[STIX]{x2202}x}=\unicode[STIX]{x1D707}\frac{\unicode[STIX]{x2202}^{2}u}{\unicode[STIX]{x2202}z^{2}}.\end{eqnarray}$$
Figure 3. Schematic of the mass conservation in the control volume (hatched area) in the thinning film.
As shown in figure 3, a two-dimensional control volume with a unit width in the direction perpendicular to the  $x$–
$x$– $z$ plane is taken into consideration with the boundary conditions
  $z=0$ and
  $u=u_{b}$ at the bulk interface and
  $z=h$ and
  $u=u_{d}$ at the drop surface. According to Leal (Reference Leal2007), one of the two interfaces, the bottom bulk interface, is assumed to be flat to simplify the model. By integrating equation (3.1) with the boundary conditions, the velocity in the film is found to be equal to
 $$\begin{eqnarray}u=-z\left(\frac{h-z}{2\unicode[STIX]{x1D707}}\right)\frac{\unicode[STIX]{x2202}p}{\unicode[STIX]{x2202}x}+u_{b}\left(\frac{h-z}{h}\right)+u_{d}\frac{z}{h},\end{eqnarray}$$
 where  $u_{d}$ and
  $u_{b}$ are, respectively, the velocities along the drop surface and the interface in the film region, with thickness
  $h$. Considering mass conservation, the rate of mass change in the control volume is equal to the difference between the mass rate flowing into and leaving the control volume, that is,
 $$\begin{eqnarray}-\frac{\unicode[STIX]{x2202}(\unicode[STIX]{x1D70C}Q_{x})}{\unicode[STIX]{x2202}x}=\frac{\unicode[STIX]{x2202}(\unicode[STIX]{x1D70C}h)}{\unicode[STIX]{x2202}t},\end{eqnarray}$$
 where  $Q_{x}$ is the volume flow rate per unit width
  $Q_{x}=\int _{0}^{h}u\,\text{d}z$. In the current experiments, the liquid in the film is incompressible and the density
  $\unicode[STIX]{x1D70C}$ is constant. The right-hand side of (3.3) can then be written as
 $$\begin{eqnarray}\frac{\unicode[STIX]{x2202}h}{\unicode[STIX]{x2202}t}=w_{d}-w_{b}-\frac{\unicode[STIX]{x2202}h}{\unicode[STIX]{x2202}x}u_{d},\end{eqnarray}$$
 where  $w_{d}$ and
  $w_{b}$ represent the approaching velocities of the drop surface and the bulk interface. By substituting (3.4) into (3.3), the pressure distribution in the film is expressed as
 $$\begin{eqnarray}\frac{\unicode[STIX]{x2202}}{\unicode[STIX]{x2202}x}\left(\frac{h^{3}}{12\unicode[STIX]{x1D707}}\frac{\unicode[STIX]{x2202}p}{\unicode[STIX]{x2202}x}\right)=\frac{\unicode[STIX]{x2202}}{\unicode[STIX]{x2202}x}\left(\frac{h\left(u_{d}+u_{b}\right)}{2}\right)+\left(w_{d}-w_{b}\right)-u_{d}\frac{\unicode[STIX]{x2202}h}{\unicode[STIX]{x2202}x}.\end{eqnarray}$$
 According to (3.5), the lubrication pressure in the film can be generated by (i) the variation of the film thickness, (ii) the interface velocity along the flow direction, and (iii) the approaching speed of the two interfaces. For coalescence with a stationary interface, the tangential velocities along the drop surface and the interface,  $u_{d}$ and
  $u_{b}$, are zero. Only the second term on the right-hand side of (3.5) contributes to the pressure. As (
 $w_{d}{-}w_{b}$) reduces quickly in the current experiments, the resulting lubrication pressure is not able to resist coalescence for a long time. Therefore, the drop coalesces rapidly with the bulk interface. When the interface is moving, the other two terms on the right-hand side come into effect and increase the lubrication pressure, thus delaying coalescence. The dynamics of lubrication flow and the resulting distribution of pressure for a drop resting on a moving interface will be analysed in detail in § 5.
4 General observations
4.1 Drop deformation during initial impact with the interface
After their release from the nozzle, the drops initially impact on the interface and rebound. Just before the impact, the velocity of the drop bottom starts to decrease while the upper part of the drop still accelerates due to gravity. By taking the drop bottom as a reference, the impact velocity is decreasing from approximately  $4~\text{cm}~\text{s}^{-1}$ in the vertical direction. As described in § 2, the impact velocity of the drops was kept the same by setting the nozzle at the same height and keeping the same flow rate of the drop phase for all tests. Figure 4(a) shows the changes in the drop and the interface shape during the impact and rebound period. The drop shape is characterized by the ratio of the horizontal to the vertical diameter,
  $D_{h}/D_{v}$. As can be seen, the changes in the drop shape are similar for all interface velocities. A typical case is presented in figure 4(b) for an interface of
  $v=3.4~\text{cm}~\text{s}^{-1}$.
At the initial impact period between  $t=0~\text{ms}$ (when the drop starts to press against the interface) and approximately
  $t=30~\text{ms}$, there is large resistance to the downward movement to the bottom of the drop from the interface, while the top of the drop still moves downwards from the effect of gravity. As a result, the drop extends horizontally at approximately
  $t=25~\text{ms}$ to a maximum
  $D_{h}/D_{v}$ of approximately 1.7. This is followed by the contraction of the drop and a reduction in
  $D_{h}/D_{v}$, driven by surface tension. The energy released from the drop contraction and the effect of gravity cause the drop to further descend until the interface reaches a minimum height at
  $t=50~\text{ms}$. As is shown in figure 4(b), during the drop contraction from
  $t=26~\text{ms}$ to
  $t=46~\text{ms}$, the height of the bottom surface of the drop decreases while the height of the upper surface of the drop slightly increases. The Laplace force from the deformed interface starts to push the drop upwards. This causes the drop to deform again and extend horizontally. However, the increase of the diameter ratio
  $D_{h}/D_{v}$ and the drop deformation is far less than those in the impact period, as can also be seen from the drop shapes in figure 4(b).

Figure 4. (a) Variation of the drop deformation characterized by the diameter ratio  $D_{h}/D_{v}$ and the descent depth of the drop bottom from its initial position at
  $t=0~\text{ms}$ when the drop contacts the interface; the data are averaged from five tests with standard deviation less than 6.8 %. (b) The impact and rebound of a single drop at the fluid interface of
  $v=3.4~\text{cm}~\text{s}^{-1}$.
The changes in the drop shape observed in the current experiments are similar to those reported by Mohamed-Kassim & Longmire (Reference Mohamed-Kassim and Longmire2003) for droplets impacting on stationary liquid–liquid interfaces. Two maxima of the horizontal diameter, similar to what is shown in figure 4(a), were observed as well in their tests. In addition, a minimum in the descending depth, at the end of the first horizontal extension of the drop, was also observed. As the impact velocity of the drops in the work by Mohamed-Kassim & Longmire (Reference Mohamed-Kassim and Longmire2003) (equal to the terminal velocity of the drop, which is 9.8– $13.2~\text{cm}~\text{s}^{-1}$) is much larger than in the work here (
 ${<}4~\text{cm}~\text{s}^{-1}$), the first maximum of the deformation of the drop
  $D_{h}/D_{v}$ (1.72–2.28) is also higher than the one measured here.

Figure 5. Change of drop velocity with time (a) over the whole measuring period, and (b) during the initial impact and rebound period. The velocity values in the legend are determined by tracking the motion of the drops at the final stage when the velocity is the same as that of the bulk interface. The fitting curves of the data are plotted in solid lines to help visualization.
A high impact velocity causes the drops to descend further into the interface. In the current experiments, the minimum descending depth of the droplet is approximately  $0.35D$ at
  $t=50~\text{ms}$, where
  $D$ is the volumetric equivalent diameter of the droplet. In the tests of Mohamed-Kassim & Longmire (Reference Mohamed-Kassim and Longmire2003), the descent depth could reach
  $1.1D$ at an impact velocity of
  $13.2~\text{cm}~\text{s}^{-1}$. A larger deformation of the bulk interface produces a stronger rebound of the droplet in the following stage. Accordingly, the maximum value of
  $D_{h}/D_{v}$ in the second horizontal extension of the drop can even exceed the value of the first maximum under a large impact velocity of
  $13.2~\text{cm}~\text{s}^{-1}$. In the results shown here, the second maximum of
  $D_{h}/D_{v}$ at the rebound stage is decreased to approximately 1.3. The oscillation time of impact and rebound varies a lot under different conditions. In the tests of Mohamed-Kassim & Longmire (Reference Mohamed-Kassim and Longmire2003), the second horizontal extension finished at 300–350 ms, while in this work the second maximum is reached much earlier at approximately
  $t=100~\text{ms}$. The droplet oscillation is affected by many factors, including the impact height, the droplet size and the fluid properties (Hartland, Ramakrishnan & Hartley Reference Hartland, Ramakrishnan and Hartley1975; Mohamed-Kassim & Longmire Reference Mohamed-Kassim and Longmire2003). Recently, Vakarelski et al. (Reference Vakarelski, Yang, Tian, Li, Chan and Thoroddsen2019) found that the mobility of the interface can also affect the drop rebound. In the current tests, the droplets are released from a height close to the interface to avoid large oscillations.
4.2 Drop movement
The velocity of a drop surfing along the moving interface is measured from the images by tracking the displacement of the central point of the maximum horizontal span of the drop. This is taken as a representative point for the velocity during the impact and the rebound stages, when the drop shape changes significantly and the velocities at different points of the drop can be different. For the period after the drop rebound, the shape of the droplet remains the same and any point in the drop can be used to track its velocity. As can be seen in figure 5(a), the drop speed increases fast initially during the impact and the rebound period (shaded area) for all interface velocity cases. This rapid increase is shown more clearly in figure 5(b). For the cases of low velocity ( $v=1.0~\text{cm}~\text{s}^{-1}$), the drops reach almost the velocity of the interface at the end of this period. For the faster interfaces, the drop velocity continues to increase after the initial period but at a low rate until it reaches the velocity of the interface. The acceleration of the drops is believed to be caused by the drag force from the surrounding liquid both in the film region and in the outside area. A rough estimate, however, reveals that the drag force alone is not able to give this acceleration to the drop (see appendix A). Because of the uneven distribution of the pressure in the film, the force acting normally on the drop bottom surface varies along the film. The integration of the local force along the drop surface is believed to produce a horizontal component that contributes to the drop acceleration along the flow direction.
4.3 Film thickness
The evolution of the film structure during the drop impact and rebound periods is discussed here. A typical PLIF image showing the shape of the film trapped between the drop and the oil–water interface is presented in figure 6(a). The fluorescent intensity along the vertical dotted line in the image is shown in figure 6(b). As can be seen, the light intensity is significantly reduced across the film region. The film thickness is calculated by measuring the vertical distance between the two  $z$-points with maximum light gradient as proposed by Oldenziel et al. (Reference Oldenziel, Delfos and Westerweel2012).
For interface speed equal to  $v=1~\text{cm}~\text{s}^{-1}$, a decrease of the film thickness along the flow direction is observed when the drop approaches the interface (see figure 7(a) from
  $t=8~\text{ms}$ to
  $t=13~\text{ms}$). As the bulk interface at this time is not deformed significantly, the structure of the film is similar to the cases of a drop resting on a thin air film (Lhuissier et al. Reference Lhuissier, Tagawa, Tran and Sun2013; Sawaguchi et al. Reference Sawaguchi, Matsuda, Hama, Saito and Tagawa2019). From
  $t=13~\text{ms}$ to
  $t=23~\text{ms}$, the film thickness continues to decrease. At this stage, the film has a dimple shape with a thicker area at the centre and a thinner area at the border, which is commonly seen in the coalescence of drops with stationary interfaces (Klaseboer et al. Reference Klaseboer, Chevaillier, Gourdon and Masbernat2000). According to (3.5), while the drop is approaching the interface, the tangential velocity of the interface is low, and the velocity difference (
 $w_{d}-w_{b}$) is the dominant term in the calculation of the film lubrication pressure. It has been shown that the lubrication pressure resulting from a drop approaching a flat interface has an approximately concave shape with a peak near the centre (Yiantsios & Davis Reference Yiantsios and Davis1990). The film, therefore, thins more slowly at the centre than at the border and acquires a dimpled shape.

Figure 6. (a) Raw PLIF image showing the film shape. (b) Variation of the light intensity  $I$ (left axis) and intensity gradient
  $\unicode[STIX]{x0394}I/\unicode[STIX]{x0394}z$ (right axis) along the vertical dashed (yellow) line in panel (a).

Figure 7. The variation of the film thickness during drop impact and rebound at bulk interface velocities (a,b)  $v=1.0~\text{cm}~\text{s}^{-1}$, (c,d)
  $v=2.1~\text{cm}~\text{s}^{-1}$, and (e,f)
  $v=3.4~\text{cm}~\text{s}^{-1}$. The vertical dotted (red) lines represent the locations with the maximum film thicknesses at the last time step of the measurement.
During the drop rebound period, after  $t=58~\text{ms}$, the film thickness should continue to decrease as the liquid in the film is still draining. However, the central part of the film seems to refill and form a peak from
  $t=58~\text{ms}$ to
  $t=83~\text{ms}$, as shown in figure 7(b). It is believed that it is not only the uneven distribution of the pressure in the film that causes the formation of the peak but also the horizontal shrinkage of the film. Figure 8(a) illustrates the change of the horizontal locations of the minimum film thickness points over time. The distance between the two points, regarded as the film width, is shown in figure 8(b). For interface speed of
  $v=1.0~\text{cm}~\text{s}^{-1}$, the film has expanded to a maximum width at approximately
  $t=30~\text{ms}$, after which the width starts to decrease until a minimum value is reached at
  $t=100~\text{ms}$. This horizontal film contraction is believed to accumulate the liquid in the centre and to generate the peak. As the width of the film slightly increases after 100 ms (figure 8b), the refill of the film stops and the film continues to thin while preserving its dimpled shape. The effect of the interface speed is low for this case, and the peak of the film thickness is located at the centre.

Figure 8. (a) Variation of the horizontal locations of the minimum film thickness against time  $t$. The initial values were taken at 5 ms after the drop contacts the bulk interface. (b) Evolution of the film width; only the cases
  $v=1.0~\text{cm}~\text{s}^{-1}$ and
  $v=3.4~\text{cm}~\text{s}^{-1}$ are shown to help visualization.
For the higher interface speed of  $v=2.1~\text{cm}~\text{s}^{-1}$, the tangential velocity along the interface also contributes to the lubrication pressure in addition to the drop approaching velocity. As will be discussed in § 5, the pressure tends to be uniformly distributed in the film in this case and the dimpled structure is not as obvious as for
  $v=1~\text{cm}~\text{s}^{-1}$, as shown in figure 7(c) during the drop impact from
  $t=3~\text{ms}$ to
  $t=24~\text{ms}$. During the drop rebound, the film also refills and a peak is formed. At
  $t=53~\text{ms}$, the film forms a plateau around the centreline. Between
  $t=53~\text{ms}$ and
  $t=100~\text{ms}$ (figure 8a), the thin part of the film upstream moves faster than that one downstream. As a result, the film peak is slightly shifted downstream. When the interface speed increases to
  $v=3.4~\text{cm}~\text{s}^{-1}$, the interface velocity contribution to the lubrication pressure is further increased and the dimple structure is less obvious. During the rebound, the film width does not contract as much as in the lower interface velocities (figure 7d) and the refill is not obvious. In addition, the peak is shifted further away from the centre compared to
  $v=2.1~\text{cm}~\text{s}^{-1}$.
4.4 Drop inner circulation
The velocity of the liquid inside the drop was measured with PIV. This is shown for a moving interface of  $v=2.1~\text{cm}~\text{s}^{-1}$ in figure 9. To observe the circulation patterns and isolate the circulation from the horizontal motion of the drop, the horizontal translational speed of the centre of mass of the drop was subtracted from the local velocity. During the initial impact and rebound period, no circulation is seen as the drop undergoes a large deformation. Shortly after, recirculation appears in the drop, as shown in figure 9(a). At this time, the drop rotates like a rigid body with the centre of rotation coinciding with the drop centre, which is similar to what was previously observed for drops resting at a hydraulic film jump (Sreenivas et al. Reference Sreenivas, De and Arakeri1999) and on a steady air film (Sawaguchi et al. Reference Sawaguchi, Matsuda, Hama, Saito and Tagawa2019). But unlike those cases, as the drop accelerates to the velocity of the interface, the inner circulation decays.

Figure 9. Velocity fields ( $\text{m}~\text{s}^{-1}$) in the drop at different locations away from the impact point for
  $v=2.1~\text{cm}~\text{s}^{-1}$. The velocity is the value relative to the translational velocity of the drop, which is measured by detecting the trajectory of the centre point of the drop. The solid lines outline the drop surface.
When the drop travels to  $L=0.5~\text{cm}$ away from the impact point, the velocity at the lower part of the drop becomes comparable to that in the bulk. The shear force acting on the bottom surface of the drop is believed to decrease. On the other hand, the average speed of the drop becomes higher than that of the surrounding oil phase. The shear force on the upper surface of the drop from the surrounding oil contributes to the circulation inside the drop and a backflow with large velocity in the top area of the drop is observed. This is not balanced by the shear force at the bottom of the drop and the centre of rotation does not coincide with the drop centre any more. At
  $L=1~\text{cm}$, the centre of rotation covers a wide area close to the bottom of the drop, which indicates that the shear force at the bottom surface is small. At
  $L=2~\text{cm}$, only the liquid in the upper part of the drop has a backward flow, while the rest of the drop liquid travels with the same velocity as the average drop speed. The backward flow seen in figures 9(c) and 9(d) at the top of the drop is not balanced by an equivalent forward flow near the bottom of the drop and suggests that there is no mass conservation of the liquid in the drop. Both Sreenivas et al. (Reference Sreenivas, De and Arakeri1999) and Sawaguchi et al. (Reference Sawaguchi, Matsuda, Hama, Saito and Tagawa2019) commented that the internal flow in a drop levitated on a moving surface is complicated. Some of their results have shown that secondary flows appear at the bottom of the drop with direction out of the measuring plane. To analyse these phenomena qualitatively, three-dimensional velocity profiles would be needed.
5 Lubrication flow in the film
5.1 Lubrication flow
As discussed above, the lubrication pressure in the film is considered to be responsible for the delayed coalescence of the drop with the interface. However, the film thickness is not uniform, while both the drop surface and the oil–water interface are moving, which would make simulations challenging. Instead, a simplified approach was followed here to explore the lubrication pressure variation in the film. It was found that a drop, pendent from the nozzle, did not coalesce with a moving interface for a very long time (see Movie 2 and figure 10a). In a similar case reported by Dell’Aversana et al. (Reference Dell’Aversana, Banavar and Koplik1996), of a drop contacting a moving liquid surface, a wake was observed on the interface after the drop has passed. In the current system, no wake was seen, perhaps because the thickness of the bulk liquid is large, approximately 15 cm, and there is no effect from the bottom wall on the interface flow as was seen by Dell’Aversana et al. (Reference Dell’Aversana, Banavar and Koplik1996).
The thicknesses of the film trapped between the drop and the bulk homophase at various time steps was measured. As shown in figure 10(b), the film thickness slightly decreases along the flow direction while the film structure does not change significantly with time. Therefore, the case can be regarded as a steady-state process. To investigate the lubrication pressure in the film, a numerical simulation is set where the drop surface and the bulk interface are regarded as solid boundaries with a given tangential velocity. These velocities are taken from the experimental data. The velocity at the bulk interface is found to decrease along the flow direction until a minimum value is reached roughly at the centre point. Afterwards, the velocity increases further downstream. The velocity along the drop bottom surface is almost constant in the region of the thin film (see figure 10c). The velocities along the bulk interface and the drop surface are measured by tracking the motion of the particles in the vicinity of the interface. The methods and the details of the simulation are discussed in appendix B.

Figure 10. (a) A pendent drop resting on the interface without coalescence. The origin of the axes is at the centre of the maximum width of the deformed drop, which is defined as  $2R$. (b) Thickness of the film trapped between the drop surface and the liquid–liquid interface. The film thickness is averaged from five different times when a drop levitates on the interface, and the error bars show the standard deviation. (c) The magnitude of the velocity along both the drop surface and the interface of the bulk liquid. The spatial location is normalized by the drop ‘radius’
  $R$.
$R$.
Figure 11(a) shows the simulated pressure in the trapped film. As can be seen, the pressure is positive in the majority of the film region. This pressure resists the contact of the drop surface with the oil–water interface. In the current experiments, as the drop approaches, the oil–water interface deforms more than in the cases reported in the literature of drops levitated over a thin layer of air (Sawaguchi et al. Reference Sawaguchi, Matsuda, Hama, Saito and Tagawa2019). As a result, the pressure distribution calculated here is slightly different from the former cases. In the experiments of Sawaguchi et al. (Reference Sawaguchi, Matsuda, Hama, Saito and Tagawa2019), the pressure in the film region is almost constant except for a sharp decrease at both the entrance and the exit sides of the film. In the current work, the pressure increases along the flow direction from the film entrance to the centre, where a peak is observed. Downstream from the centre, the pressure decreases until a minimum value is reached at the exit of the film. As discussed by Sawaguchi et al. (Reference Sawaguchi, Matsuda, Hama, Saito and Tagawa2019), the negative pressure in the film, which tends to pull the interfaces together, is balanced by the Laplace force created by the local surface deformation. Thus coalescence is effectively prevented. Once the drop surface curvature is not able to balance the low pressure, the film breaks and coalescence is observed in the corresponding location. A typical case of such coalescence is shown in Movie 3.

Figure 11. (a) The lubrication pressure along the film. (b) Velocity profiles at different locations in the trapped film for the case of a pendent drop on the moving interface as shown in figure 10(a).
The variation of the lubrication pressure in the trapped film also affects the velocity profile. As shown in figure 11(b), the liquid near the film entrance roughly at location 1 is pulled in to the film by the bulk moving phase. From the film entrance at location 1 along to the approximately central position at location 3, the velocity has a concave shape along the cross-section of the film. Downstream of the central point, the drop motion pushes the film liquid out, and the velocity profile acquires a convex shape. The variation of the velocity profile in the film agrees well with the profiles in lubrication oil films in classical lubrication theory (Hamrock et al. Reference Hamrock, Schmid and Jacobson2004).
5.2 Lubrication pressure
At any point on the drop surface, the internal pressure in the drop is balanced by the external pressure in the film and the Laplace pressure resulting from the interface curvature:
 $$\begin{eqnarray}P_{in}=P_{out}+\unicode[STIX]{x1D70E}(\unicode[STIX]{x1D705}_{r}+\unicode[STIX]{x1D705}_{z}),\end{eqnarray}$$
 where  $P_{in}$ and
  $P_{out}$ refer to the pressure inside the drop and in the film, respectively. The pressures
  $P_{in}$ and
  $P_{out}$ combine both the hydrostatic pressure due to the density difference between the droplet and the surrounding liquid and the hydrodynamic frictional pressure. In (5.1),
  $\unicode[STIX]{x1D705}_{r}$ is the main curvature of the surface and
  $\unicode[STIX]{x1D705}_{z}$ is the curvature normal to
  $\unicode[STIX]{x1D705}_{r}$. Applying (5.1) in the film flow, the lubrication pressure can be estimated if the local curvature of the drop surface and the drop internal pressure are known. For an accurate estimation of the pressure, the two components of the curvature
  $\unicode[STIX]{x1D705}_{r}$ and
  $\unicode[STIX]{x1D705}_{z}$ should be known. However, in the current experiments, where only the two-dimensional profile of the drop is acquired, the azimuthal component of the curvature is unknown. As the drop bottom in the film region is relatively flat under the pressure from the bulk interface, the azimuthal component of the curvature is considered small and is neglected (Duchemin, Lister & Lange Reference Duchemin, Lister and Lange2005; Lhuissier et al. Reference Lhuissier, Tagawa, Tran and Sun2013). The pressure variation was estimated with the PIV velocity data according to the methods explained by Oudheusden (Reference Oudheusden2013). Inside the drop it was found that the pressure variation induced by the internal flow is much lower than the hydrostatic pressure. Thus, only the hydrostatic pressure is considered. The lubrication pressure in the film relative to the pressure at the film exit
  $p_{0}$, where the drop surface curvature is maximum, is calculated as follows:
 $$\begin{eqnarray}\unicode[STIX]{x0394}P_{l}=(\unicode[STIX]{x1D70C}_{d}-\unicode[STIX]{x1D70C}_{s})gH+\unicode[STIX]{x1D70E}(\unicode[STIX]{x1D705}_{0}-\unicode[STIX]{x1D705}_{i}),\end{eqnarray}$$
 where  $\unicode[STIX]{x1D705}_{0}$ and
  $\unicode[STIX]{x1D705}_{i}$ are the curvature at the reference point
  $p_{0}$ at the film exit and at a point
  $p_{i}$ in the film region considered.

Figure 12. Comparison of the film pressure calculated by the local curvature of the pendent drop surface with the numerically simulated pressure. The data shown are averaged from the pressures at five different time steps. The error bars show the standard deviation.
The variation of the pressure for the case discussed in § 5.1 (see figure 11) is shown in figure 12. It is seen that the pressure values calculated from (5.2) are slightly lower than the simulated ones in most of the film region. As previously discussed by Smith & Neitzel (Reference Smith and Neitzel2006) and Lhuissier et al. (Reference Lhuissier, Tagawa, Tran and Sun2013), flow can also occur in the film in a direction lateral to the main flow in the experiments. In the two-dimensional simulations, however, there is no lateral flow and all the liquid entering the film flows in one direction and contributes to the lubrication pressure. The pressure values calculated from (5.2) are higher than the simulated ones in the area near the film exit. A similar discrepancy was also observed by Lhuissier et al. (Reference Lhuissier, Tagawa, Tran and Sun2013), who, based on a similar approach, found that the calculated air film shape differs a lot from the measured shape in the region near the film exit. The error is attributed to the effects of the azimuthal component of the curvature, which is not taken into account in the calculation.
Equation (5.2) is then used to calculate the lubrication pressure in the film in the different cases studied. As the shape of the film evolves over time, the corresponding lubrication pressure changes as well. For all the interface speeds studied, the lubrication pressure is calculated when the drop recovers to a steady shape and constant speed at  $t$ = 130 ms after the drop impacts the interface (see figures 4 and 5). Figure 13(a) illustrates the variation of the surface curvature at the bottom of the drop, as well as the corresponding pressure distribution at
  $v=3.4~\text{cm}~\text{s}^{-1}$, as an example. The relative pressure in the film at different interface speeds is shown in figure 13(b).

Figure 13. (a) Relative lubrication pressure  $\unicode[STIX]{x0394}P_{l}$ at any point
  $p_{i}$ in the film for the case of a moving drop on the interface with velocity
  $v=3.4~\text{cm}~\text{s}^{-1}$ after the rebound. The pressure at point
  $p_{0}$ at the film exit is taken as reference. (b) Magnitude of
  $\unicode[STIX]{x0394}P_{l}$ in the film between the travelling drop and the bulk interface at different velocities and at
  $t$
= 130 ms. The pressure value is averaged over five different tests and the error bars show the standard deviation.
$t$
= 130 ms. The pressure value is averaged over five different tests and the error bars show the standard deviation.
As can be seen, when the drop is settled on the interface after the rebound, there is a large lubrication pressure in the film region, which resists the coalescence of the drop with the bulk interface. Consistently with what is predicted by (3.5), the pressure magnitude increases with the interface speed. The pressures shown in figure 13(b) are positive throughout the film region, because their magnitudes are relative to a minimum pressure at the film exit. When the absolute pressures are considered, then negative values are found at the film exit for all the cases investigated, similar to what is shown in figure 11(a). As discussed in § 5.1, once the negative pressure exceeds the magnitude that the Laplace pressure is able to resist, the two interfaces will be pushed together, resulting in film rupture (Sawaguchi et al. Reference Sawaguchi, Matsuda, Hama, Saito and Tagawa2019).
6 Drop coalescence
Coalescence occurs when the film separating the drop from the interface thins sufficiently for the van der Waals forces to become significant and cause its rupture (Hahn, Chen & Slattery Reference Hahn, Chen and Slattery1985). At the location of the film rupture, the liquid in the drop moves rapidly and helps locate the rupture point on the drop surface with high-speed imaging. Figure 14 shows the rupture points for all the coalescence events observed in the experiments. For the stationary interface, the rupture points are distributed equally around the drop middle point. Rupture rarely occurs near the centre, which is in good agreement with previous findings that the rupture points occur near the rim where the film is thinnest (Mohamed-Kassim & Longmire Reference Mohamed-Kassim and Longmire2004; Oldenziel et al. Reference Oldenziel, Delfos and Westerweel2012). At an interface speed of  $v=0.5~\text{cm}~\text{s}^{-1}$, more of the rupture points are in the front of the drop centre than at the back. Interestingly, most of the rupture events at the back are observed shortly after the impact due to instabilities. In contrast, the rupture events at the front usually occur after the drops have travelled some distance (
 $L>5$ cm). At higher interface speeds, all rupture points are located at the front part of the film. It has been shown that, when a drop travels along a stationary interface (Hale & Akers Reference Hale and Akers2016), the rupture points also tend to appear on the front part of the drop, in the direction of the flow, rather than at the back.

Figure 14. Distribution of rupture points for an interface with different speeds. The data acquired from different coalescence events are marked by different colours.
It is suggested that the locations of the rupture points are closely related to the spatial distribution of the lubrication pressure in the trapped film. For most of the cases where drops levitate on a moving liquid surface, the trapped air film thickness monotonically decreases from the upstream to the downstream location (Sreenivas et al. Reference Sreenivas, De and Arakeri1999; Lhuissier et al. Reference Lhuissier, Tagawa, Tran and Sun2013; Davanlou Reference Davanlou2016; Sawaguchi et al. Reference Sawaguchi, Matsuda, Hama, Saito and Tagawa2019). According to the classical lubrication theory, the generated pressure in the air film is able to make the drops levitate. As was shown in § 4.2, the variation of the film shape for drops approaching a liquid–liquid interface is more complex than in the case of drops approaching an air–liquid surface. After the drop rebound, the film still has a dimpled shape. The film thickness continues to evolve as the drop is travelling along the interface, as shown in figure 15 for two different locations. As the film thickness is close to the spatial resolution of the high-speed camera at distances larger than  $L=2$ cm, only film thicknesses for shorter distances are measured. As can be seen, between the drop rebound location (as shown in figure 7) and a distance
  $L=1$ cm, the film thickness decreases significantly in the upstream part of the drop and is almost uniform (left half of the film shown in figure 15) for all interface speeds. At the downstream part of the drop, the dimple structure survives and the film is thicker. The thinning of the film in the upstream location increases locally the lubrication pressure (Sreenivas et al. Reference Sreenivas, De and Arakeri1999), which prevents the drop from further approaching the interface. As a result, the rupture is less likely to happen in the upstream part of the drop, even though the film is thinner there than in the downstream location.

Figure 15. Film thickness at two different locations  $L$ from the drop impact point for interfaces of different speeds.
When the drops travel further downstream, the film thickness at the upstream part does not change a lot while it decreases at the front but still remains larger than at the back. As discussed previously, the expansion of the film in the dimple results in a low lubrication pressure in the corresponding area. The low pressure in this region is considered to be responsible for the rupture points to occur in the front part of the film, as shown in figure 14.
7 Oil entrainment
When a drop coalesces with a stationary interface, a meniscus is created immediately after the film rupture, which expands rapidly until the liquid in the drop completely merges with the bulk homophase. The expansion of the meniscus is resisted by the viscosity of the fluids at the initial stages, and later by the inertia of the liquids (Aarts & Lekkerkerker Reference Aarts and Lekkerkerker2008; Murano & Okumura Reference Murano and Okumura2018; Dong et al. Reference Dong, Weheliye and Angeli2019). It was found, however, that when drops coalesce with moving interfaces, the trapped film, before it fully drains, can break into ‘drop-strings’, where different-sized drops form connected with thin threads. The breakage of the film into drops observed here is different from what was found previously for a drop coalescing with a moving air–liquid interface. In the experiments of Hale & Akers (Reference Hale and Akers2016), the air film breaks into scattered bubbles, resulting in a Mesler entrainment (Esmailizadeh & Mesler Reference Esmailizadeh and Mesler1986). However, in the current experiments, the satellite drops produced by the breakage of the film remain connected to each other with oil-phase threads.

Figure 16. Formation of the ‘drops on a string’ during the coalescence of drops with moving interfaces with speeds of (a)  $v=2.1~\text{cm}~\text{s}^{-1}$,
  $L=0.5~\text{cm}$ and (b)
  $v=3.4~\text{cm}~\text{s}^{-1}$,
  $L=1$ cm. (c) Incomplete drop-string formation for a coalescence event at
  $v=3.4~\text{cm}~\text{s}^{-1}$,
  $L=5~\text{cm}$.
The breakage of the trapped film and the spatial evolution of the drop-string in the case of a drop coalescing with interfaces moving at  $v=2.1~\text{cm}~\text{s}^{-1}$ and
  $v=3.4~\text{cm}~\text{s}^{-1}$ is presented in figure 16. The coalescence of the drop at the interface of
  $v=3.4~\text{cm}~\text{s}^{-1}$ is shown in Movie 4 as a representative. The drop-strings shown in figure 16(a,b) are obtained with relatively thicker films. If the trapped film is thin at the moment of rupture, the resulting drop-string is not fully linked with the left and right interfaces. Instead, only a tendril linking the drop to the oil phase is observed (see the area circled by a yellow line in figure 16(c)), which is similar to what was shown previously (Aryafar & Kavehpour Reference Aryafar and Kavehpour2008; Oldenziel et al. Reference Oldenziel, Delfos and Westerweel2012). The drop-strings produced here are similar to the breakage of a viscoelastic filament (Bhat et al. Reference Bhat, Appathurai, Harris, Pasquali, McKinley and Basaran2010). As the drop-strings were not seen to form in the case of a drop coalescing with a stationary interface with the same liquids, it is believed that the phenomenon is not caused by contamination that may change the interfacial properties of the fluids.
When a drop coalesces with a stationary interface, the meniscus that forms after rupture increases and the film can drain from all sides of the drop until it is completely drained. However, when the coalescence is with a moving interface, it was found that, before the film can completely drain, another coalescence event appears at the side of the drop leading to oil entrained in the bulk water phase, as shown by the areas circled in red in figure 16(a,b). Subsequently, the entrained oil film starts to form drops under the influence of interfacial tension resulting in the ‘drops on a string’ structure. The capillary waves, initially created at the onset of the film rupture, may further hinder the trapped oil to contract to a liquid body and favour the generation of the drop-strings (Charles & Mason Reference Charles and Mason1960).
8 Conclusions
Surfing of drops and delayed coalescence on moving liquid–liquid interfaces is relevant to many industrial applications but has not been studied previously. The aim of this work is to explore the behaviour of travelling aqueous drops on moving oil–water interfaces. Studies were carried out in a novel flow channel, using a combination of PLIF and PIV techniques to obtain the evolution of the shapes of the drops, of the film thickness and of the tangential velocities at the drop surface and the bulk liquid–liquid interface, as the drops impact on the interface and move along. It was found that drop coalescence is delayed by the moving interface and that the delay increases with the interface speed. The delay is attributed to the lubrication pressure in the film trapped between the drop and the interface. This pressure was calculated based on the local curvature of the drop surface and the tangential velocities on the drop surface and on the bulk interface in the film region. For the case of a stationary drop, the results were also compared with numerical simulations with good agreement. The results reveal that the lubrication pressure is high along most of the film, preventing the drop from approaching the interface, and increases with the interface velocity. The film has a dimple shape, with increased thickness close to the exits, which locally decrease the lubrication pressure. The reduced pressure in the dimple regions allows the drop to approach the interface and will eventually lead to film rupture. As the interface velocity increases, the dimple shape becomes less obvious, especially at the upstream part of the drop. As a result, with increasing interface velocity, film rupture occurs at the downstream part of the drop, where the film retains its dimple shape.
The current findings will be relevant to studies of dispersed flows and their separation (Rommel et al. Reference Rommel, Blass and Meon1993), in drop manipulation in microfluidic systems (Deng et al. Reference Deng, Wang, Ju, Xie and Chu2016) and in printing applications (Fathi, Dickens & Fouchal Reference Fathi, Dickens and Fouchal2010). Further work is needed to understand the delayed coalescence. Previous studies by Sawaguchi et al. (Reference Sawaguchi, Matsuda, Hama, Saito and Tagawa2019) have shown that the circulation inside the drop is complex and three-dimensional, while the results shown here only describe the circulation in the laser plane. The flow and characteristics of the film were also only observed in a two-dimensional plane. Volumetric PIV approaches will elucidate the flows in the drop and in the film. In addition, it is still unclear how the film breaks into the ‘drops on a string’ configuration, and this merits further studies.

Figure 17. Geometric variables of drop on a deformed interface.
Acknowledgements
This project was funded by the UK Engineering and Physical Sciences Research Council (EPSRC) Programme Grant MEMPHIS. T.D. would also like to thank the Chinese Scholarship Council (CSC) for providing his studentship.
Declaration of interests
The authors report no conflict of interest.
Supplementary movies
Supplementary movies are available at https://doi.org/10.1017/jfm.2020.192.
Appendix A
The acceleration of the drop is attributed to the drag force from the surrounding liquid and the force from the interface on the bottom of the drop. As shown in figure 17, in the ‘inner’ region I, where the drop bottom is very close to the interface, the flow pattern is different from that in the ‘external’ region II. The drag forces on the drop surface will also be different in these two regions. The drag force on a sphere that is fully submerged in oil with a relative speed  $\unicode[STIX]{x0394}v$ is estimated by Nakayama (Reference Nakayama2018) as
 $$\begin{eqnarray}F_{oil}=C_{d}\frac{\unicode[STIX]{x03C0}D_{v}^{2}\unicode[STIX]{x1D70C}_{oil}(\unicode[STIX]{x0394}v)^{2}}{8},\end{eqnarray}$$
 where  $C_{d}$ is the drag coefficient,
  $D_{v}$ is the vertical diameter of the drop and
  $\unicode[STIX]{x0394}v$ is the velocity of the oil phase relative to the drop. From the numerical simulations (discussed in appendix B), the average velocity of the oil phase surrounding the drop was found to be approximately half of the interface velocity. The corresponding Reynolds number
  $Re=\unicode[STIX]{x1D70C}D\unicode[STIX]{x0394}v/\unicode[STIX]{x1D707}$ is almost 50 at the beginning of the impact period when the velocity difference between the drop and the interface is large. When the drops reach the speed of the surrounding liquids,
  $Re$ is reduced to approximately 0.02. According to Dijkhuizen et al. (Reference Dijkhuizen, Roghair, Annaland and Kuipers2010), the drag coefficient
  $C_{d}$ for drops can be calculated from (A 2), which is valid both in the Stokes region as well as at higher
  $Re$:
$Re$:
 $$\begin{eqnarray}C_{d}=\frac{16}{Re}\left(1+\frac{2}{\displaystyle 1+\frac{16}{Re}+\frac{3.315}{\sqrt{Re}}}\right).\end{eqnarray}$$
 Since only part of the drop is affected by the surrounding oil phase in the ‘external’ region II, a correction factor  $\unicode[STIX]{x1D6FD}={\textstyle \frac{2}{5}}(2+(D_{v}-b/D_{h}))$, which depends on the drop geometry, needs to be introduced to take this into account (Hale & Akers Reference Hale and Akers2016). As shown in figure 17, b is the minor axis of the bottom of the drop.

Figure 18. Variation of the total force  $F_{total}$ that the drops require for the acceleration, the estimated drag force
  $F_{drag}$ from the surrounding liquids and the tangential force
  $F_{film}$ from the film at the bottom of the drop.
In the ‘inner region’ I, the shear force on the drop bottom surface is expressed as  $\unicode[STIX]{x1D70F}=\unicode[STIX]{x1D707}(\unicode[STIX]{x2202}u/\unicode[STIX]{x2202}h)$, where
  $h$ is the film thickness, which is approximately 0.1 mm at the impact period. According to Sreenivas et al. (Reference Sreenivas, De and Arakeri1999), a linear variation of the velocity is considered across the film region. The tangential velocity along the bulk interface,
  $u_{b}$, is considered equal to the final velocity of the drop, which is found from figure 5. The velocity along the drop bottom surface is taken equal to zero, because no inner circulation in the drop was observed at this stage. The tangential shear force is thus estimated by integrating the shear stress along the bottom surface in region I.
The variations of the total force  $F_{total}$ required to accelerate the drop (which is calculated based on figure 5), the drag force from the surrounding liquid,
  $F_{drag}$, in region II and the shear force in the thin film,
  $F_{film}$, in region I at the initial stages are shown in figure 18. As can be seen, the shear force
  $F_{film}$ from the film in the inner region I contributes more than the drag force
  $F_{drag}$ from the surrounding oil most of the time. At the beginning (
 $t<15$ ms), the relative velocity between the drop and the surrounding liquid is large, while the film area is small and the drag force
  $F_{drag}$ is comparable to
  $F_{film}$. Afterwards, the drag force,
  $F_{drag}$, decreases as the relative velocity between the drop and the surrounding liquid diminishes rapidly, while the shear force,
  $F_{film}$, in the film is increasing as its length increases. After a transition point, the shear force
  $F_{film}$ decreases as the film region starts to shrink. Figure 18 reveals that the combined
  $F_{drag}$ and
  $F_{film}$ forces are less than the force required to accelerate the drop, especially at the initial stages of drop rest, before
  $t=30~\text{ms}$. It is believed that the Laplace force due to the deformation of the interface and the uneven distribution of the flow-induced lubrication pressure in the trapped oil film generate a horizontal force that also contributes to the acceleration of the drop.

Figure 19. Computational domain and details of the grid used around the drop and in the film region (total number of cells 1 28 053).
Appendix B. Estimation of the pressure (Pa) in the trapped film through simulation
The flow in the thin film trapped between the stationary drop and the bulk interface in § 5.1 is simulated with ANSYS Fluent 19.2. As described in § 5.1, the drop shape and the film thickness do not change during the whole process, which is regarded as steady state. The Reynolds number  $Re=\unicode[STIX]{x1D70C}uh/\unicode[STIX]{x1D707}$ in the thin trapped film is much lower than 1 (Sawaguchi et al. Reference Sawaguchi, Matsuda, Hama, Saito and Tagawa2019) and the lubrication theory can be applied. However, to get more accurate results, the inertial term is not ignored and in the simulation the full Navier–Stokes equations are considered. A two-dimensional simulation is carried out, where the steady-state shape of the drop and of the local film thickness are extracted from the experimental measurements by tracking the motion of the particles that are near the drop surface and the bulk interface. In the simulations it is assumed that the whole drop is surrounded by the oil phase and the nozzle is omitted. This is justified because at the level of the nozzle the oil velocity is close to zero and the effect of the nozzle on the flow field in the film region is expected to be negligible. As shown in figure 19, the drop is located at
  $50D$ away from both the inlet and the outlet to avoid end effects. A relatively coarse mesh was set in region A near the inlet and the outlet. A refined mesh was used in the drop region B, with a smooth transition to region A. The mesh in the film, whose thickness is approximately
  $50~\unicode[STIX]{x03BC}\text{m}$, is further refined to 80 nodes across the film height to improve the simulation accuracy. In the simulations, both the drop surface and the bulk interface are considered as solid walls with tangential velocities equal to those measured experimentally, as shown in figure 10(c). For the interface, a velocity of
  $2~\text{cm}~\text{s}^{-1}$ was used. The calculations were carried out at atmospheric pressure and the simulated pressure distribution in the film is shown in figure 20.

Figure 20. Contour of the pressure field in the trapped film and in the surrounding area.


