


1 Introduction
Gravity currents are thin fluid layers driven by the horizontal gradients in pressure arising from density differences with surrounding fluid. Such flows occur widely in both the natural world and industry. Important examples include the lateral migration of groundwater, hydrocarbons and carbon dioxide through porous rock (Bear Reference Bear1988). The analysis of gravity currents to date, both in porous media and elsewhere, have concentrated on situations where the density of the current is idealized as uniform, with a sharp interface separating it from either a uniform or density-stratified ambient. However, there are many situations in which a gravity current develops, or is introduced, with variations in its density composition. One example arises when a region of vigorously convecting fluid meets a horizontal surface and generates a gravity current along it. Another is through a process, such as dispersion in a porous medium, that mixes the boundary of the gravity current with surrounding ambient fluid. Processes of this kind are thought to play a key role in the geological storage of carbon dioxide (CO2) in underground aquifers (Orr Reference Orr2009). The analysis of variable-density gravity currents has received relatively little attention. Our aim in this paper is to elucidate the dynamical principles that apply to gravity currents of variable density, focusing here on those that propagate in porous media.
Our primary motivation stems from flows arising during geological carbon storage in underground aquifers. Once injected into an aquifer, CO2 gradually dissolves in the ambient water over times scales of decades to create a relatively dense gravity current of CO2-rich water along the base of the aquifer. Szulczewski, Hesse & Juanes (Reference Szulczewski, Hesse and Juanes2013) have recently considered the case of a gravity current produced from plumes of vertically convecting CO2, showing that the gravity current produced along the base of the aquifer is fed by a source of variable-density composition. As the flow adjusts into a stable stratification along the base, the gradients in concentration become significantly smaller than those generated during its vertical convection and further solutal diffusion may be rendered negligible. Parameter estimates indicate that diffusion may remain negligible for at least tens of thousands of years following the injection of CO2, during which time the dominant mode of transport is purely advective. Szulczewski et al. (Reference Szulczewski, Hesse and Juanes2013) developed depth-integrated models of longer-term regimes in which there is a simplification of the vertical density structure under diffusion. The regime of a purely advective density-stratified gravity current has received no significant attention.
In this paper, we address the dynamics of density-stratified gravity currents. When the density field is controlled purely by advection, the vertical structure of the density field is not known a priori and it is necessary to consider explicitly the two-dimensional transport of the density field. No simplified depth-integrated formulation is possible without a loss of closure. This contrasts with the long-term regimes considered by Szulczewski & Juanes (Reference Szulczewski and Juanes2013) and Szulczewski et al. (Reference Szulczewski, Hesse and Juanes2013), where diffusion structures the density field into a long-term linear stratification (cf. a thermal boundary layer, e.g. Daniels & Punpocha Reference Daniels and Punpocha2005). It also contrasts with variable-density flows controlled by a dominant gravity–capillary equilibrium (Golding et al. Reference Golding, Neufeld, Hesse and Huppert2011), where the overriding vertical structuring of the density field by the capillary fringe allows for a depth integration. Without any overriding physical control of the density structure, purely advective variable-density gravity currents have a fundamentally distinctive character. The main aims of this paper are to develop the theoretical, numerical and experimental tools necessary to investigate fluid mechanical regimes of this kind. It will be demonstrated that, while a depth-integrated formulation is generally unavailable, significant simplification of the full fluid mechanical equations does occur under the approximations of a stably stratified and thin fluid layer. A flow of the kind we analyse has, to our knowledge, been considered previously only briefly by Woods & Mason (Reference Woods and Mason2000), who calculated a solution describing the case of a finite release of linearly stratified fluid as an extension of their results relating to two-layer gravity currents. Here, we present a comprehensive study of continuously stratified currents, with an allowance for generalized density distributions and input conditions. We also present a focused laboratory study of a stratified gravity current formed from the lock release of a linearly stratified region into a uniform ambient fluid.
We begin in § 2 by developing general equations describing continuously and discretely stratified gravity currents. Similarity solutions to these equations are obtained first in the context of a finite release of mass in § 3 and second in the case of a continuous injection in § 4. In § 5, we present our laboratory study, along with comparisons between the data and our theoretical predictions. A discussion of the time scales on which advection-controlled gravity currents arise in situations where diffusivity is present is given in § 6.

Figure 1. Cross-section of a fluid-filled two-dimensional porous medium of depth
 $\mathscr{H}$
containing a horizontal impermeable boundary along
$\mathscr{H}$
containing a horizontal impermeable boundary along
 $z=0$
. The medium contains a stratified gravity current of variable density
$z=0$
. The medium contains a stratified gravity current of variable density
 ${\it\rho}(\boldsymbol{x},t)$
. Darker shading indicates denser fluid. The outline of the current
${\it\rho}(\boldsymbol{x},t)$
. Darker shading indicates denser fluid. The outline of the current
 $z=h(x,t)$
is shown as a solid curve. The medium is assumed to be much deeper than the current (
$z=h(x,t)$
is shown as a solid curve. The medium is assumed to be much deeper than the current (
 $h\ll \mathscr{H}$
).
$h\ll \mathscr{H}$
).
2 Theoretical development
Consider a two-dimensional porous medium of uniform permeability
 $k$
and porosity
$k$
and porosity
 ${\it\phi}$
saturated by fluid of constant viscosity
${\it\phi}$
saturated by fluid of constant viscosity
 ${\it\mu}$
but variable density
${\it\mu}$
but variable density
 ${\it\rho}(\boldsymbol{x},t)$
, where
${\it\rho}(\boldsymbol{x},t)$
, where
 $\boldsymbol{x}\equiv (x,z)$
, as illustrated in figure 1. We assume a constant reference pressure
$\boldsymbol{x}\equiv (x,z)$
, as illustrated in figure 1. We assume a constant reference pressure
 $p_{\infty }$
along the horizontal line
$p_{\infty }$
along the horizontal line
 $z=\mathscr{H}$
, equivalent to assuming that the medium is much deeper than the vertical scales of the flow. The fluid flow is modelled as incompressible and governed by Darcy’s law, with momentum and mass continuity equations given by
$z=\mathscr{H}$
, equivalent to assuming that the medium is much deeper than the vertical scales of the flow. The fluid flow is modelled as incompressible and governed by Darcy’s law, with momentum and mass continuity equations given by
 $$\begin{eqnarray}\displaystyle {\it\mu}{\it\phi}\boldsymbol{u}=k(-\boldsymbol{{\rm\nabla}}p-{\it\rho}g\hat{\boldsymbol{z}})\quad \text{and}\quad \boldsymbol{{\rm\nabla}}\boldsymbol{\cdot }\boldsymbol{u}=0, & & \displaystyle\end{eqnarray}$$
respectively, where
 $\boldsymbol{u}(\boldsymbol{x},t)\equiv (u,w)$
is the interstitial (pore) velocity,
$\boldsymbol{u}(\boldsymbol{x},t)\equiv (u,w)$
is the interstitial (pore) velocity,
 $p(\boldsymbol{x},t)$
is the fluid pressure and
$p(\boldsymbol{x},t)$
is the fluid pressure and
 $\boldsymbol{{\rm\nabla}}$
is the gradient operator (Bear Reference Bear1988). For incompressible fluids, density is materially conserved and is thus governed by the advection equation
$\boldsymbol{{\rm\nabla}}$
is the gradient operator (Bear Reference Bear1988). For incompressible fluids, density is materially conserved and is thus governed by the advection equation
 $$\begin{eqnarray}\frac{\text{D}{\it\rho}}{\text{D}t}\equiv \frac{\partial {\it\rho}}{\partial t}+\boldsymbol{u}\boldsymbol{\cdot }\boldsymbol{{\rm\nabla}}{\it\rho}=0.\end{eqnarray}$$
Thermal and solutal diffusivity are neglected. In writing (2.2), we also assume that there are no capillary forces acting between the fluids, which could otherwise control the density field through a capillary fringe (Golding et al.
Reference Golding, Neufeld, Hesse and Huppert2011). Under our assumption of a deep porous medium (
 $h\ll \mathscr{H}$
), the results of this paper are equally applicable to situations with a confining or free upper boundary (Hesse et al.
Reference Hesse, Tchelepi, Cantwell and Orr2007; Pegler, Huppert & Neufeld Reference Pegler, Huppert and Neufeld2014). It is also applicable to cases where a buoyant current flows along a free surface (as in our experiments presented in § 5).
$h\ll \mathscr{H}$
), the results of this paper are equally applicable to situations with a confining or free upper boundary (Hesse et al.
Reference Hesse, Tchelepi, Cantwell and Orr2007; Pegler, Huppert & Neufeld Reference Pegler, Huppert and Neufeld2014). It is also applicable to cases where a buoyant current flows along a free surface (as in our experiments presented in § 5).
The flow is assumed to be stably stratified,
 $\partial {\it\rho}/\partial z\leqslant 0$
, and with horizontal length scales much longer than the vertical. In common with gravity currents of uniform density, these assumptions imply, via a scaling analysis of (2.1), that the flow is predominantly horizontal (
$\partial {\it\rho}/\partial z\leqslant 0$
, and with horizontal length scales much longer than the vertical. In common with gravity currents of uniform density, these assumptions imply, via a scaling analysis of (2.1), that the flow is predominantly horizontal (
 $w\ll u$
) (the Dupuit approximation; see Bear Reference Bear1988). An implication of the relative sizes of the velocity components is that the viscous stresses due to vertical flow
$w\ll u$
) (the Dupuit approximation; see Bear Reference Bear1988). An implication of the relative sizes of the velocity components is that the viscous stresses due to vertical flow
 $w$
can be neglected in the vertical component of the force-balance equation (2.1a
). This neglect yields a purely hydrostatic pressure field
$w$
can be neglected in the vertical component of the force-balance equation (2.1a
). This neglect yields a purely hydrostatic pressure field
 $p(\boldsymbol{x},t)$
described by
$p(\boldsymbol{x},t)$
described by
 $$\begin{eqnarray}\displaystyle 0=-\frac{\partial p}{\partial z}-{\it\rho}(\boldsymbol{x},t)g\quad \text{or}\quad p=p_{\infty }+g\int _{z}^{\mathscr{H}}{\it\rho}(x,\tilde{z},t)\;\text{d}\tilde{z} & & \displaystyle\end{eqnarray}$$
on integration subject to the reference pressure
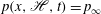 $p(x,\mathscr{H},t)=p_{\infty }$
.
$p(x,\mathscr{H},t)=p_{\infty }$
.
The outline, or height profile, of the current
 $z=h(x,t)$
is defined so that the density has the ambient value (
$z=h(x,t)$
is defined so that the density has the ambient value (
 ${\it\rho}={\it\rho}_{a}$
) for
${\it\rho}={\it\rho}_{a}$
) for
 $z>h(x,t)$
but is heavier (
$z>h(x,t)$
but is heavier (
 ${\it\rho}_{a}\leqslant {\it\rho}\leqslant {\it\rho}_{0}$
) in the interior
${\it\rho}_{a}\leqslant {\it\rho}\leqslant {\it\rho}_{0}$
) in the interior
 $0\leqslant z\leqslant h(x,t)$
, where
$0\leqslant z\leqslant h(x,t)$
, where
 ${\it\rho}_{0}$
is the maximum density. For convenience, we describe the density field
${\it\rho}_{0}$
is the maximum density. For convenience, we describe the density field
 ${\it\rho}(\boldsymbol{x},t)$
using the normalized relative density
${\it\rho}(\boldsymbol{x},t)$
using the normalized relative density
 $c(\boldsymbol{x},t)\equiv [{\it\rho}(\boldsymbol{x},t)-{\it\rho}_{a}]/{\rm\Delta}{\it\rho}$
, where
$c(\boldsymbol{x},t)\equiv [{\it\rho}(\boldsymbol{x},t)-{\it\rho}_{a}]/{\rm\Delta}{\it\rho}$
, where
 ${\rm\Delta}{\it\rho}\equiv {\it\rho}_{0}-{\it\rho}_{a}$
. The value
${\rm\Delta}{\it\rho}\equiv {\it\rho}_{0}-{\it\rho}_{a}$
. The value
 $c=0$
represents the ambient density and
$c=0$
represents the ambient density and
 $c=1$
the maximum density present in the flow. In terms of
$c=1$
the maximum density present in the flow. In terms of
 $c$
, (2.3b
) becomes
$c$
, (2.3b
) becomes
 $$\begin{eqnarray}p=p_{\infty }-{\it\rho}_{a}g(z-\mathscr{H})+{\rm\Delta}{\it\rho}g\int _{z}^{h(x,t)}c(x,\tilde{z},t)\;\text{d}\tilde{z}.\end{eqnarray}$$
Substitution of (2.4) into the horizontal component of (2.1a ) yields the horizontal velocity
 $$\begin{eqnarray}\displaystyle u=-\frac{k}{{\it\phi}{\it\mu}}\frac{\partial p}{\partial x}=-U\frac{\partial C}{\partial x},\quad \text{where }C(\boldsymbol{x},t)\equiv \int _{z}^{h(x,t)}c(x,\tilde{z},t)\;\text{d}\tilde{z} & & \displaystyle\end{eqnarray}$$
represents the vertically integrated dimensionless density (or weight per unit horizontal area) of fluid above the point
 $\boldsymbol{x}$
and
$\boldsymbol{x}$
and
 $U\equiv {\rm\Delta}{\it\rho}gk/{\it\phi}{\it\mu}$
is the speed associated with gravity-driven vertical flow of fluid with density
$U\equiv {\rm\Delta}{\it\rho}gk/{\it\phi}{\it\mu}$
is the speed associated with gravity-driven vertical flow of fluid with density
 ${\it\rho}_{0}$
. Equations (2.5a,b
) show that the horizontal velocity of a fluid element
${\it\rho}_{0}$
. Equations (2.5a,b
) show that the horizontal velocity of a fluid element
 $u$
is driven by the horizontal gradient in the weight of fluid columns above it. In order to see how contributions to this gradient in weight arise, we differentiate the integral in (2.5) to yield
$u$
is driven by the horizontal gradient in the weight of fluid columns above it. In order to see how contributions to this gradient in weight arise, we differentiate the integral in (2.5) to yield
 $$\begin{eqnarray}u=-U\left[c(x,h,t)\frac{\partial h}{\partial x}+\int _{z}^{h(x,t)}\frac{\partial c}{\partial x}(x,\tilde{z},t)\;\text{d}\tilde{z}\right],\end{eqnarray}$$
which shows that the flow is driven both by the peripheral gradient in weight arising from the interfacial slope
 $\partial h/\partial x$
and by the internal gradient in weight arising from the integrated horizontal gradient of the density
$\partial h/\partial x$
and by the internal gradient in weight arising from the integrated horizontal gradient of the density
 $\partial c/\partial x$
interior to the current. The latter is identically zero for a uniform-density gravity current (
$\partial c/\partial x$
interior to the current. The latter is identically zero for a uniform-density gravity current (
 $c\equiv 1$
for
$c\equiv 1$
for
 $z<h$
), in which case (2.6) recovers the familiar linear relationship between the horizontal velocity and the gradient in height,
$z<h$
), in which case (2.6) recovers the familiar linear relationship between the horizontal velocity and the gradient in height,
 $u=-U\partial h/\partial x$
(e.g. Barenblatt Reference Barenblatt1952; Bear Reference Bear1988). The potential to drive flow via density gradients internal to the current is a new feature of variable-density flow.
$u=-U\partial h/\partial x$
(e.g. Barenblatt Reference Barenblatt1952; Bear Reference Bear1988). The potential to drive flow via density gradients internal to the current is a new feature of variable-density flow.
By differentiating (2.6) with respect to
 $z$
, we obtain the further result
$z$
, we obtain the further result
 $$\begin{eqnarray}\frac{\partial u}{\partial z}=U\frac{\partial c}{\partial x},\end{eqnarray}$$
which shows that vertical variations in horizontal velocity are in direct proportion to horizontal variations in density. As a consequence, vertical variations in horizontal velocity only arise when horizontal variations in density are present in the flow. This is consistent with studies that assume a uniform density, where it is found that the horizontal velocity does not vary through the height of the current. In physical terms, (2.7) implies that horizontal gradients in pressure increase with depth only if density decreases in the direction of the flow,
 $\partial c/\partial x<0$
.
$\partial c/\partial x<0$
.
Integrating (2.1b
) with respect to
 $z$
subject to the no-penetration condition
$z$
subject to the no-penetration condition
 $w(x,0,t)=0$
and using (2.5) to evaluate
$w(x,0,t)=0$
and using (2.5) to evaluate
 $u$
, we determine the vertical velocity of the flow as
$u$
, we determine the vertical velocity of the flow as
 $$\begin{eqnarray}\displaystyle w=-\int _{0}^{z}\frac{\partial u}{\partial x}\;\text{d}z=U\frac{\partial ^{2}D}{\partial x^{2}},\quad \text{where }D(\boldsymbol{x},t)\equiv \int _{0}^{z}C(x,\tilde{z},t)\;\text{d}\tilde{z}. & & \displaystyle\end{eqnarray}$$
Note the different physical controls by which the two velocity components
 $u$
and
$u$
and
 $w$
are determined compared to the unsimplified equations (2.1). As a generic property of models that assume a hydrostatic pressure field, the horizontal velocity
$w$
are determined compared to the unsimplified equations (2.1). As a generic property of models that assume a hydrostatic pressure field, the horizontal velocity
 $u$
is controlled independently by the gravity–viscous balance (2.5a
). Given this
$u$
is controlled independently by the gravity–viscous balance (2.5a
). Given this
 $u$
, the vertical velocity
$u$
, the vertical velocity
 $w$
simply takes the values it must in order to satisfy the condition of incompressibility (2.1b
). This sequential determination does not apply to the governing equations (2.1), where horizontal and vertical velocity are determined on equal footing via an elliptic boundary-value problem.
$w$
simply takes the values it must in order to satisfy the condition of incompressibility (2.1b
). This sequential determination does not apply to the governing equations (2.1), where horizontal and vertical velocity are determined on equal footing via an elliptic boundary-value problem.
The dimensionless relative density
 $c(\boldsymbol{x},t)$
is the dependent variable describing the state of the system. Substituting (2.5a
) and (2.8a
) into (2.2), we obtain the equation governing the evolution of the density field,
$c(\boldsymbol{x},t)$
is the dependent variable describing the state of the system. Substituting (2.5a
) and (2.8a
) into (2.2), we obtain the equation governing the evolution of the density field,
 $$\begin{eqnarray}\frac{\partial c}{\partial t}+U\left[-\frac{\partial C}{\partial x}\frac{\partial c}{\partial x}+\frac{\partial ^{2}D}{\partial x^{2}}\frac{\partial c}{\partial z}\right]=0,\end{eqnarray}$$
where
 $C(\boldsymbol{x},t)$
and
$C(\boldsymbol{x},t)$
and
 $D(\boldsymbol{x},t)$
are related to vertical (columnar) integrals of
$D(\boldsymbol{x},t)$
are related to vertical (columnar) integrals of
 $c(\boldsymbol{x},t)$
via (2.5b
) and (2.8b
). Equation (2.9) is simpler than the original coupled system of elliptic–transport equations (2.1) and (2.2), where determination of velocity depends on a two-dimensional integration of the elliptic system (2.1a,b
) over the full domain. The important physical property highlighted by (2.9) is that the dynamics of thin stratified gravity currents depend only locally on vertical columns of the density field.
$c(\boldsymbol{x},t)$
via (2.5b
) and (2.8b
). Equation (2.9) is simpler than the original coupled system of elliptic–transport equations (2.1) and (2.2), where determination of velocity depends on a two-dimensional integration of the elliptic system (2.1a,b
) over the full domain. The important physical property highlighted by (2.9) is that the dynamics of thin stratified gravity currents depend only locally on vertical columns of the density field.
While (2.9) represents a simplification of the dynamics, it cannot be simplified further by depth integration without a general loss of closure. To confirm this, we note that the depth-integrated form of (2.9) is given by
 $$\begin{eqnarray}\frac{\partial h}{\partial t}+u(x,h,t)\frac{\partial h}{\partial x}=w(z,h,t),\end{eqnarray}$$
which can be recognized as the standard evolution equation for a material fluid interface
 $z=h(x,t)$
(see appendix A for the derivation of (2.10) from (2.9)). With a uniform density (
$z=h(x,t)$
(see appendix A for the derivation of (2.10) from (2.9)). With a uniform density (
 $c\equiv 1$
), (2.5) and (2.8) yield
$c\equiv 1$
), (2.5) and (2.8) yield
 $$\begin{eqnarray}\displaystyle u=-U\frac{\partial h}{\partial x}\quad \text{and}\quad w=Uz\frac{\partial ^{2}h}{\partial x^{2}}\quad (c\equiv 1), & & \displaystyle\end{eqnarray}$$
and (2.10) recovers the familiar one-dimensional nonlinear diffusion equation describing the evolution of a uniform-density gravity current. Modified expressions for the velocity field as a direct function of
 $h(x,t)$
could also be developed in situations where the density field
$h(x,t)$
could also be developed in situations where the density field
 $c(x,t)$
is at all times related directly to height
$c(x,t)$
is at all times related directly to height
 $h$
by the control of a dominant gravity–capillary equilibrium (Golding et al.
Reference Golding, Neufeld, Hesse and Huppert2011). Without any overriding physical control of the density field of this kind, no general expressions are available to substitute for
$h$
by the control of a dominant gravity–capillary equilibrium (Golding et al.
Reference Golding, Neufeld, Hesse and Huppert2011). Without any overriding physical control of the density field of this kind, no general expressions are available to substitute for
 $u$
and
$u$
and
 $w$
in terms of just
$w$
in terms of just
 $h$
in (2.10) and there is therefore a loss of closure associated with the depth integration of (2.9). The failure of depth integration represents a fundamental departure from models of uniform-density gravity currents, as well as situations where simplified structuring of the density field occurs under diffusion (Szulczewski & Juanes Reference Szulczewski and Juanes2013). Variations in density controlled by advection alone thus introduce the need to explicitly consider the full, two-dimensional transport of the density field.
$h$
in (2.10) and there is therefore a loss of closure associated with the depth integration of (2.9). The failure of depth integration represents a fundamental departure from models of uniform-density gravity currents, as well as situations where simplified structuring of the density field occurs under diffusion (Szulczewski & Juanes Reference Szulczewski and Juanes2013). Variations in density controlled by advection alone thus introduce the need to explicitly consider the full, two-dimensional transport of the density field.
2.1 Velocity conditions
Equation (2.9) describes the evolution of the density field subject to suitable boundary conditions. In the canonical problems of a finite-volume release and of a constant-flux input considered later in this paper, the relevant boundary conditions are of either no penetration or of an imposed horizontal velocity, respectively. Both of these situations can be represented by
 $$\begin{eqnarray}u(0,z,t)=u_{0}(z,t),\end{eqnarray}$$
where
 $u_{0}(z,t)$
is a spatially and temporally dependent function representing the velocity prescribed at a height
$u_{0}(z,t)$
is a spatially and temporally dependent function representing the velocity prescribed at a height
 $z$
along the vertical line
$z$
along the vertical line
 $x=0$
. The case of no penetration is given by
$x=0$
. The case of no penetration is given by
 $u_{0}\equiv 0$
, while the case of a continuous input involves a non-zero specification of the horizontal velocity
$u_{0}\equiv 0$
, while the case of a continuous input involves a non-zero specification of the horizontal velocity
 $u_{0}(z,t)$
, to be detailed at the beginning of § 4. Note that, because the vertical velocity
$u_{0}(z,t)$
, to be detailed at the beginning of § 4. Note that, because the vertical velocity
 $w$
is fully specified for a given horizontal velocity field
$w$
is fully specified for a given horizontal velocity field
 $u$
via (2.8), it is not possible to independently specify the vertical velocity
$u$
via (2.8), it is not possible to independently specify the vertical velocity
 $w$
in addition to (2.12). By differentiating (2.12) with respect to
$w$
in addition to (2.12). By differentiating (2.12) with respect to
 $z$
and using (2.7), we obtain
$z$
and using (2.7), we obtain
 $$\begin{eqnarray}\frac{\partial u}{\partial z}=U\frac{\partial c}{\partial x}=\frac{\partial u_{0}}{\partial z}(z,t)\quad \text{on }x=0,\end{eqnarray}$$
which yields a boundary condition on the gradient of the density field
 $c$
. Condition (2.13) is physically analogous to the condition on the interfacial gradient
$c$
. Condition (2.13) is physically analogous to the condition on the interfacial gradient
 $\partial h/\partial x$
imposed in studies of uniform-density gravity currents, which likewise specifies the horizontal gradient in weight of vertical fluid columns along
$\partial h/\partial x$
imposed in studies of uniform-density gravity currents, which likewise specifies the horizontal gradient in weight of vertical fluid columns along
 $x=0$
needed to generate the imposed velocity
$x=0$
needed to generate the imposed velocity
 $u_{0}$
. Equation (2.9) along with (2.13) and a suitable initial condition on
$u_{0}$
. Equation (2.9) along with (2.13) and a suitable initial condition on
 $c(x,0)$
, form a closed system. In our later analysis of similarity solutions, we will not impose (2.13) directly, favouring instead the alternative specification of global constraints on fluid volumes (see § 2.2). However, the condition on
$c(x,0)$
, form a closed system. In our later analysis of similarity solutions, we will not impose (2.13) directly, favouring instead the alternative specification of global constraints on fluid volumes (see § 2.2). However, the condition on
 $\partial c/\partial x$
implied by (2.13) will be confirmed to arise in our mathematical solutions and laboratory experiments.
$\partial c/\partial x$
implied by (2.13) will be confirmed to arise in our mathematical solutions and laboratory experiments.
In the case of a no-penetration boundary condition,
 $u_{0}\equiv 0$
, (2.13) reduces to
$u_{0}\equiv 0$
, (2.13) reduces to
 $$\begin{eqnarray}\frac{\partial c}{\partial x}(0,z,t)=0.\end{eqnarray}$$
The horizontal gradient of the density is therefore identically zero along
 $x=0$
. In physical terms, (2.14) implies that there are no internal variations in the horizontal gradient of the weight of fluid columns from which vertical variations in horizontal velocity along
$x=0$
. In physical terms, (2.14) implies that there are no internal variations in the horizontal gradient of the weight of fluid columns from which vertical variations in horizontal velocity along
 $x=0$
could arise. By combining (2.14) with (2.6) and
$x=0$
could arise. By combining (2.14) with (2.6) and
 $u=0$
, we obtain the further condition,
$u=0$
, we obtain the further condition,
 $$\begin{eqnarray}\lim _{x\rightarrow 0}\left[c(x,h,t)\frac{\partial h}{\partial x}\right]=0,\end{eqnarray}$$
which implies that at least one of the interfacial density
 $c(x,h,t)$
or interfacial gradient
$c(x,h,t)$
or interfacial gradient
 $\partial h/\partial x$
vanishes at
$\partial h/\partial x$
vanishes at
 $x=0$
. With uniform density,
$x=0$
. With uniform density,
 $c\equiv 1$
, (2.15) can only imply the latter. In the situations considered in this paper, the density
$c\equiv 1$
, (2.15) can only imply the latter. In the situations considered in this paper, the density
 $c$
will generally vanish at the top corner of the current,
$c$
will generally vanish at the top corner of the current,
 $c(0,h,t)=0$
and (2.15) is automatically satisfied. An implication is that there is then no constraint on the interfacial gradient
$c(0,h,t)=0$
and (2.15) is automatically satisfied. An implication is that there is then no constraint on the interfacial gradient
 $\partial h/\partial x(0,t)$
, contrasting with uniform-density gravity currents. Indeed, our analysis will show that it can be infinite.
$\partial h/\partial x(0,t)$
, contrasting with uniform-density gravity currents. Indeed, our analysis will show that it can be infinite.

Figure 2. A schematic illustrating the interpretation of the cumulative volume–density function
 $V(\tilde{c})$
defined by (3.7) as the volume of the current above the isopycnal
$V(\tilde{c})$
defined by (3.7) as the volume of the current above the isopycnal
 $\tilde{c}=c(\boldsymbol{x},t)$
. Darker shading indicates denser fluid.
$\tilde{c}=c(\boldsymbol{x},t)$
. Darker shading indicates denser fluid.
2.2 The density distribution
Previous studies of uniform-density gravity currents have typically focused on the calculation of similarity solutions. In these studies, it is usual to specify a constraint on the total volume of the current (e.g. Barenblatt Reference Barenblatt1952; Huppert & Woods Reference Huppert and Woods1995). For a gravity current containing a continuous spectrum of densities, a single volume constraint of this kind is insufficient. Instead, it is necessary to prescribe the volume of each fluid density, or volume per unit density. In effect, this requires an infinite number of constraints. In order to apply constraints of this generalized form, we introduce the cumulative volume–density function
 $V(c)$
defined as the volume of fluid per unit width that contains densities of value
$V(c)$
defined as the volume of fluid per unit width that contains densities of value
 $c$
or less. Formally,
$c$
or less. Formally,
 $$\begin{eqnarray}V(\tilde{c})\equiv {\it\phi}\int _{0}^{x_{N}(t)}\int _{0}^{h(x,t)}{\it\Theta}\left[c(\boldsymbol{x},t)-\tilde{c}\right]\;\text{d}z\;\text{d}x,\end{eqnarray}$$
where
 ${\it\Theta}$
is the unit step function. Under our assumption of a stable stratification (
${\it\Theta}$
is the unit step function. Under our assumption of a stable stratification (
 $\partial c/\partial z<0$
), the function
$\partial c/\partial z<0$
), the function
 $V(\tilde{c})$
can be interpreted as the volume of the current lying above the isopycnal
$V(\tilde{c})$
can be interpreted as the volume of the current lying above the isopycnal
 $c(\boldsymbol{x},t)=\tilde{c}$
, as illustrated in figure 2. In the absence of any input of fluid,
$c(\boldsymbol{x},t)=\tilde{c}$
, as illustrated in figure 2. In the absence of any input of fluid,
 $V(c)$
is a conserved quantity because material fluid volumes are conserved in incompressible flow (Acheson Reference Acheson1990). Depending on how
$V(c)$
is a conserved quantity because material fluid volumes are conserved in incompressible flow (Acheson Reference Acheson1990). Depending on how
 $V(c)$
is specified, a range of different density distributions are possible, from those where density
$V(c)$
is specified, a range of different density distributions are possible, from those where density
 $c$
is concentrated primarily towards a single value to those where density is distributed more evenly over a wide range (illustrative examples will be shown later in figure 5).
$c$
is concentrated primarily towards a single value to those where density is distributed more evenly over a wide range (illustrative examples will be shown later in figure 5).
As an alternative to
 $V(c)$
, we also define the cumulative mass–density function
$V(c)$
, we also define the cumulative mass–density function
 $$\begin{eqnarray}M(\tilde{c})\equiv {\it\phi}\int _{0}^{x_{N}(t)}\int _{0}^{h(x,t)}{\it\Theta}\left[c(\boldsymbol{x},t)-\tilde{c}\right]{\rm\Delta}{\it\rho}c(\boldsymbol{x},t)\;\text{d}z\;\text{d}x,\end{eqnarray}$$
representing the relative mass (the mass minus the mass of ambient fluid displaced) of relative density
 $c$
or less. This is equivalent to (2.16) but with the relative density
$c$
or less. This is equivalent to (2.16) but with the relative density
 ${\rm\Delta}{\it\rho}c(\boldsymbol{x},t)$
included in the integrand. The functions
${\rm\Delta}{\it\rho}c(\boldsymbol{x},t)$
included in the integrand. The functions
 $M(c)$
and
$M(c)$
and
 $V(c)$
can be related by noting that the volume
$V(c)$
can be related by noting that the volume
 ${\it\delta}V$
and mass
${\it\delta}V$
and mass
 ${\it\delta}M$
of the fluid strip containing densities between
${\it\delta}M$
of the fluid strip containing densities between
 $c$
and
$c$
and
 $c+{\it\delta}c$
can be expressed as
$c+{\it\delta}c$
can be expressed as
 $$\begin{eqnarray}\displaystyle & \displaystyle {\it\delta}V=V(c+{\it\delta}c)-V(c)=V^{\prime }(c){\it\delta}c+O({\it\delta}c^{2}), & \displaystyle\end{eqnarray}$$
 $$\begin{eqnarray}\displaystyle & \displaystyle {\it\delta}M=({\rm\Delta}{\it\rho}c){\it\delta}V+O({\it\delta}c{\it\delta}V), & \displaystyle\end{eqnarray}$$
respectively, where the prime in (2.18) denotes differentiation with respect to the argument. Using (2.18) to evaluate
 ${\it\delta}V$
in (2.19) and taking the limit
${\it\delta}V$
in (2.19) and taking the limit
 ${\it\delta}c\rightarrow 0$
, we determine that
${\it\delta}c\rightarrow 0$
, we determine that
 $M^{\prime }(c)={\rm\Delta}{\it\rho}cV^{\prime }(c)$
. The functions
$M^{\prime }(c)={\rm\Delta}{\it\rho}cV^{\prime }(c)$
. The functions
 $M(c)$
and
$M(c)$
and
 $V(c)$
are therefore related via
$V(c)$
are therefore related via
 $$\begin{eqnarray}\displaystyle M(c)={\rm\Delta}{\it\rho}\int _{0}^{c}\tilde{c}V^{\prime }(\tilde{c})\;\text{d}\tilde{c}\quad \text{and}\quad V(c)=\frac{1}{{\rm\Delta}{\it\rho}}\int _{0}^{c}\frac{M^{\prime }(\tilde{c})}{\tilde{c}}\;\text{d}\tilde{c}. & & \displaystyle\end{eqnarray}$$
The advantage of
 $M(c)$
over
$M(c)$
over
 $V(c)$
is that it is more natural to keep the total mass of the current
$V(c)$
is that it is more natural to keep the total mass of the current
 $M(1)$
fixed in comparing the results of different density distributions. The advantage of specifying
$M(1)$
fixed in comparing the results of different density distributions. The advantage of specifying
 $V(c)$
is that it is more readily imposed mathematically.
$V(c)$
is that it is more readily imposed mathematically.

Figure 3. A schematic of a lock gate prior to release. (a) Illustrates how the distribution function
 $V[c_{0}(\tilde{z})]$
represents the volume above the line
$V[c_{0}(\tilde{z})]$
represents the volume above the line
 $z=\tilde{z}$
for a given stably stratified density profile
$z=\tilde{z}$
for a given stably stratified density profile
 $c_{0}(z)$
behind the lock gate. Darker shading indicates denser fluid. (b) Shows an example plot of the initial density stratification
$c_{0}(z)$
behind the lock gate. Darker shading indicates denser fluid. (b) Shows an example plot of the initial density stratification
 $c_{0}(z)$
and the interpretations of the distribution functions
$c_{0}(z)$
and the interpretations of the distribution functions
 $V(c_{0})$
being proportional to
$V(c_{0})$
being proportional to
 $(h_{0}-\tilde{z})$
and
$(h_{0}-\tilde{z})$
and
 $M(c_{0})$
being proportional to the area to the left of the curve
$M(c_{0})$
being proportional to the area to the left of the curve
 $c_{0}(z)$
, each defined by (2.21a,b
).
$c_{0}(z)$
, each defined by (2.21a,b
).

Figure 4. Schematic of a gravity current composed of a discrete density distribution. An example with five layers (
 $N=5$
) is shown.
$N=5$
) is shown.
In the context of a finite release of fluid, it is necessary to specify an initial condition on the density field. Physically, a flow of this kind can be initialized by release of a lock gate, as illustrated in figure 3(a) (and experimentally in § 5). Let
 $c_{0}(z)$
denote the vertical density field of a stratified fluid layer lying stationary behind a lock. The mass and volume distribution functions
$c_{0}(z)$
denote the vertical density field of a stratified fluid layer lying stationary behind a lock. The mass and volume distribution functions
 $V(c)$
and
$V(c)$
and
 $M(c)$
in this situation can be constructed from the initial stratification
$M(c)$
in this situation can be constructed from the initial stratification
 $c_{0}(z)$
according to
$c_{0}(z)$
according to
 $$\begin{eqnarray}\displaystyle V[c_{0}(z)]=l(h_{0}-z)\quad \text{and}\quad M[c_{0}(z)]=l{\rm\Delta}{\it\rho}\int _{z}^{h_{0}}c_{0}(\tilde{z})\;\text{d}\tilde{z}, & & \displaystyle\end{eqnarray}$$
where
 $l$
is the length of the lock and
$l$
is the length of the lock and
 $h_{0}$
is the height of the fluid layer (see figure 3(b)). Once the lock is released, the density field
$h_{0}$
is the height of the fluid layer (see figure 3(b)). Once the lock is released, the density field
 $c(\boldsymbol{x},t)$
will evolve from
$c(\boldsymbol{x},t)$
will evolve from
 $c_{0}(z)$
in accord with (2.9). However, the density distribution
$c_{0}(z)$
in accord with (2.9). However, the density distribution
 $V(c)$
remains conserved and therefore retains information associated with the initial stratification for all time. In our later analysis of similarity solutions, the similarity solutions themselves will not depend on any of the details of how fluid is introduced other than
$V(c)$
remains conserved and therefore retains information associated with the initial stratification for all time. In our later analysis of similarity solutions, the similarity solutions themselves will not depend on any of the details of how fluid is introduced other than
 $V(c)$
.
$V(c)$
.
2.3 Discrete distributions
A different mathematical formulation arises in situations where the density field occupies a series of
 $N$
discrete, piecewise-uniform layers. Such cases are prescribed by
$N$
discrete, piecewise-uniform layers. Such cases are prescribed by
 $$\begin{eqnarray}{\it\rho}={\it\rho}_{i}\quad \text{in}~h_{i-1}(x,t)<z<h_{i}(x,t),~i=1,2,\ldots N,\end{eqnarray}$$
where
 ${\it\rho}_{i}$
is the density of the
${\it\rho}_{i}$
is the density of the
 $i$
th isopycnal layer and
$i$
th isopycnal layer and
 $h_{i}(x,t)$
is the height of its upper surface (with
$h_{i}(x,t)$
is the height of its upper surface (with
 $i=1$
denoting the highest layer and
$i=1$
denoting the highest layer and
 $i=N$
the lowest; see figure 4). This would arise physically when a gravity current of two or more fluid species interact without significant mixing (considered in the case of two layers,
$i=N$
the lowest; see figure 4). This would arise physically when a gravity current of two or more fluid species interact without significant mixing (considered in the case of two layers,
 $N=2$
, by Woods & Mason (Reference Woods and Mason2000)). Our primary motivation for considering this case is that it provides a set of model equations different to (2.9), but with solutions that are asymptotically equivalent in the limit of small density steps but nevertheless lend themselves more conveniently to numerical solution.
$N=2$
, by Woods & Mason (Reference Woods and Mason2000)). Our primary motivation for considering this case is that it provides a set of model equations different to (2.9), but with solutions that are asymptotically equivalent in the limit of small density steps but nevertheless lend themselves more conveniently to numerical solution.
Substitution of (2.22) into the horizontal component of (2.1a
) determines the pressure field of the
 $i$
th layer as
$i$
th layer as
 $$\begin{eqnarray}p_{i}(\boldsymbol{x},t)=p_{\infty }-{\it\rho}_{a}g(z-\mathscr{H})+g\left[(z-h_{i}){\it\rho}_{i}+\mathop{\sum }_{k=1}^{i-1}H_{k}{\it\rho}_{k}\right].\end{eqnarray}$$
Using (2.23) to evaluate the pressure
 $p$
in the horizontal component of the Darcy equation (2.1a
), we determine the horizontal velocity of the
$p$
in the horizontal component of the Darcy equation (2.1a
), we determine the horizontal velocity of the
 $i$
th layer as
$i$
th layer as
 $$\begin{eqnarray}\displaystyle u_{i}(x,t) & = & \displaystyle -\frac{k}{{\it\phi}{\it\mu}}\frac{\partial p_{i}}{\partial x}=\frac{gk}{{\it\phi}{\it\mu}}\left[-{\it\rho}_{i}\frac{\partial h_{i}}{\partial x}+\mathop{\sum }_{k=1}^{i-1}{\it\rho}_{k}\frac{\partial H_{k}}{\partial x}\right]\end{eqnarray}$$
 $$\begin{eqnarray}\displaystyle & \equiv & \displaystyle -U\mathop{\sum }_{k=1}^{N}c_{ik}\frac{\partial H_{k}}{\partial x},\quad \text{where }c_{ik}\equiv \left\{\begin{array}{@{}ll@{}}c_{i} & \text{if }i\leqslant k,\\ c_{k} & \text{if }i>k,\end{array}\right.\end{eqnarray}$$
 $H_{i}(x,t)\equiv h_{i}-h_{i-1}$
is the thickness of the
$H_{i}(x,t)\equiv h_{i}-h_{i-1}$
is the thickness of the
 $i$
th layer. The more compact expression (2.24b
) follows from (2.24a
) on substitution of
$i$
th layer. The more compact expression (2.24b
) follows from (2.24a
) on substitution of
 $h_{i}=\sum _{k=i}^{N}H_{k}$
. Equation (2.24a
) shows that the flow rate
$h_{i}=\sum _{k=i}^{N}H_{k}$
. Equation (2.24a
) shows that the flow rate
 $u_{i}$
of the
$u_{i}$
of the
 $i$
th layer is driven by both the pressure gradient arising from variations in the thickness of higher layers, represented by the second term, and by the gradient of its own upper interface
$i$
th layer is driven by both the pressure gradient arising from variations in the thickness of higher layers, represented by the second term, and by the gradient of its own upper interface
 $h_{i}$
, represented by the first. Uniform-density gravity currents are driven solely by the former (see (2.11a
)) since there is no other way to generate a horizontal gradient in hydrostatic pressure in that case. Here, internal variations in density above a point also perturb the hydrostatic pressure, and therefore introduce a dependence of
$h_{i}$
, represented by the first. Uniform-density gravity currents are driven solely by the former (see (2.11a
)) since there is no other way to generate a horizontal gradient in hydrostatic pressure in that case. Here, internal variations in density above a point also perturb the hydrostatic pressure, and therefore introduce a dependence of
 $u_{i}$
on the density fields of higher layers. This is consistent with the result (2.5) that the horizontal flow rate at a point is proportional to the gradient in the weight of fluid columns above it. Note that (2.24) implies that
$u_{i}$
on the density fields of higher layers. This is consistent with the result (2.5) that the horizontal flow rate at a point is proportional to the gradient in the weight of fluid columns above it. Note that (2.24) implies that
 $u_{i}$
is independent of
$u_{i}$
is independent of
 $z$
in the interior of each isopycnal layer,
$z$
in the interior of each isopycnal layer,
 $h_{i-1}<z<h_{i}$
.
$h_{i-1}<z<h_{i}$
.
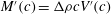
Integrating the mass continuity equation (2.1b ) vertically over each layer, we obtain the set of depth-integrated continuity equations
 $$\begin{eqnarray}\displaystyle \frac{\partial H_{i}}{\partial t}+\frac{\partial q_{i}}{\partial x}=0,\quad \text{where }q_{i}(x,t)\equiv \int _{h_{i-1}}^{h_{i}}u_{i}\;\text{d}z=H_{i}u_{i}. & & \displaystyle\end{eqnarray}$$
is the horizontal fluid flux per unit width of layer
 $i$
, and we have used the fact that the flow is independent of the vertical coordinate
$i$
, and we have used the fact that the flow is independent of the vertical coordinate
 $z$
in the interior of each layer,
$z$
in the interior of each layer,
 $\partial u_{i}/\partial z=0$
, as implied by (2.24). Combining (2.24b
) and (2.25a,b
), we obtain
$\partial u_{i}/\partial z=0$
, as implied by (2.24). Combining (2.24b
) and (2.25a,b
), we obtain
 $$\begin{eqnarray}\frac{\partial H_{i}}{\partial t}=U\frac{\partial }{\partial x}\left[H_{i}\mathop{\sum }_{k=1}^{N}c_{ik}\frac{\partial H_{k}}{\partial x}\right],\end{eqnarray}$$
which represents a system of
 $N$
coupled nonlinear diffusion equations describing the evolutions of the thickness profiles
$N$
coupled nonlinear diffusion equations describing the evolutions of the thickness profiles
 $H_{i}$
. The mathematical character of (2.26) is parabolic. This may appear to contrast with the integro–hyperbolic character of (2.9) but is not inconsistent; it reflects the fact that a nonlinear diffusion equation can arise as a special case of a transport equation in which the coefficients are functions of the dependent variable. In the limit of small density steps
$H_{i}$
. The mathematical character of (2.26) is parabolic. This may appear to contrast with the integro–hyperbolic character of (2.9) but is not inconsistent; it reflects the fact that a nonlinear diffusion equation can arise as a special case of a transport equation in which the coefficients are functions of the dependent variable. In the limit of small density steps
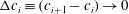 ${\rm\Delta}c_{i}\equiv (c_{i+1}-c_{i})\rightarrow 0$
(and
${\rm\Delta}c_{i}\equiv (c_{i+1}-c_{i})\rightarrow 0$
(and
 $N\rightarrow \infty$
), a discretized distribution is asymptotically equivalent to a continuous distribution. Therefore, despite their differing mathematical character, either (2.9) or (2.26) can in principle be used to describe the same flows.
$N\rightarrow \infty$
), a discretized distribution is asymptotically equivalent to a continuous distribution. Therefore, despite their differing mathematical character, either (2.9) or (2.26) can in principle be used to describe the same flows.
We assume that each isopycnal layer occupies a continuous horizontal interval between the boundary
 $x=0$
on which conditions of the form (2.12) are to be specified and the individual layer front
$x=0$
on which conditions of the form (2.12) are to be specified and the individual layer front
 $x=x_{i}(t)$
. In principle, it is possible for layers to instead occupy intervals beginning at a non-zero value of
$x=x_{i}(t)$
. In principle, it is possible for layers to instead occupy intervals beginning at a non-zero value of
 $x$
, or to lie disconnected between two or more disjoint intervals. However, it will be confirmed a posteriori that these situations do not apply to the asymptotic similarity solutions we seek.
$x$
, or to lie disconnected between two or more disjoint intervals. However, it will be confirmed a posteriori that these situations do not apply to the asymptotic similarity solutions we seek.
At each layer front
 $x=x_{i}(t)$
, we assume that the flux and thickness of layer
$x=x_{i}(t)$
, we assume that the flux and thickness of layer
 $i$
both vanish, so that
$i$
both vanish, so that
 $$\begin{eqnarray}\displaystyle q_{i}(x_{i},t)=0,\quad \text{and}\quad H_{i}(x_{i},t)=0. & & \displaystyle\end{eqnarray}$$
By suitably combining (2.27a,b ) (see appendix B), we can obtain the set of evolution equations for the layer fronts given by
 $$\begin{eqnarray}{\dot{x}}_{i}=u_{i}(x_{i},t)=-U\mathop{\sum }_{k=1}^{n}c_{ik}\frac{\partial H_{k}}{\partial x}.\end{eqnarray}$$
Analogously to the specification of the distribution function
 $V(c)$
, we impose the volume constraints
$V(c)$
, we impose the volume constraints
 $$\begin{eqnarray}{\it\phi}\int _{0}^{x_{i}(t)}H_{i}(x,t)\;\text{d}x=V_{i}(t),\end{eqnarray}$$
where
 $V_{i}$
is the total volume per unit width of layer
$V_{i}$
is the total volume per unit width of layer
 $i$
. For a finite-volume release,
$i$
. For a finite-volume release,
 $V_{i}$
are constant. For a continuous input at constant flux,
$V_{i}$
are constant. For a continuous input at constant flux,
 $V_{i}(t)=Q_{i}t$
are each proportional to time
$V_{i}(t)=Q_{i}t$
are each proportional to time
 $t$
, where
$t$
, where
 $Q_{i}$
is the volumetric flux of input of fluid of density
$Q_{i}$
is the volumetric flux of input of fluid of density
 $c_{i}$
.
$c_{i}$
.
3 Release of constant mass
We begin by considering the release of a finite volume of fluid of fixed total relative mass per unit width
 $M_{0}$
. In this case, we prescribe the density distribution (2.17) as
$M_{0}$
. In this case, we prescribe the density distribution (2.17) as
 $$\begin{eqnarray}M(c)=M_{0}\hat{M}(c),\end{eqnarray}$$
where
 $\hat{M}(c)$
is a dimensionless, increasing function of density
$\hat{M}(c)$
is a dimensionless, increasing function of density
 $c$
satisfying
$c$
satisfying
 $\hat{M}(0)=0$
and
$\hat{M}(0)=0$
and
 $\hat{M}(1)=1$
. For now, we keep the dimensionless distribution function
$\hat{M}(1)=1$
. For now, we keep the dimensionless distribution function
 $\tilde{M}(c)$
general and consider the implications of scaling alone.
$\tilde{M}(c)$
general and consider the implications of scaling alone.
A scaling analysis of the system given by (2.9), (2.16), (2.20) and (3.1) shows that a horizontal length scale cannot be formed from the parameters without incorporating a dependence on time
 $t$
. This indicates a mode of self-similar propagation independent of the initial release conditions. The relevant similarity forms of the horizontal and vertical coordinates
$t$
. This indicates a mode of self-similar propagation independent of the initial release conditions. The relevant similarity forms of the horizontal and vertical coordinates
 $x$
and
$x$
and
 $z$
can be determined from the scaling analysis as
$z$
can be determined from the scaling analysis as
 $$\begin{eqnarray}\displaystyle {\it\xi}=\left({\it\phi}/\mathscr{V}Ut\right)^{1/3}x\quad \text{and}\quad {\it\zeta}=\left({\it\phi}^{2}Ut/\mathscr{V}^{2}\right)^{1/3}z, & & \displaystyle\end{eqnarray}$$
respectively, where
 $\mathscr{V}\equiv M_{0}/{\rm\Delta}{\it\rho}$
represents the hypothetical volume that the current would occupy were its mass
$\mathscr{V}\equiv M_{0}/{\rm\Delta}{\it\rho}$
represents the hypothetical volume that the current would occupy were its mass
 $M_{0}$
concentrated into the maximum density alone. Consistent with (3.2a,b
), we define the similarity forms of the horizontal extent
$M_{0}$
concentrated into the maximum density alone. Consistent with (3.2a,b
), we define the similarity forms of the horizontal extent
 ${\it\xi}_{N}$
, vertical height
${\it\xi}_{N}$
, vertical height
 $f({\it\xi})$
and horizontal velocity
$f({\it\xi})$
and horizontal velocity
 $s({\it\xi})$
, given by
$s({\it\xi})$
, given by
 $$\begin{eqnarray}\displaystyle & x_{N}=\left(\mathscr{V}U/{\it\phi}\right)^{1/3}t^{1/3}{\it\xi}_{N}, & \displaystyle\end{eqnarray}$$
 $$\begin{eqnarray}\displaystyle & h=\left(\mathscr{V}^{2}/{\it\phi}^{2}U\right)^{1/3}t^{-1/3}f({\it\xi}), & \displaystyle\end{eqnarray}$$
 $$\begin{eqnarray}\displaystyle & u=\left(\mathscr{V}U/{\it\phi}\right)^{1/3}t^{-2/3}s({\it\xi}), & \displaystyle\end{eqnarray}$$
respectively (Woods & Mason Reference Woods and Mason2000). Equations (3.3) and (3.4) imply that the horizontal and vertical extents evolve in proportion to
 $t^{1/3}$
and
$t^{1/3}$
and
 $t^{-1/3}$
, respectively. These exponents are equivalent to those found for a uniform-density gravity current (Barenblatt Reference Barenblatt1952) because the specification of a density distribution (2.20) does not introduce any new dimensional parameters from which a different scaling law might be developed.
$t^{-1/3}$
, respectively. These exponents are equivalent to those found for a uniform-density gravity current (Barenblatt Reference Barenblatt1952) because the specification of a density distribution (2.20) does not introduce any new dimensional parameters from which a different scaling law might be developed.

Figure 5. (a) Distributions of relative density
 $c$
for the cumulative mass–density functions given by (3.7a
) for illustrative distribution parameters
$c$
for the cumulative mass–density functions given by (3.7a
) for illustrative distribution parameters
 $n=0.25,1,4$
and 20, shown in their horizontally stratified states. Darker blue indicates heavier fluid. (b) The corresponding volume–density functions
$n=0.25,1,4$
and 20, shown in their horizontally stratified states. Darker blue indicates heavier fluid. (b) The corresponding volume–density functions
 $V(c)$
given by (3.7b
), illustrating a linear distribution for
$V(c)$
given by (3.7b
), illustrating a linear distribution for
 $n=1$
, more diffuse distributions for
$n=1$
, more diffuse distributions for
 $n<1$
and less variable distributions for
$n<1$
and less variable distributions for
 $n>1$
. Each distribution has the equivalent total mass in accord with (3.6).
$n>1$
. Each distribution has the equivalent total mass in accord with (3.6).
In order to explore a variety of density distributions, we specify mass distributions of the general power-law form
 $$\begin{eqnarray}\hat{M}(c)=c^{n+1},\end{eqnarray}$$
where
 $n\geqslant 0$
is called the distribution parameter. Note that the total dimensionless mass
$n\geqslant 0$
is called the distribution parameter. Note that the total dimensionless mass
 $\hat{M}(1)=1$
is independent of the parameter
$\hat{M}(1)=1$
is independent of the parameter
 $n$
, so that the total mass of the current is kept fixed across the range of distributions we consider. By substituting (3.1) with (3.6) into (2.20b
), the corresponding cumulative volume–density function is determined as
$n$
, so that the total mass of the current is kept fixed across the range of distributions we consider. By substituting (3.1) with (3.6) into (2.20b
), the corresponding cumulative volume–density function is determined as
 $$\begin{eqnarray}\displaystyle V(c)=V_{0}\hat{V}(c)=V_{0}c^{n},\quad \text{where }V_{0}\equiv V(1)=\frac{n+1}{n}\mathscr{V} & & \displaystyle\end{eqnarray}$$
is the total volume of the current. The distributions defined by (3.6), or equivalently (3.7), are illustrated as functions of
 $z$
and
$z$
and
 $c$
for a selection of distribution parameters
$c$
for a selection of distribution parameters
 $n$
in figures 5(a,b). With
$n$
in figures 5(a,b). With
 $n=1$
, the cumulative volume
$n=1$
, the cumulative volume
 $V(c)=2c$
is linear, implying equal volumes per unit density. When
$V(c)=2c$
is linear, implying equal volumes per unit density. When
 $n<1$
, there is a greater volume of lighter fluid relative to heavier fluid, corresponding to a more diffuse current. When
$n<1$
, there is a greater volume of lighter fluid relative to heavier fluid, corresponding to a more diffuse current. When
 $n>1$
, more mass is concentrated towards the value
$n>1$
, more mass is concentrated towards the value
 $c=1$
. The case
$c=1$
. The case
 $n=\infty$
recovers the case of uniform density (
$n=\infty$
recovers the case of uniform density (
 $c=1$
). Note that, having fixed the total mass in prescribing (3.6), the total volume
$c=1$
). Note that, having fixed the total mass in prescribing (3.6), the total volume
 $V_{0}$
given by (3.7b
) increases with
$V_{0}$
given by (3.7b
) increases with
 $n$
because the mass in those cases is spread over a larger volume.
$n$
because the mass in those cases is spread over a larger volume.
The similarity solutions were calculated numerically using a method of discretizing the continuous distribution (2.9) into a large collection of piecewise-constant densities and then solving the model equations applicable to a discrete density distribution developed in § 2.3. Details of the numerical method are given in appendix C. A suite of solutions is shown in figure 6 for a selection of distribution parameters
 $n=4,2,1$
and
$n=4,2,1$
and
 $0.25$
. Remarkably, in all cases it is found that the density field varies only vertically: the isopycnal surfaces (of constant density) form perfectly horizontal stratifications. The height profile and vertical density profiles
$0.25$
. Remarkably, in all cases it is found that the density field varies only vertically: the isopycnal surfaces (of constant density) form perfectly horizontal stratifications. The height profile and vertical density profiles
 $c({\it\zeta})$
for a selection of cases are shown together in figure 7(a,b). The prefactor to the horizontal extent,
$c({\it\zeta})$
for a selection of cases are shown together in figure 7(a,b). The prefactor to the horizontal extent,
 ${\it\xi}_{N}\approx 2.08$
, is found to be identical in all cases of
${\it\xi}_{N}\approx 2.08$
, is found to be identical in all cases of
 $n$
, indicating that the rate of horizontal propagation is independent of how the mass of the current is distributed.
$n$
, indicating that the rate of horizontal propagation is independent of how the mass of the current is distributed.

Figure 6. Numerically determined similarity solutions describing a release of constant mass for distribution parameters (a)
 $n=4$
, (b)
$n=4$
, (b)
 $n=2$
, (c)
$n=2$
, (c)
 $n=1$
and (d)
$n=1$
and (d)
 $n=0.25$
used to specify the distribution (3.6). The outline of the current is shown as a thick black curve. The normalized density field
$n=0.25$
used to specify the distribution (3.6). The outline of the current is shown as a thick black curve. The normalized density field
 $c({\it\xi},{\it\zeta})$
is shown as a colour plot, with 10th percentile contours shown as thin black lines. Darker shading indicates denser fluid. All (isopycnal) contours of constant density are found to align horizontally.
$c({\it\xi},{\it\zeta})$
is shown as a colour plot, with 10th percentile contours shown as thin black lines. Darker shading indicates denser fluid. All (isopycnal) contours of constant density are found to align horizontally.

Figure 7. (a) The height profiles
 $f({\it\eta})$
of the similarity solutions describing a release of constant mass for distribution parameters
$f({\it\eta})$
of the similarity solutions describing a release of constant mass for distribution parameters
 $n=0,0.25,0.5,1,2,4$
and
$n=0,0.25,0.5,1,2,4$
and
 $\infty$
, and (b) the vertical dependence of the density
$\infty$
, and (b) the vertical dependence of the density
 $c({\it\zeta})$
for
$c({\it\zeta})$
for
 $n=0.25,1$
and
$n=0.25,1$
and
 $4$
. The analytical solution (3.15) is shown as a blue, solid curve for
$4$
. The analytical solution (3.15) is shown as a blue, solid curve for
 $n=0$
and
$n=0$
and
 $\infty$
and as a blue dashed curve for
$\infty$
and as a blue dashed curve for
 $n=0.25$
and 4.
$n=0.25$
and 4.
The height profile in the case
 $n=4$
is qualitatively similar to the uniform-density case
$n=4$
is qualitatively similar to the uniform-density case
 $n=\infty$
, which likewise contains a horizontal top at
$n=\infty$
, which likewise contains a horizontal top at
 ${\it\xi}=0$
(Barenblatt Reference Barenblatt1952). As illustrated in figure 7(a), the case
${\it\xi}=0$
(Barenblatt Reference Barenblatt1952). As illustrated in figure 7(a), the case
 $n=4$
is slightly taller, owing to the relatively larger volume of lighter fluid it contains compared to the uniform-density case. As
$n=4$
is slightly taller, owing to the relatively larger volume of lighter fluid it contains compared to the uniform-density case. As
 $n$
is reduced, there is a qualitative change in the height profile from a convex shape for
$n$
is reduced, there is a qualitative change in the height profile from a convex shape for
 $n>2$
to a linear shape for
$n>2$
to a linear shape for
 $n=2$
. In this case, the density profile
$n=2$
. In this case, the density profile
 $c({\it\zeta})$
is also linear (see figure 7
b). As
$c({\it\zeta})$
is also linear (see figure 7
b). As
 $n$
is reduced further to
$n$
is reduced further to
 $n=1$
, the profile turns concave, with a considerable increase in height for
$n=1$
, the profile turns concave, with a considerable increase in height for
 ${\it\xi}\lesssim 0.5$
. With
${\it\xi}\lesssim 0.5$
. With
 $n=0.25$
, the current appears to be infinitely tall, with the height accumulating above
$n=0.25$
, the current appears to be infinitely tall, with the height accumulating above
 ${\it\xi}=0$
without limit. The results indicate that lighter fluid in a gravity current has a strong tendency to accumulate vertically above the region of input, rather than contribute to horizontal propagation. An important physical conclusion is that there is no apparent limit to the vertical extent of trace fluids remaining on top of a gravity current to long times.
${\it\xi}=0$
without limit. The results indicate that lighter fluid in a gravity current has a strong tendency to accumulate vertically above the region of input, rather than contribute to horizontal propagation. An important physical conclusion is that there is no apparent limit to the vertical extent of trace fluids remaining on top of a gravity current to long times.
3.1 Analytical results
The numerical solutions all show that the density contours align horizontally, so
 $c=c(z,t)$
only. Assuming that this is a generic feature of the similarity solutions relevant to a finite release, not only applicable to the power-law distributions (2.20), we revert to a general density distribution
$c=c(z,t)$
only. Assuming that this is a generic feature of the similarity solutions relevant to a finite release, not only applicable to the power-law distributions (2.20), we revert to a general density distribution
 $\tilde{V}(c)$
and consider the dynamical simplifications arising from the assumption that
$\tilde{V}(c)$
and consider the dynamical simplifications arising from the assumption that
 $c=c(z,t)$
.
$c=c(z,t)$
.
First, we note that (2.5) simplifies to
 $$\begin{eqnarray}u=-Uc(h,t)\frac{\partial h}{\partial x},\end{eqnarray}$$
which shows that the horizontal velocity is proportional only to the product of the interface height and the density on the interface. This reduction occurs because, with no internal variations in pressure possible if
 $\partial c/\partial x=0$
, the only means to generate a horizontal gradient in pressure is from a gradient in the interface
$\partial c/\partial x=0$
, the only means to generate a horizontal gradient in pressure is from a gradient in the interface
 $\partial h/\partial x$
. In this situation, (3.8) further implies that
$\partial h/\partial x$
. In this situation, (3.8) further implies that
 $\partial u/\partial z=0$
and hence that the horizontal velocity is independent of the vertical coordinate
$\partial u/\partial z=0$
and hence that the horizontal velocity is independent of the vertical coordinate
 $z$
. This property is shared with uniform-density gravity currents, which likewise contain no horizontal gradients in density,
$z$
. This property is shared with uniform-density gravity currents, which likewise contain no horizontal gradients in density,
 $\partial c/\partial x=0$
. However, it is not generally true of variable-density flows for which
$\partial c/\partial x=0$
. However, it is not generally true of variable-density flows for which
 $\partial c/\partial x\neq 0$
, with the case of a continuous input considered later in § 4 proving to be one such example.
$\partial c/\partial x\neq 0$
, with the case of a continuous input considered later in § 4 proving to be one such example.
Substitution of (3.8) into (2.8) determines the evolution equation
 $$\begin{eqnarray}\frac{\partial h}{\partial t}=U\frac{\partial }{\partial x}\left[c(h,t)\,h\frac{\partial h}{\partial x}\right].\end{eqnarray}$$
This generalizes the nonlinear diffusion equation applicable to a uniform-density gravity current in a porous medium to allow for the more general case of a purely vertically variant density (cf. Woods & Mason Reference Woods and Mason2000). The new mathematical feature is the normalized density
 $c(h,t)$
appearing in the effective diffusivity. Recasting (3.9) in terms of the similarity variables (3.2) and writing
$c(h,t)$
appearing in the effective diffusivity. Recasting (3.9) in terms of the similarity variables (3.2) and writing
 $c=c({\it\zeta})$
, we obtain
$c=c({\it\zeta})$
, we obtain
 $$\begin{eqnarray}{\textstyle \frac{1}{3}}({\it\xi}f)^{\prime }=(fs)^{\prime },\quad \text{where }s=-c[f({\it\xi})]f^{\prime }\end{eqnarray}$$
is the scaled velocity and a prime denotes differentiation with respect to the argument. Integration of (3.10) subject to the condition of a vanishing frontal flux,
 $\lim _{{\it\xi}\rightarrow {\it\xi}_{N}}(fs)=0$
, yields
$\lim _{{\it\xi}\rightarrow {\it\xi}_{N}}(fs)=0$
, yields
 $$\begin{eqnarray}s={\textstyle \frac{1}{3}}{\it\xi}=-f^{\prime }({\it\xi})c[f({\it\xi})],\end{eqnarray}$$
which shows that the scaled velocity
 $s$
increases linearly from zero at
$s$
increases linearly from zero at
 ${\it\xi}=0$
to the maximum
${\it\xi}=0$
to the maximum
 $s={\it\xi}_{N}/3$
at the front of the current.
$s={\it\xi}_{N}/3$
at the front of the current.

Figure 8. Schematic showing how the shaded volume relates to the height
 $f(\tilde{{\it\xi}})$
in situations where the density contours are horizontal, giving rise to the relationship (3.12).
$f(\tilde{{\it\xi}})$
in situations where the density contours are horizontal, giving rise to the relationship (3.12).
As highlighted in § 2, a direct imposition of the density distribution
 $\hat{V}(c)$
cannot generally be achieved using a simple volume constraint. However, in the special situations in which
$\hat{V}(c)$
cannot generally be achieved using a simple volume constraint. However, in the special situations in which
 $\partial c/\partial x=0$
considered here, it can be done as follows. Let the line
$\partial c/\partial x=0$
considered here, it can be done as follows. Let the line
 ${\it\zeta}=f(\tilde{{\it\xi}})$
represent the horizontal isopycnal
${\it\zeta}=f(\tilde{{\it\xi}})$
represent the horizontal isopycnal
 $\tilde{c}=c[f(\tilde{{\it\xi}})]$
shown as a thick horizontal line in figure 8. Since the fluid above that line has density less than
$\tilde{c}=c[f(\tilde{{\it\xi}})]$
shown as a thick horizontal line in figure 8. Since the fluid above that line has density less than
 $\tilde{c}$
, the shaded area in figure 8 is by definition equal to
$\tilde{c}$
, the shaded area in figure 8 is by definition equal to
 $\hat{V}\{c[f(\tilde{{\it\xi}})]\}$
. Therefore,
$\hat{V}\{c[f(\tilde{{\it\xi}})]\}$
. Therefore,
 $$\begin{eqnarray}\int _{0}^{{\it\xi}}f(\tilde{{\it\xi}})\;\text{d}\tilde{{\it\xi}}-{\it\xi}f({\it\xi})=\hat{V}\{c[f({\it\xi})]\},\end{eqnarray}$$
which imposes the distribution constraint. Differentiating (3.12) with respect to
 ${\it\xi}$
and cancelling a factor of
${\it\xi}$
and cancelling a factor of
 $f^{\prime }({\it\xi})$
, we obtain
$f^{\prime }({\it\xi})$
, we obtain
 $$\begin{eqnarray}-{\it\xi}=c^{\prime }[f({\it\xi})]\,\hat{V}\{c[f({\it\xi})]\}.\end{eqnarray}$$
Using (3.11) to evaluate the density
 $c$
in (3.13), we obtain finally the differential equation
$c$
in (3.13), we obtain finally the differential equation
 $$\begin{eqnarray}\left(\frac{{\it\xi}}{3f^{\prime }}\right)^{\prime }\hat{V}^{\prime }\left(-\frac{{\it\xi}}{3f^{\prime }}\right)={\it\xi},\end{eqnarray}$$
the solution of which provides the height profile
 $f({\it\xi})$
given any specified distribution function
$f({\it\xi})$
given any specified distribution function
 $\tilde{V}(c)$
. With
$\tilde{V}(c)$
. With
 $f({\it\xi})$
in hand, we can use (3.11) to determine the density field via
$f({\it\xi})$
in hand, we can use (3.11) to determine the density field via
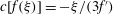 $c[f({\it\xi})]=-{\it\xi}/(3f^{\prime })$
. With the power law (3.7a
) as a concrete example, we can integrate (3.14) with
$c[f({\it\xi})]=-{\it\xi}/(3f^{\prime })$
. With the power law (3.7a
) as a concrete example, we can integrate (3.14) with
 $n\neq 1/2$
to give the analytical solutions
$n\neq 1/2$
to give the analytical solutions
 $$\begin{eqnarray}\displaystyle \frac{f({\it\xi})}{f_{0}}=1-\left(\frac{{\it\xi}}{{\it\xi}_{N}}\right)^{(2n-1)/(n+1)}\quad \text{and}\quad c({\it\zeta})=\left(1-\frac{{\it\zeta}}{f_{0}}\right)^{3/(2n-1)}, & & \displaystyle\end{eqnarray}$$
where
 $f_{0}\equiv 3^{1/3}(n+1)/(2n-1)$
and
$f_{0}\equiv 3^{1/3}(n+1)/(2n-1)$
and
 ${\it\xi}_{N}=9^{1/3}$
. The integration of (3.14) with
${\it\xi}_{N}=9^{1/3}$
. The integration of (3.14) with
 $n=1/2$
involves a logarithm and is omitted here for brevity. The solutions (3.15a
) are plotted as blue curves in figure 7(a) (solid for
$n=1/2$
involves a logarithm and is omitted here for brevity. The solutions (3.15a
) are plotted as blue curves in figure 7(a) (solid for
 $n=0$
and
$n=0$
and
 $\infty$
and dashed for
$\infty$
and dashed for
 $n=0.25$
and 4), providing validation of our numerical solutions. In the uniform-density case
$n=0.25$
and 4), providing validation of our numerical solutions. In the uniform-density case
 $n=\infty$
, (3.15a,b
) yield the height profile
$n=\infty$
, (3.15a,b
) yield the height profile
 $f=({\it\xi}_{N}^{2}-{\it\xi}^{2})/6$
and density field
$f=({\it\xi}_{N}^{2}-{\it\xi}^{2})/6$
and density field
 $c=1$
, obtained previously by Barenblatt (Reference Barenblatt1952). The case
$c=1$
, obtained previously by Barenblatt (Reference Barenblatt1952). The case
 $n=1$
was obtained previously by Woods & Mason (Reference Woods and Mason2000). It is found that the qualitative transitions in shape indicated from our earlier numerical solutions shown in figures 6 and 7(a) correspond to critical switches in the form of the exponent in (3.15a
). For
$n=1$
was obtained previously by Woods & Mason (Reference Woods and Mason2000). It is found that the qualitative transitions in shape indicated from our earlier numerical solutions shown in figures 6 and 7(a) correspond to critical switches in the form of the exponent in (3.15a
). For
 $n>2$
, the exponent is greater than unity and the current is convex. For
$n>2$
, the exponent is greater than unity and the current is convex. For
 $n=2$
, the exponent is unity and the profile is completely linear, consistent with our numerical solution shown in figure 6(b). For
$n=2$
, the exponent is unity and the profile is completely linear, consistent with our numerical solution shown in figure 6(b). For
 $1/2<n<2$
, the height profile becomes concave with a singular gradient at
$1/2<n<2$
, the height profile becomes concave with a singular gradient at
 ${\it\xi}=0$
. The transition to an infinitely tall current occurs for
${\it\xi}=0$
. The transition to an infinitely tall current occurs for
 $n\leqslant 1/2$
.
$n\leqslant 1/2$
.
The analytical solutions obtained above also confirm that the frontal position
 ${\it\xi}_{N}=9^{1/3}$
is independent of the distribution parameter
${\it\xi}_{N}=9^{1/3}$
is independent of the distribution parameter
 $n$
, as was indicated earlier by our numerical solutions. It is natural now to conjecture that the horizontal extent
$n$
, as was indicated earlier by our numerical solutions. It is natural now to conjecture that the horizontal extent
 ${\it\xi}_{N}$
is completely independent of the specified distribution
${\it\xi}_{N}$
is completely independent of the specified distribution
 $\hat{V}(c)$
, not only applying to density distributions of the power-law forms (2.9). To prove this, we first use the chain rule to change the integration variable in (2.20) from
$\hat{V}(c)$
, not only applying to density distributions of the power-law forms (2.9). To prove this, we first use the chain rule to change the integration variable in (2.20) from
 $c$
to
$c$
to
 ${\it\xi}$
to give
${\it\xi}$
to give
 $$\begin{eqnarray}\int _{0}^{{\it\xi}_{N}}\{c^{\prime }[f({\it\xi})]V^{\prime }\{c[f({\it\xi})]\}\}\{c[f({\it\xi})]f^{\prime }({\it\xi})\}\;\text{d}{\it\xi}=1.\end{eqnarray}$$
Now using (3.10) and (3.13) to evaluate the braced factors, we obtain
 $$\begin{eqnarray}\int _{0}^{{\it\xi}_{N}}\frac{1}{3}{\it\xi}^{2}\;\text{d}{\it\xi}=1\quad \text{and hence }{\it\xi}_{N}=9^{1/3}\end{eqnarray}$$
on integration. The rate of horizontal propagation of the gravity current therefore depends only on its total relative mass, despite the specific density distribution having a significant effect on its vertical structure.
4 Continuous input
We now consider a current resulting from a source producing fluid over a distribution of densities. In order to specify a source of this kind, we use the source distribution function
 $Q(c)$
, defined as the volumetric flux per unit width at which fluid of densities
$Q(c)$
, defined as the volumetric flux per unit width at which fluid of densities
 $c$
or less is input. Assuming that the source begins to introduce fluid at
$c$
or less is input. Assuming that the source begins to introduce fluid at
 $t=0$
, the volumetric distribution function defined by (3.7) satisfies
$t=0$
, the volumetric distribution function defined by (3.7) satisfies
 $$\begin{eqnarray}V(c,t)=Q(c)t.\end{eqnarray}$$
The specification of (4.1) provides the global volume constraints relevant to the case of a continuous input. While these constraints will be sufficient for the purpose of determining asymptotic similarity solutions, it is insightful to consider first how the specification of a variable-density input flux results in local conditions on the density gradient
 $\partial c/\partial x$
near the source.
$\partial c/\partial x$
near the source.
Since the density is stably stratified (
 $\partial c/\partial z<0$
), a condition of continuous input along
$\partial c/\partial z<0$
), a condition of continuous input along
 $x=0$
can be specified by the integral equation
$x=0$
can be specified by the integral equation
 $$\begin{eqnarray}\int _{z}^{h(0,t)}u(0,\tilde{z},t)\;\text{d}\tilde{z}=Q[c(0,z,t)],\end{eqnarray}$$
which implies that fluid of density
 $c$
or less is input at the rate
$c$
or less is input at the rate
 $Q(c)$
. Differentiating (4.2) with respect to
$Q(c)$
. Differentiating (4.2) with respect to
 $z$
, we obtain the direct, local condition on the horizontal velocity,
$z$
, we obtain the direct, local condition on the horizontal velocity,
 $$\begin{eqnarray}u(0,z,t)=u_{0}(z,t)=-\frac{\partial }{\partial z}Q[c(0,z,t)]=-\frac{\partial c}{\partial z}Q^{\prime }[c(0,z,t)],\end{eqnarray}$$
which shows that the flux distribution
 $Q^{\prime }(c)$
determines
$Q^{\prime }(c)$
determines
 $u_{0}(z,t)$
along
$u_{0}(z,t)$
along
 $x=0$
in a manner that depends implicitly on
$x=0$
in a manner that depends implicitly on
 $\partial c/\partial z$
. Combining (4.3) with (2.13), we obtain
$\partial c/\partial z$
. Combining (4.3) with (2.13), we obtain
 $$\begin{eqnarray}\displaystyle U\frac{\partial c}{\partial x}(0,z,t)=\frac{\partial ^{2}}{\partial z^{2}}Q[c(0,z,t)]=\frac{\partial ^{2}c}{\partial z^{2}}Q^{\prime }(c)+\left(\frac{\partial c}{\partial z}\right)^{2}Q^{\prime \prime }(c), & & \displaystyle\end{eqnarray}$$
which shows that the flux condition specifies the horizontal density gradient
 $\partial c/\partial x$
along
$\partial c/\partial x$
along
 $x=0$
. In the illustrative example
$x=0$
. In the illustrative example
 $Q(c)=Q_{0}c$
, we can evaluate
$Q(c)=Q_{0}c$
, we can evaluate
 $Q^{\prime }(c)=Q_{0}$
and
$Q^{\prime }(c)=Q_{0}$
and
 $Q^{\prime \prime }(c)=0$
in (4.4) to obtain
$Q^{\prime \prime }(c)=0$
in (4.4) to obtain
 $$\begin{eqnarray}U\frac{\partial c}{\partial x}=Q_{0}\frac{\partial ^{2}c}{\partial z^{2}}\quad \text{on }x=0,\end{eqnarray}$$
which illustrates how the condition on
 $\partial c/\partial x$
is dependent on the vertical density profile along
$\partial c/\partial x$
is dependent on the vertical density profile along
 $x=0$
. This is analogous to the manner in which the condition on the interfacial gradient of a sourced gravity current of uniform density depends on the instantaneous height of the current at the point of input (see (3.2) of Pegler, Huppert & Neufeld Reference Pegler, Huppert and Neufeld2013a
, for example). Note that (4.4) differs from a diffusive flux condition, where the condition is imposed directly on the compositional gradient, rather than in an implicit manner.
$x=0$
. This is analogous to the manner in which the condition on the interfacial gradient of a sourced gravity current of uniform density depends on the instantaneous height of the current at the point of input (see (3.2) of Pegler, Huppert & Neufeld Reference Pegler, Huppert and Neufeld2013a
, for example). Note that (4.4) differs from a diffusive flux condition, where the condition is imposed directly on the compositional gradient, rather than in an implicit manner.
To specify a fixed total mass flux, we set
 $$\begin{eqnarray}M(c)=J(c)t\equiv J_{0}{\hat{J}}(c)t,\end{eqnarray}$$
where
 $J_{0}\equiv J(1)$
is the total (relative) mass flux and
$J_{0}\equiv J(1)$
is the total (relative) mass flux and
 ${\hat{J}}(c)$
is a dimensionless, increasing function that satisfies
${\hat{J}}(c)$
is a dimensionless, increasing function that satisfies
 ${\hat{J}}(0)=0$
and
${\hat{J}}(0)=0$
and
 ${\hat{J}}(1)=1$
. By substituting (4.6) and (4.1) into (2.20b
) and cancelling the factor of
${\hat{J}}(1)=1$
. By substituting (4.6) and (4.1) into (2.20b
) and cancelling the factor of
 $t$
, we relate
$t$
, we relate
 $J(c)$
to the volumetric source distribution function
$J(c)$
to the volumetric source distribution function
 $Q(c)$
according to
$Q(c)$
according to
 $$\begin{eqnarray}Q(c)=\frac{1}{{\rm\Delta}{\it\rho}}\int _{0}^{c}\frac{J^{\prime }(\tilde{c})}{\tilde{c}}\;\text{d}\tilde{c}.\end{eqnarray}$$
Conducting a similar scaling analysis to that performed in § 3 but with (4.6) in place of (3.6), we obtain the similarity variables for horizontal dimensions, height and velocity relevant to a continuous input as
 $$\begin{eqnarray}\displaystyle & (x,x_{N})=\left(\mathscr{Q}U/{\it\phi}\right)^{1/3}t^{2/3}({\it\xi},{\it\xi}_{N}), & \displaystyle\end{eqnarray}$$
 $$\begin{eqnarray}\displaystyle & (z,h)=\left(\mathscr{Q}^{2}/{\it\phi}^{2}U\right)^{1/3}t^{1/3}({\it\zeta},f({\it\xi})), & \displaystyle\end{eqnarray}$$
 $$\begin{eqnarray}\displaystyle & u=\left(\mathscr{Q}U/{\it\phi}\right)^{1/3}t^{-1/3}s({\it\xi},{\it\zeta}), & \displaystyle\end{eqnarray}$$
where
 $\mathscr{Q}\equiv J_{0}/{\rm\Delta}{\it\rho}$
. These scales show that the current extends horizontally in proportion to
$\mathscr{Q}\equiv J_{0}/{\rm\Delta}{\it\rho}$
. These scales show that the current extends horizontally in proportion to
 $t^{2/3}$
and vertically in proportion to
$t^{2/3}$
and vertically in proportion to
 $t^{1/3}$
, analogously to the uniform-density case (Huppert & Woods Reference Huppert and Woods1995).
$t^{1/3}$
, analogously to the uniform-density case (Huppert & Woods Reference Huppert and Woods1995).

Figure 9. Similarity solutions describing a gravity current fed at a constant mass flux for distribution parameters (a)
 $n=4$
, (b)
$n=4$
, (b)
 $n=2$
, (c)
$n=2$
, (c)
 $n=1$
and (d)
$n=1$
and (d)
 $n=0.25$
. The outline of the current is shown as a thick black curve. The normalized density field
$n=0.25$
. The outline of the current is shown as a thick black curve. The normalized density field
 $c({\it\xi},{\it\eta})$
is shown as a colour plot, with 10th percentile contours shown as thin black curves. Darker shading indicates denser fluid.
$c({\it\xi},{\it\eta})$
is shown as a colour plot, with 10th percentile contours shown as thin black curves. Darker shading indicates denser fluid.

Figure 10. (a) The height
 $f({\it\eta})$
of the similarity solutions for distribution exponents
$f({\it\eta})$
of the similarity solutions for distribution exponents
 $n=0.25,0.5,1,2,4$
and
$n=0.25,0.5,1,2,4$
and
 $\infty$
. (b) The vertical density profile
$\infty$
. (b) The vertical density profile
 $c(0,{\it\zeta})$
along
$c(0,{\it\zeta})$
along
 ${\it\xi}=0$
for
${\it\xi}=0$
for
 $n=0.25,0.5,1$
and 4.
$n=0.25,0.5,1$
and 4.
Let us now explore the effect of a variable-density input by specifying the illustrative power-law distribution
 $$\begin{eqnarray}\displaystyle {\hat{J}}(c)=c^{n+1},\quad \text{and}\quad \hat{Q}(c)\equiv \frac{Q(c)}{\mathscr{Q}}=\frac{(n+1)}{n}c^{n}, & & \displaystyle\end{eqnarray}$$
where the latter follows from substitution of (4.6) with (4.11a ) into (4.7). Were fluid introduced by a source with these distribution functions into the confined region behind a lock gate, the resulting stratifications would be represented by those illustrated earlier in figure 5(a). To determine the similarity solutions, we apply the same numerical approach used to solve the case of a finite release in § 3. As discussed at the end of appendix C, the only adaptation to the numerical scheme was to accommodate the different differential system (C 5)–(C 6) that arises when (2.26) and (2.28) are recast in terms of (4.8) instead of (3.2).
Figure 11. Horizontal velocity profiles
 $s({\it\xi},{\it\zeta})$
at a selection of horizontal positions
$s({\it\xi},{\it\zeta})$
at a selection of horizontal positions
 ${\it\xi}=0,0.4,0.8$
and
${\it\xi}=0,0.4,0.8$
and
 $1.2$
, illustrating their dependence on vertical position
$1.2$
, illustrating their dependence on vertical position
 ${\it\zeta}$
. The height profile
${\it\zeta}$
. The height profile
 $f({\it\xi})$
is shown as a blue curve.
$f({\it\xi})$
is shown as a blue curve.
The solutions for a range of distribution parameters
 $n$
from 0.25 to 4 are shown in figure 9. The solutions show that the surfaces of constant density slope downwards in the direction of the flow. This is different to the situation found for a constant-volume release in § 3, where isopycnals are universally horizontal. Only the isopycnal along the base is horizontal in the present situation. The heaviest fluid therefore lines the base of the current. Note that this property does not necessarily apply to gravity currents with variations in viscosity, as has been illustrated by Woods & Mason (Reference Woods and Mason2000) for certain two-layer currents.
$n$
from 0.25 to 4 are shown in figure 9. The solutions show that the surfaces of constant density slope downwards in the direction of the flow. This is different to the situation found for a constant-volume release in § 3, where isopycnals are universally horizontal. Only the isopycnal along the base is horizontal in the present situation. The heaviest fluid therefore lines the base of the current. Note that this property does not necessarily apply to gravity currents with variations in viscosity, as has been illustrated by Woods & Mason (Reference Woods and Mason2000) for certain two-layer currents.
The case
 $n=4$
has a broadly linear, slightly convex shape similar to that which applies to a continuously injected gravity current of uniform density (Huppert & Woods Reference Huppert and Woods1995). As
$n=4$
has a broadly linear, slightly convex shape similar to that which applies to a continuously injected gravity current of uniform density (Huppert & Woods Reference Huppert and Woods1995). As
 $n$
is reduced further, the current becomes fully concave once
$n$
is reduced further, the current becomes fully concave once
 $n\leqslant 2.8$
. The numerical solutions indicate that a transition to a slope of infinite gradient near the input occurs at
$n\leqslant 2.8$
. The numerical solutions indicate that a transition to a slope of infinite gradient near the input occurs at
 $n\approx 1$
and to an infinite height for
$n\approx 1$
and to an infinite height for
 $n\approx 0.5$
(precise estimates of these transitional values of
$n\approx 0.5$
(precise estimates of these transitional values of
 $n$
were difficult to ascertain numerically because of the singularity in the height profile at
$n$
were difficult to ascertain numerically because of the singularity in the height profile at
 ${\it\xi}=0$
).
${\it\xi}=0$
).
A selection of horizontal velocity profiles
 $s({\it\xi},{\it\zeta})$
for the illustrative case
$s({\it\xi},{\it\zeta})$
for the illustrative case
 $n=1$
are plotted in figure 11. It is found that the horizontal velocity varies with vertical position
$n=1$
are plotted in figure 11. It is found that the horizontal velocity varies with vertical position
 $z$
. This contrasts with all uniform-density gravity currents in porous media, which have vertically invariant velocity fields. These properties are consistent with the result (2.7), which implies that vertical variations in horizontal velocity occur only if there are horizontal gradients in density present. At the input
$z$
. This contrasts with all uniform-density gravity currents in porous media, which have vertically invariant velocity fields. These properties are consistent with the result (2.7), which implies that vertical variations in horizontal velocity occur only if there are horizontal gradients in density present. At the input
 ${\it\xi}=0$
, we see that the velocity profile varies significantly from a maximal value at the base to a value of zero at the top. This is expected because the fluid at the top of the current has zero relative density [
${\it\xi}=0$
, we see that the velocity profile varies significantly from a maximal value at the base to a value of zero at the top. This is expected because the fluid at the top of the current has zero relative density [
 $c(0,f(0))=0$
] and is therefore stagnant. The vertical gradient of the horizontal velocity
$c(0,f(0))=0$
] and is therefore stagnant. The vertical gradient of the horizontal velocity
 $\partial u/\partial {\it\zeta}=0$
along the base
$\partial u/\partial {\it\zeta}=0$
along the base
 ${\it\zeta}=0$
, which is consistent with (2.9) and the fact that
${\it\zeta}=0$
, which is consistent with (2.9) and the fact that
 $c=1$
along
$c=1$
along
 ${\it\zeta}=0$
.
${\it\zeta}=0$
.
Interestingly, there is some variation in the rate of horizontal propagation for different values of
 $n$
, contrasting with the result that the rate of horizontal propagation is independent of distribution for a fixed release, found earlier in § 3.1. This variation is illustrated by the inset of figure 10(a), which shows an enlargement of the frontal positions. We see that the case
$n$
, contrasting with the result that the rate of horizontal propagation is independent of distribution for a fixed release, found earlier in § 3.1. This variation is illustrated by the inset of figure 10(a), which shows an enlargement of the frontal positions. We see that the case
 $n=\infty$
maximizes the value of
$n=\infty$
maximizes the value of
 ${\it\xi}_{N}$
and hence the rate of horizontal propagation. Possible variation in
${\it\xi}_{N}$
and hence the rate of horizontal propagation. Possible variation in
 ${\it\xi}_{N}$
is remarkably small, with a difference of just 3 % between the cases
${\it\xi}_{N}$
is remarkably small, with a difference of just 3 % between the cases
 $n=\infty$
and
$n=\infty$
and
 $n=0.1$
. (Calculations for a selection of distributions not of the power-law form (4.11) were also found to lie within this range of
$n=0.1$
. (Calculations for a selection of distributions not of the power-law form (4.11) were also found to lie within this range of
 ${\it\xi}_{N}$
.) The conclusion that horizontal propagation is independent of distribution thus holds to good approximation, if not exactly, for the case of a continuous input.
${\it\xi}_{N}$
.) The conclusion that horizontal propagation is independent of distribution thus holds to good approximation, if not exactly, for the case of a continuous input.

Figure 12. Cross-sectional schematic of our experimental Hele-Shaw cell.
5 Experimental study
We conducted a laboratory experiment to compare with our theoretical predictions in the case of a constant-volume release. This was performed in a Hele-Shaw cell made of two polycarbonate sheets of length
 $100~$
cm and height
$100~$
cm and height
 $50~$
cm, forming a porous medium of porosity
$50~$
cm, forming a porous medium of porosity
 ${\it\phi}=1$
and permeability
${\it\phi}=1$
and permeability
 $k=b^{2}/12=7.8\times 10^{-4}~\text{cm}^{2}$
, where
$k=b^{2}/12=7.8\times 10^{-4}~\text{cm}^{2}$
, where
 $b\approx 0.097~$
cm is the gap width (see figure 12). As working fluids, we used fresh water of density
$b\approx 0.097~$
cm is the gap width (see figure 12). As working fluids, we used fresh water of density
 ${\it\rho}_{0}\approx 0.999~$
g
${\it\rho}_{0}\approx 0.999~$
g
 $~$
cm
$~$
cm
 $^{-3}$
, dyed using blue food colouring to a concentration of 4 vol%, and slightly salty water (saline) of density
$^{-3}$
, dyed using blue food colouring to a concentration of 4 vol%, and slightly salty water (saline) of density
 ${\it\rho}_{a}\approx 1.023~$
g
${\it\rho}_{a}\approx 1.023~$
g
 $~$
cm
$~$
cm
 $^{-3}$
, creating a maximum density difference of
$^{-3}$
, creating a maximum density difference of
 ${\rm\Delta}{\it\rho}\equiv {\it\rho}_{a}-{\it\rho}_{0}=0.024~$
g
${\rm\Delta}{\it\rho}\equiv {\it\rho}_{a}-{\it\rho}_{0}=0.024~$
g
 $~$
cm
$~$
cm
 $^{-3}$
. The densities were measured using an oscillating U-tube densitometer to an accuracy of within
$^{-3}$
. The densities were measured using an oscillating U-tube densitometer to an accuracy of within
 $10^{-5}~$
g
$10^{-5}~$
g
 $~$
cm
$~$
cm
 $^{-3}$
. The viscosity of the dyed water and saline were measured as
$^{-3}$
. The viscosity of the dyed water and saline were measured as
 ${\it\mu}=0.998\times 10^{-2}~$
P and
${\it\mu}=0.998\times 10^{-2}~$
P and
 ${\it\mu}_{a}=1.045\times 10^{-2}~$
P using a U-tube viscometer, and thus equal to within 5 %. The current was prepared from an equal mixture of fresh water and saline (see below) and hence the mean value
${\it\mu}_{a}=1.045\times 10^{-2}~$
P using a U-tube viscometer, and thus equal to within 5 %. The current was prepared from an equal mixture of fresh water and saline (see below) and hence the mean value
 $\bar{{\it\mu}}=1.022\times 10^{-2}~$
P was taken as the representative viscosity of the current.
$\bar{{\it\mu}}=1.022\times 10^{-2}~$
P was taken as the representative viscosity of the current.
To initialize a release of fluid, we formed a lock of horizontal length
 $10~$
cm between the left-hand edge of the cell and a thin strip of polycarbonate (the gate). The rest of the cell was filled with the clear saline solution. A series of eight layers of piecewise-uniform density were used to form the current behind the gate (
$10~$
cm between the left-hand edge of the cell and a thin strip of polycarbonate (the gate). The rest of the cell was filled with the clear saline solution. A series of eight layers of piecewise-uniform density were used to form the current behind the gate (
 $N=8$
), varying linearly in composition from the dyed fresh water to the clear saline solution. Beginning with the heaviest, the mixtures were injected sequentially behind the gate using a micropipette connected to a needle. This created the floating stratified fluid layer shown schematically in figure 12 and in the photograph of figure 13(a). With
$N=8$
), varying linearly in composition from the dyed fresh water to the clear saline solution. Beginning with the heaviest, the mixtures were injected sequentially behind the gate using a micropipette connected to a needle. This created the floating stratified fluid layer shown schematically in figure 12 and in the photograph of figure 13(a). With
 $V_{i}=V_{L}=10~$
cm representing the volume per unit width of each layer, and assuming an approximately linear relationship between composition and density,
$V_{i}=V_{L}=10~$
cm representing the volume per unit width of each layer, and assuming an approximately linear relationship between composition and density,
 $c_{i}=i/N$
, the total relative mass per unit width of the current was evaluated as
$c_{i}=i/N$
, the total relative mass per unit width of the current was evaluated as
 $$\begin{eqnarray}\displaystyle M_{0} & = & \displaystyle \mathop{\sum }_{i=1}^{N}c_{i}V_{i}{\rm\Delta}{\it\rho}={\rm\Delta}{\it\rho}V_{L}\mathop{\sum }_{i=1}^{N}\frac{i}{N}\end{eqnarray}$$
 $$\begin{eqnarray}\displaystyle & = & \displaystyle \frac{1}{2}(N+1){\rm\Delta}{\it\rho}V_{L}\approx 1.08~\text{g}~\text{cm}^{-1}.\end{eqnarray}$$
The experiment was initiated by removal of the gate, which released the region of buoyant stratified fluid. The buoyant current flowed along the top surface of the ambient fluid, differing slightly from the situation of a current flowing along a rigid boundary assumed in our theoretical development. By making the minor alteration of replacing the reduced gravity
 ${\rm\Delta}{\it\rho}g/{\it\rho}_{0}$
with the reduced gravity relevant to a floating fluid layer
${\rm\Delta}{\it\rho}g/{\it\rho}_{0}$
with the reduced gravity relevant to a floating fluid layer
 ${\rm\Delta}{\it\rho}g/{\it\rho}_{a}$
(e.g. Pegler et al.
Reference Pegler, Kowal, Hasenclever and Worster2013b
), the relevant value of
${\rm\Delta}{\it\rho}g/{\it\rho}_{a}$
(e.g. Pegler et al.
Reference Pegler, Kowal, Hasenclever and Worster2013b
), the relevant value of
 $U$
is found to be
$U$
is found to be
 $$\begin{eqnarray}U\equiv {\it\rho}_{0}\left(\frac{{\rm\Delta}{\it\rho}}{{\it\rho}_{a}}g\right)\frac{k}{{\it\mu}}\approx 1.80~\text{cm}~\text{s}^{-1},\end{eqnarray}$$
where the factor in parentheses represents the replaced form of the reduced gravity.

Figure 13. Photographs showing the evolution of the experiment from (a) its initial state, (b) after 50 s and (c) after 500 s.
A sequence of three recorded photographs is shown in figure 13 (the full sequence forms supplementary movie 1 available at http://dx.doi.org/10.1017/jfm.2015.733). The measured experimental frontal position is compared with the theoretical prediction (3.3), given dimensionally by
 $$\begin{eqnarray}x_{N}(t)=\left(9\mathscr{V}Ut\right)^{1/3}\quad \text{where }\mathscr{V}\equiv \frac{M_{0}}{{\rm\Delta}{\it\rho}}\approx 45~\text{cm}^{2},\end{eqnarray}$$
in figure 14. A comparison between the vertical thickness of the current, obtained by digitally detecting the outline of the current in the photographs, and the theoretical prediction of (3.15) with
 $n=1$
is shown in figure 15. There is generally excellent agreement with the data. From the images, it is evident that the isopycnals sustain a horizontal alignment, which is consistent with the prediction from § 3. The profiles are seen to approach the similarity solution gradually over time. The region of least buoyant fluid at the back of the current is observed to approach the similarity solution more gradually than elsewhere. The experimental frontal position
$n=1$
is shown in figure 15. There is generally excellent agreement with the data. From the images, it is evident that the isopycnals sustain a horizontal alignment, which is consistent with the prediction from § 3. The profiles are seen to approach the similarity solution gradually over time. The region of least buoyant fluid at the back of the current is observed to approach the similarity solution more gradually than elsewhere. The experimental frontal position
 $x_{N}$
initially lies ahead of the theoretical prediction because the current is released from an advanced state of finite horizontal length
$x_{N}$
initially lies ahead of the theoretical prediction because the current is released from an advanced state of finite horizontal length
 $x_{N}(0)=10~$
cm, while the time origin of the similarity solution (5.4) has the front of the current starting at the left wall (
$x_{N}(0)=10~$
cm, while the time origin of the similarity solution (5.4) has the front of the current starting at the left wall (
 $x_{N}(0)=0$
). Based on the data of figure 14, the transition to the self-similar regime occurs over a time scale of approximately 10 s. The experimental flow front lies slightly less advanced than predicted by the theory. This may be attributed to the viscous drag caused by vertical shear between the current and the ambient fluid, which is neglected in our idealized theory. The need to drive a large-scale return flow of the ambient fluid underneath the current may have further contributed to the slight reduction in frontal speed compared to the prediction.
$x_{N}(0)=0$
). Based on the data of figure 14, the transition to the self-similar regime occurs over a time scale of approximately 10 s. The experimental flow front lies slightly less advanced than predicted by the theory. This may be attributed to the viscous drag caused by vertical shear between the current and the ambient fluid, which is neglected in our idealized theory. The need to drive a large-scale return flow of the ambient fluid underneath the current may have further contributed to the slight reduction in frontal speed compared to the prediction.

Figure 14. Comparison between the measured frontal positions (black circles) and the theoretically predicted position (line) given by (5.4) on a log–log scale.

Figure 15. Comparison between the experimental thickness profile
 $H(x,t)$
(solid curves) and the theoretical prediction (dashed curve), plotted in terms of the similarity variables defined by (3.3) and (3.4). The experimental thickness
$H(x,t)$
(solid curves) and the theoretical prediction (dashed curve), plotted in terms of the similarity variables defined by (3.3) and (3.4). The experimental thickness
 $H(x,t)$
was measured by digitally detecting the outline of the current from the experimental photographs. The theoretical prediction (dashed) is given by (3.15) with
$H(x,t)$
was measured by digitally detecting the outline of the current from the experimental photographs. The theoretical prediction (dashed) is given by (3.15) with
 $n=1$
. No fitting parameters are used.
$n=1$
. No fitting parameters are used.
6 Discussion
An application of the fluid mechanical regime considered in this paper relates to gravity currents fed from a source of convective plumes. Recent interest in this problem has been generated by the process of geological CO2 storage, in which the convection of dissolved CO2 produces a dense gravity current of CO2–water solution propagating along the base of an aquifer (MacMinn et al. Reference MacMinn, Neufeld, Hesse and Huppert2012; Szulczewski et al. Reference Szulczewski, Hesse and Juanes2013). Gravity currents fed by localized vertical plumes also arise during processes of horizontal convection, which to date have focused primarily on the diffusion-dominated final states that arise at long times in a confined cavity (e.g. Daniels & Punpocha Reference Daniels and Punpocha2005). In these situations, diffusion may be locally significant in regions of vertical convection but less significant, or negligible, in regions of stably stratified horizontal flow.
To explore the situations for which a regime of purely advective gravity-driven flow arises, let us include diffusion in the density evolution equation (2.2),
 $$\begin{eqnarray}\frac{\partial {\it\rho}}{\partial t}+\boldsymbol{u}\boldsymbol{\cdot }\boldsymbol{{\rm\nabla}}{\it\rho}=D\frac{\partial ^{2}{\it\rho}}{\partial z^{2}},\end{eqnarray}$$
where
 $D$
is the effective molecular diffusivity of the species producing density changes (e.g. salt or CO2) and we have neglected horizontal diffusion on account of the vertical scale being assumed much smaller than the horizontal. In simple terms, diffusion intervenes only once the vertical scale of the current
$D$
is the effective molecular diffusivity of the species producing density changes (e.g. salt or CO2) and we have neglected horizontal diffusion on account of the vertical scale being assumed much smaller than the horizontal. In simple terms, diffusion intervenes only once the vertical scale of the current
 $h$
becomes comparable to the diffusive length scale
$h$
becomes comparable to the diffusive length scale
 $z\sim (Dt)^{1/2}$
that arises from a scaling analysis of (6.1). To explore this transition in the context of our similarity solutions, we recast (6.1) in terms of the similarity variables relevant to a finite release (3.2) or those relevant to a continuous release (4.8), to obtain (in either case),
$z\sim (Dt)^{1/2}$
that arises from a scaling analysis of (6.1). To explore this transition in the context of our similarity solutions, we recast (6.1) in terms of the similarity variables relevant to a finite release (3.2) or those relevant to a continuous release (4.8), to obtain (in either case),
 $$\begin{eqnarray}\displaystyle \boldsymbol{s}\boldsymbol{\cdot }\boldsymbol{{\rm\nabla}}_{\boldsymbol{{\it\xi}}}c=[Pe(t)]^{-1}\frac{\partial ^{2}c}{\partial {\it\zeta}^{2}},\quad \text{where }Pe(t)=\frac{\hslash (t)^{2}}{Dt} & & \displaystyle\end{eqnarray}$$
can be interpreted as a time-dependent Péclet number,
 $\boldsymbol{s}\boldsymbol{\cdot }\boldsymbol{{\rm\nabla}}_{\boldsymbol{{\it\xi}}}\equiv t\,\boldsymbol{u}\boldsymbol{\cdot }\boldsymbol{{\rm\nabla}}$
is the similarity form of the advective derivative and
$\boldsymbol{s}\boldsymbol{\cdot }\boldsymbol{{\rm\nabla}}_{\boldsymbol{{\it\xi}}}\equiv t\,\boldsymbol{u}\boldsymbol{\cdot }\boldsymbol{{\rm\nabla}}$
is the similarity form of the advective derivative and
 $\hslash (t)\equiv h(x_{N}/2,t)$
is a representative height of the current. The Péclet number
$\hslash (t)\equiv h(x_{N}/2,t)$
is a representative height of the current. The Péclet number
 $Pe(t)$
measures the ratio of advective transport to diffusive transport, with the solutions obtained in this paper applicable only while
$Pe(t)$
measures the ratio of advective transport to diffusive transport, with the solutions obtained in this paper applicable only while
 $Pe(t)\gg 1$
. A characteristic time on which diffusion intervenes
$Pe(t)\gg 1$
. A characteristic time on which diffusion intervenes
 ${\it\tau}$
can be defined by
${\it\tau}$
can be defined by
 $Pe({\it\tau})=1$
, resulting in the implicit equation
$Pe({\it\tau})=1$
, resulting in the implicit equation
 $$\begin{eqnarray}D{\it\tau}=\hslash ({\it\tau})^{2}.\end{eqnarray}$$
Using the similarity solutions given by (3.2) and (4.8) to evaluate
 $\hslash$
in (6.2b
) and (6.3), we obtain the expressions for the Péclet numbers and diffusion time scales,
$\hslash$
in (6.2b
) and (6.3), we obtain the expressions for the Péclet numbers and diffusion time scales,
 $$\begin{eqnarray}\displaystyle \displaystyle Pe(t) & = & \displaystyle \frac{1}{D}\left(\frac{\mathscr{V}^{2}}{{\it\phi}^{2}U}\right)^{2/3}t^{-5/3},\quad \displaystyle {\it\tau}=\left[\frac{1}{D}\left(\frac{\mathscr{V}^{2}}{{\it\phi}^{2}U}\right)^{2/3}\right]^{3/5}\text{ (finite release)},\qquad\end{eqnarray}$$
 $$\begin{eqnarray}\displaystyle \displaystyle Pe(t) & = & \displaystyle \frac{1}{D}\left(\frac{\mathscr{Q}^{2}}{{\it\phi}^{2}U}\right)^{2/3}t^{-1/3},\quad \displaystyle {\it\tau}=\left[\frac{1}{D}\left(\frac{\mathscr{Q}^{2}}{{\it\phi}^{2}U}\right)^{2/3}\right]^{3}\text{ (continuous release)},\qquad\end{eqnarray}$$
 $Pe(t)\rightarrow 0$
with time, implying that diffusion is initially irrelevant but becomes important once
$Pe(t)\rightarrow 0$
with time, implying that diffusion is initially irrelevant but becomes important once
 $t\gtrsim {\it\tau}$
. Note that the temporal exponent of time
$t\gtrsim {\it\tau}$
. Note that the temporal exponent of time
 $t$
in
$t$
in
 $Pe(t)$
is five times larger in the case of a continuous release than in the case of a finite release. This reflects the fact that, with a finite release, the decrease in vertical extent of the current over time (
$Pe(t)$
is five times larger in the case of a continuous release than in the case of a finite release. This reflects the fact that, with a finite release, the decrease in vertical extent of the current over time (
 $\hslash \sim t^{-1/3}$
) increases the vertical density gradients that drive diffusion. By contrast, the increase in vertical scale (
$\hslash \sim t^{-1/3}$
) increases the vertical density gradients that drive diffusion. By contrast, the increase in vertical scale (
 $\hslash \sim t^{1/3}$
) for the case of a continuous input significantly decreases the vertical gradients in concentration that drive diffusion.
$\hslash \sim t^{1/3}$
) for the case of a continuous input significantly decreases the vertical gradients in concentration that drive diffusion.
To illustrate the significant differences in time scales on which diffusion can arise physically, we evaluate
 ${\it\tau}$
for values representative of our laboratory set-up. With reference to § 5, we set the velocity
${\it\tau}$
for values representative of our laboratory set-up. With reference to § 5, we set the velocity
 $U=1.8~$
cm s
$U=1.8~$
cm s
 $^{-1}$
, effective volume
$^{-1}$
, effective volume
 $\mathscr{V}=45~$
cm
$\mathscr{V}=45~$
cm
 $^{2}$
, and porosity
$^{2}$
, and porosity
 ${\it\phi}=1$
. We also choose the characteristic diffusivity
${\it\phi}=1$
. We also choose the characteristic diffusivity
 $D=10^{-6}~$
cm
$D=10^{-6}~$
cm
 $^{2}$
s
$^{2}$
s
 $^{-1}$
. Using these values, (6.4a
) yields the time scale
$^{-1}$
. Using these values, (6.4a
) yields the time scale
 ${\it\tau}=18~$
h. This is significantly greater than the running time of our experiment (
${\it\tau}=18~$
h. This is significantly greater than the running time of our experiment (
 ${\it\tau}\gg 500$
s), confirming that diffusion was negligible. For a hypothetical experiment involving a continuous input, we use an illustrative effective volume flux per unit width
${\it\tau}\gg 500$
s), confirming that diffusion was negligible. For a hypothetical experiment involving a continuous input, we use an illustrative effective volume flux per unit width
 $\mathscr{Q}=1~$
cm
$\mathscr{Q}=1~$
cm
 $^{2}$
s
$^{2}$
s
 $^{-1}$
. The time scale given by (6.4b
) is found to be
$^{-1}$
. The time scale given by (6.4b
) is found to be
 ${\it\tau}=10^{10}$
yr. The reduction in vertical concentration gradients arising from vertical growth of the current therefore significantly delay the onset of diffusion.
${\it\tau}=10^{10}$
yr. The reduction in vertical concentration gradients arising from vertical growth of the current therefore significantly delay the onset of diffusion.
We now consider the migration of dissolved CO2 through porous rock. Using the parameter settings suggested by Szulczewski et al. (Reference Szulczewski, Hesse and Juanes2013), we set
 ${\rm\Delta}{\it\rho}=10~$
kg
${\rm\Delta}{\it\rho}=10~$
kg
 $~$
m
$~$
m
 $^{-3}$
,
$^{-3}$
,
 ${\it\mu}=10^{-3}\,$
Pa s and allow for a range of permeabilities
${\it\mu}=10^{-3}\,$
Pa s and allow for a range of permeabilities
 $k=10^{-14}$
–
$k=10^{-14}$
–
 $10^{-12}~$
m
$10^{-12}~$
m
 $^{2}$
to accommodate different aquifers. With these values, the speed scale
$^{2}$
to accommodate different aquifers. With these values, the speed scale
 $U={\rm\Delta}{\it\rho}gk/{\it\phi}{\it\mu}=10^{-9}$
–
$U={\rm\Delta}{\it\rho}gk/{\it\phi}{\it\mu}=10^{-9}$
–
 $10^{-7}~$
m s
$10^{-7}~$
m s
 $^{-1}$
. To estimate the total relative mass flux
$^{-1}$
. To estimate the total relative mass flux
 $J_{0}$
feeding the gravity current from downwelling plumes, we evaluate the relative mass flux per unit width for a convective boundary of length
$J_{0}$
feeding the gravity current from downwelling plumes, we evaluate the relative mass flux per unit width for a convective boundary of length
 $L$
using
$L$
using
 $$\begin{eqnarray}J_{0}=0.017\,rUL\approx 10^{-4}{-}10^{-2}~\text{kg}~\text{s}^{-1}~\text{m}^{-1}\end{eqnarray}$$
(see (3.2) of Szulczewski et al.
Reference Szulczewski, Hesse and Juanes2013), where
 $r=50~$
kg
$r=50~$
kg
 $~$
m
$~$
m
 $^{-3}$
is the mass concentration of CO2 in fully saturated water and
$^{-3}$
is the mass concentration of CO2 in fully saturated water and
 $L=20~$
km is a representative horizontal length of a region of trapped CO2. The corresponding scale of volumetric input
$L=20~$
km is a representative horizontal length of a region of trapped CO2. The corresponding scale of volumetric input
 $\mathscr{Q}=J_{0}/{\rm\Delta}{\it\rho}=10^{-5}{-}10^{-3}~\text{m}^{2}~\text{s}^{-1}$
. A characteristic effective diffusivity, based on an approximation of negligible dispersion, is
$\mathscr{Q}=J_{0}/{\rm\Delta}{\it\rho}=10^{-5}{-}10^{-3}~\text{m}^{2}~\text{s}^{-1}$
. A characteristic effective diffusivity, based on an approximation of negligible dispersion, is
 $D\approx 10^{-9}~$
m
$D\approx 10^{-9}~$
m
 $^{2}~$
s
$^{2}~$
s
 $^{-1}$
(Szulczewski & Juanes Reference Szulczewski and Juanes2013). With these estimates, the diffusion time scale given by (6.4b
) is
$^{-1}$
(Szulczewski & Juanes Reference Szulczewski and Juanes2013). With these estimates, the diffusion time scale given by (6.4b
) is
 ${\it\tau}=10^{18}$
–
${\it\tau}=10^{18}$
–
 $10^{22}$
yr. This estimate indicates that molecular diffusion is essentially negligible in this context.
$10^{22}$
yr. This estimate indicates that molecular diffusion is essentially negligible in this context.
The calculation of
 ${\it\tau}$
above assumes that the current continues to be fed at the rate (6.5) and is unconstrained to accumulate vertically. In reality, aquifers have a finite depth
${\it\tau}$
above assumes that the current continues to be fed at the rate (6.5) and is unconstrained to accumulate vertically. In reality, aquifers have a finite depth
 $\mathscr{H}$
. As demonstrated by the simulations of Szulczewski et al. (Reference Szulczewski, Hesse and Juanes2013), vertical accumulation of the gravity current below the convection zone reduces (or partially shuts down) the rate of convection from the maximum value (6.5) to a residual that simply keeps the depth of the gravity current under the convection zone approximately equal to that of the aquifer
$\mathscr{H}$
. As demonstrated by the simulations of Szulczewski et al. (Reference Szulczewski, Hesse and Juanes2013), vertical accumulation of the gravity current below the convection zone reduces (or partially shuts down) the rate of convection from the maximum value (6.5) to a residual that simply keeps the depth of the gravity current under the convection zone approximately equal to that of the aquifer
 $h(0,t)\approx \mathscr{H}$
. Fixing the depth of the current at a constant is equivalent to the imposition of an input flux that decays asymptotically as
$h(0,t)\approx \mathscr{H}$
. Fixing the depth of the current at a constant is equivalent to the imposition of an input flux that decays asymptotically as
 $t^{-1/2}$
, which is an intermediate situation to the cases of a finite and continuous release on which we have focused thus far. With
$t^{-1/2}$
, which is an intermediate situation to the cases of a finite and continuous release on which we have focused thus far. With
 $\hslash \sim \mathscr{H}$
, the relevant forms of the Péclet number (6.2b
) and diffusion time scale (6.3) are given by
$\hslash \sim \mathscr{H}$
, the relevant forms of the Péclet number (6.2b
) and diffusion time scale (6.3) are given by
 $$\begin{eqnarray}\displaystyle Pe(t)=\frac{\mathscr{H}^{2}}{Dt}\qquad {\it\tau}=\frac{\mathscr{H}^{2}}{D}. & & \displaystyle\end{eqnarray}$$
Notably, these expressions are completely independent of any parameters associated with both the dynamics of the current and those of the convection zone. Equation (6.6a
) implies that
 $Pe(t)$
decreases with the reciprocal of time, consistent with it being intermediate to the two cases in (6.4). Given illustrative aquifer thicknesses of 20–
$Pe(t)$
decreases with the reciprocal of time, consistent with it being intermediate to the two cases in (6.4). Given illustrative aquifer thicknesses of 20–
 $200~$
m, we obtain
$200~$
m, we obtain
 ${\it\tau}=10^{4}$
–
${\it\tau}=10^{4}$
–
 $10^{6}~$
yr. These time scales are consistent with the transition times indicated by the simulations of Szulczewski et al. (Reference Szulczewski, Hesse and Juanes2013). The regime of an advective gravity current of the kind considered in this paper is therefore likely to represent the dominant regime of flow for dissolved CO2 on time scales of thousands to hundreds of thousands of years.
$10^{6}~$
yr. These time scales are consistent with the transition times indicated by the simulations of Szulczewski et al. (Reference Szulczewski, Hesse and Juanes2013). The regime of an advective gravity current of the kind considered in this paper is therefore likely to represent the dominant regime of flow for dissolved CO2 on time scales of thousands to hundreds of thousands of years.
7 Conclusions
We have explored the dynamics of gravity currents containing a stably stratified density field controlled by advection. A variable-density field was found to introduce new dynamical considerations to the flow of gravity currents. Generally, distributing the mass of a gravity current into a stratification significantly alters its vertical shape and structure but, with the total mass fixed, has little to no effect on its overall rate of horizontal propagation.
The evolution of a continuously stratified gravity current was found to depend explicitly on the details of its two-dimensional density field, contrasting with the one-dimensional depth-integrated equations that can be used to describe uniform-density gravity currents. A numerical approach for solving continuously stratified gravity currents was developed based on discretizing the current into a large set of isopycnal layers. With a finite release of dense fluid, similarity solutions were obtained, showing that the density distribution can change the profile from a convex shape for concentrated distributions, familiar from studies of uniform-density currents, to a concave shape for more diffuse distributions. All isopycnal surfaces were found to form perfectly horizontal stratifications. Analytical solutions resulting from this simplification were used to validate our numerical predictions, as well as to classify the possible shapes of the current in terms of the density distribution. Remarkably, despite significant effects on vertical structure, the distribution of the density field has no effect whatsoever on the horizontal extent of the current.
The flow resulting from a continuous input at a constant rate was found to exhibit several qualitative differences compared to a finite release. One is that the isopycnal surfaces slope downwards in the direction of the flow, a property which creates internal variations in the horizontal gradient in hydrostatic pressure that drives the flow. In contrast to a fixed release, as well as all gravity currents of uniform density in porous media, the horizontal velocity was found to depend on vertical position. Another difference is that the density distribution has some, if slight, control of the rate of horizontal propagation.
The predictions compared well with data from a laboratory experiment involving the lock release of a region of linearly stratified fluid into a uniform ambient fluid. Digital extraction of the thickness profiles of the current over time showed that the region of lightest fluid retains its initial shape for longer. The rate of approach towards the self-similar mode of propagation therefore varies spatially along the length of the current.
Parameter estimates indicate that a regime of purely advective gravity-driven flow is likely to dominate the dynamics of dissolved CO2 in saline aquifers for up to thousands to tens of thousands of years after the initiation of geological carbon storage. Regimes of the kind explored here may therefore play an important role in understanding how CO2-saturated water is mobilized in underground aquifers. This may be a central consideration because, as indicated by recent numerical simulations, the rate at which CO2 dissolves can be controlled entirely by the rate at which the gravity current of CO2–water flows from the region of convection.
Acknowledgements
This work was partially supported by the PANACEA project funded by the European Commission. The research of J.A.N. is supported by a Royal Society University Research Fellowship. H.E.H. is partially supported by a Wolfson Royal Society merit award and a Leverhulme Emeritus Fellowship. We are grateful to the technicians of the DAMTP laboratory workshop for assistance in the preparation of our laboratory apparatus.
Supplementary movie
A supplementary movie is available at http://dx.doi.org/10.1017/jfm.2015.733.
Appendix A. Interfacial evolution derived from density advection
This appendix confirms that (2.10) follows from (2.9). The outline of the current generally separates its interior from the ambient at a step in density. To separate contributions to (2.9) due to the step from those due to the smooth variation of density in the interior, we write
 $$\begin{eqnarray}c(\boldsymbol{x},t)\equiv {\it\Theta}[z-h(x,t)]\tilde{c}(\boldsymbol{x},t),\end{eqnarray}$$
where
 ${\it\Theta}$
is the unit step function and
${\it\Theta}$
is the unit step function and
 $\tilde{c}(\boldsymbol{x},t)$
is a smooth field equal to
$\tilde{c}(\boldsymbol{x},t)$
is a smooth field equal to
 $c$
in the interior of the current. Substituting (A 1) into (2.9) and simplifying, we obtain
$c$
in the interior of the current. Substituting (A 1) into (2.9) and simplifying, we obtain
 $$\begin{eqnarray}{\it\delta}(z-h)\left[{\it\phi}\frac{\partial h}{\partial t}+u\frac{\partial h}{\partial x}-w\right]+{\it\Theta}(z-h)\left[{\it\phi}\frac{\partial \tilde{c}}{\partial t}+u\frac{\partial \tilde{c}}{\partial x}+w\frac{\partial \tilde{c}}{\partial z}\right]=0,\end{eqnarray}$$
where
 ${\it\delta}$
is the Dirac delta function. Integrating (A 2) over the depth of the fluid domain
${\it\delta}$
is the Dirac delta function. Integrating (A 2) over the depth of the fluid domain
 $0\leqslant z\leqslant \mathscr{H}$
, noting that (2.9) implies that the second term vanishes for
$0\leqslant z\leqslant \mathscr{H}$
, noting that (2.9) implies that the second term vanishes for
 $z\leqslant h$
and using the sampling property of the
$z\leqslant h$
and using the sampling property of the
 ${\it\delta}$
function, we obtain (2.10).
${\it\delta}$
function, we obtain (2.10).
Appendix B. Evolution of an isopycnal layer front
This appendix derives the evolution equation for the layer fronts (2.28) from the frontal conditions (2.27). Differentiating (2.27a
) with respect to
 $t$
, rearranging for
$t$
, rearranging for
 ${\dot{x}}_{i}$
and using (2.25) to substitute for
${\dot{x}}_{i}$
and using (2.25) to substitute for
 $\partial H_{i}/\partial t$
in favour of the flux gradient
$\partial H_{i}/\partial t$
in favour of the flux gradient
 $\partial q_{i}/\partial x$
, we obtain
$\partial q_{i}/\partial x$
, we obtain
 $$\begin{eqnarray}{\dot{x}}_{i}=-\frac{\partial H_{i}/\partial t}{\partial H_{i}/\partial x}=\frac{\partial q_{i}/\partial x}{\partial H_{i}/\partial x}=\lim _{x\rightarrow x_{i}}\left(\frac{q_{i}}{H_{i}}\right)=u_{i},\end{eqnarray}$$
where all quantities are evaluated at
 $x=x_{i}(t)$
. The third equality follows from l’Hôpital’s rule, which is applicable because the flux
$x=x_{i}(t)$
. The third equality follows from l’Hôpital’s rule, which is applicable because the flux
 $q_{i}$
and thickness
$q_{i}$
and thickness
 $H_{i}$
both vanish in the limit
$H_{i}$
both vanish in the limit
 $x\rightarrow x_{i}$
in accord with (2.27a,b
).
$x\rightarrow x_{i}$
in accord with (2.27a,b
).
Appendix C. Numerical solution of the discretized equations
This appendix details the numerical method used to solve the similarity equations associated with a discrete distribution. We begin by choosing a suitably dense distribution of discrete densities
 $c_{i}$
ranging from
$c_{i}$
ranging from
 $0$
to
$0$
to
 $1$
(about one hundred values were used). In the case of a finite-volume release, the equations describing a discrete distribution are given by (2.26)–(3.6). In obtaining similarity solutions, we specify the individual volumes of each isopycnal layer (3.7) as constants
$1$
(about one hundred values were used). In the case of a finite-volume release, the equations describing a discrete distribution are given by (2.26)–(3.6). In obtaining similarity solutions, we specify the individual volumes of each isopycnal layer (3.7) as constants
 $V_{i}$
.
$V_{i}$
.
With reference to (3.2), we define the similarity forms of the isopycnal layer thicknesses
 $F_{i}$
by
$F_{i}$
by
 $H_{i}=(\mathscr{V}^{2}/{\it\phi}U)^{1/3}t^{-1/3}F_{i}({\it\xi})$
. When recast in terms of the similarity variable
$H_{i}=(\mathscr{V}^{2}/{\it\phi}U)^{1/3}t^{-1/3}F_{i}({\it\xi})$
. When recast in terms of the similarity variable
 ${\it\xi}$
given by (3.2) and
${\it\xi}$
given by (3.2) and
 $F_{i}({\it\xi})$
, the governing discretized equations (2.26) become
$F_{i}({\it\xi})$
, the governing discretized equations (2.26) become
 $$\begin{eqnarray}-\frac{1}{3}({\it\xi}F_{i})^{\prime }=\left(F_{i}\mathop{\sum }_{k=1}^{N}c_{ik}F_{k}^{\prime }\right)^{\hspace{-2.0pt}\prime }.\end{eqnarray}$$
The boundary conditions (2.27b ), (2.28) and volume constraint (2.29) become
 $$\begin{eqnarray}\displaystyle F_{i}({\it\xi}_{i})=0,\quad c_{i}F_{i}^{\prime }({\it\xi}_{i})=-\frac{1}{3}{\it\xi}_{i},\quad \int _{0}^{{\it\xi}_{i}}F_{i}\;\text{d}{\it\xi}=\hat{V}_{i}, & & \displaystyle\end{eqnarray}$$
where
 $\hat{V}_{i}\equiv V_{i}/\mathscr{V}$
is the dimensionless volume per unit width assigned to each layer. Our numerical method was designed to yield a discretized solution to a continuously specified distribution function. To accurately match the mass–density function arising from the discretization
$\hat{V}_{i}\equiv V_{i}/\mathscr{V}$
is the dimensionless volume per unit width assigned to each layer. Our numerical method was designed to yield a discretized solution to a continuously specified distribution function. To accurately match the mass–density function arising from the discretization
 $M_{D}(c)$
to the exact version
$M_{D}(c)$
to the exact version
 $M(c)$
specified by (3.6), we prescribed the volume
$M(c)$
specified by (3.6), we prescribed the volume
 $\hat{V}_{i}$
of each layer using
$\hat{V}_{i}$
of each layer using
 $$\begin{eqnarray}\displaystyle \hat{V}_{i}=\hat{V}[{\textstyle \frac{1}{2}}(c_{i}+c_{i+1})]-\hat{V}[{\textstyle \frac{1}{2}}(c_{i-1}+c_{i})]. & & \displaystyle\end{eqnarray}$$
The comparison between the discretized cumulative volume–density function
 $\hat{V}_{D}(c)$
(black) resulting from (C 3) and the exact continuous version
$\hat{V}_{D}(c)$
(black) resulting from (C 3) and the exact continuous version
 $\hat{V}(c)$
(blue) are illustrated for an example distribution in figure 16. By conducting Taylor expansions of the two terms on the right-hand side of (C 3) in the limit of small density steps
$\hat{V}(c)$
(blue) are illustrated for an example distribution in figure 16. By conducting Taylor expansions of the two terms on the right-hand side of (C 3) in the limit of small density steps
 ${\rm\Delta}c\equiv c_{i}-c_{c-1}$
, it is confirmed that the total mass implied by the discretized form of the mass–density function satisfies
${\rm\Delta}c\equiv c_{i}-c_{c-1}$
, it is confirmed that the total mass implied by the discretized form of the mass–density function satisfies
 $$\begin{eqnarray}\hat{M}_{D}(1)\equiv \mathop{\sum }_{1}^{N}c_{i}\hat{V}_{i}=1+O({\rm\Delta}c^{2})\end{eqnarray}$$
and is therefore equal to the total dimensionless mass
 $\hat{M}(1)=1$
to second-order accuracy in the density step
$\hat{M}(1)=1$
to second-order accuracy in the density step
 ${\rm\Delta}c$
.
${\rm\Delta}c$
.

Figure 16. An illustrative cumulative mass–density function
 $\hat{M}(c)$
and its discretized form
$\hat{M}(c)$
and its discretized form
 $\hat{M}_{D}(c)$
, resulting from the specification of volumes per layer
$\hat{M}_{D}(c)$
, resulting from the specification of volumes per layer
 $\hat{V}_{i}$
using (C 3). The plot illustrates how the centralization of the steps in density on mid-values between consecutive density steps
$\hat{V}_{i}$
using (C 3). The plot illustrates how the centralization of the steps in density on mid-values between consecutive density steps
 $c_{i}$
, produce residuals between
$c_{i}$
, produce residuals between
 $\hat{M}(c)$
and
$\hat{M}(c)$
and
 $\hat{M}_{D}(c)$
of
$\hat{M}_{D}(c)$
of
 $O({\rm\Delta}c_{i})$
, where
$O({\rm\Delta}c_{i})$
, where
 ${\rm\Delta}c_{i}=c_{i+1}-c_{i}$
is the difference between consecutive densities.
${\rm\Delta}c_{i}=c_{i+1}-c_{i}$
is the difference between consecutive densities.
Equations (C 1) and (C 2) form a system of ordinary differential equations, which can be solved for the thickness profiles
 $F_{i}({\it\xi})$
and frontal positions
$F_{i}({\it\xi})$
and frontal positions
 ${\it\xi}_{i}$
. To accommodate the fact that the frontal positions
${\it\xi}_{i}$
. To accommodate the fact that the frontal positions
 ${\it\xi}_{i}$
must be determined as part of the solution, we used a Newton–Raphson iteration scheme in which
${\it\xi}_{i}$
must be determined as part of the solution, we used a Newton–Raphson iteration scheme in which
 ${\it\xi}_{i}$
are treated as free variables and the volume constraints (C 2c
) as objective functions. Beginning with a trial set
${\it\xi}_{i}$
are treated as free variables and the volume constraints (C 2c
) as objective functions. Beginning with a trial set
 ${\it\xi}_{i}$
, the thickness profiles
${\it\xi}_{i}$
, the thickness profiles
 $F_{i}({\it\xi})$
were constructed by performing a succession of
$F_{i}({\it\xi})$
were constructed by performing a succession of
 $N$
fourth-order Runge–Kutta integrations of (C 1) over the intervals
$N$
fourth-order Runge–Kutta integrations of (C 1) over the intervals
 $[{\it\xi}_{j-1},{\it\xi}_{j}]$
‘initialized’ using the conditions (C 2a,b
) imposed at the front
$[{\it\xi}_{j-1},{\it\xi}_{j}]$
‘initialized’ using the conditions (C 2a,b
) imposed at the front
 ${\it\xi}={\it\xi}_{N}$
and marching backwards in
${\it\xi}={\it\xi}_{N}$
and marching backwards in
 ${\it\xi}$
. Between each interval, continuity conditions on
${\it\xi}$
. Between each interval, continuity conditions on
 $F_{i}$
and
$F_{i}$
and
 $q_{i}$
were imposed and the thickness and slope of each new layer
$q_{i}$
were imposed and the thickness and slope of each new layer
 $F_{j}({\it\xi}_{j})$
and
$F_{j}({\it\xi}_{j})$
and
 $F_{j}^{\prime }({\it\xi}_{j})$
initialized using (C 2a,b
). With
$F_{j}^{\prime }({\it\xi}_{j})$
initialized using (C 2a,b
). With
 $F_{i}({\it\xi})$
obtained, the volumes of each layer were calculated and used to formulate the next trial set
$F_{i}({\it\xi})$
obtained, the volumes of each layer were calculated and used to formulate the next trial set
 ${\it\xi}_{i}$
using a Newton–Raphson iterate. This process was continued until quadratic convergence towards a solution satisfying the specified volumes (C 2c
) was obtained.
${\it\xi}_{i}$
using a Newton–Raphson iterate. This process was continued until quadratic convergence towards a solution satisfying the specified volumes (C 2c
) was obtained.
For the case of a continuous input considered in § 4, we used the same numerical method but with the alternative system of similarity equations relevant to that case. These are obtained by recasting (2.26) in terms of the relevant similarity variables for the horizontal position (4.8) and of the layer thicknesses
 $H_{i}=(\mathscr{Q}^{2}/{\it\phi}U)^{1/3}t^{1/3}F_{i}({\it\xi})$
to obtain
$H_{i}=(\mathscr{Q}^{2}/{\it\phi}U)^{1/3}t^{1/3}F_{i}({\it\xi})$
to obtain
 $$\begin{eqnarray}-\frac{2}{3}{\it\xi}F_{i}^{\prime }+\frac{1}{3}F_{i}=\left(F_{i}\mathop{\sum }_{k=1}^{n}c_{ik}F_{k}^{\prime }\right)^{\prime }.\end{eqnarray}$$
Conditions (2.27b ), (2.28) and (2.29) become
 $$\begin{eqnarray}\displaystyle F_{i}({\it\xi}_{i})=0,\quad c_{i}F_{i}^{\prime }({\it\xi}_{i})=-\frac{2}{3}{\it\xi}_{i},\quad \int _{0}^{{\it\xi}_{i}}F_{i}\;\text{d}{\it\xi}=\hat{Q}_{i}. & & \displaystyle\end{eqnarray}$$
The values of
 $\hat{Q}_{i}$
in (C 6c
) were specified in an analogous manner to
$\hat{Q}_{i}$
in (C 6c
) were specified in an analogous manner to
 $\hat{V}_{i}$
in (C 3) above, except with the dimensionless source distribution function
$\hat{V}_{i}$
in (C 3) above, except with the dimensionless source distribution function
 $\hat{Q}(c)$
given by (4.11b
) in place of
$\hat{Q}(c)$
given by (4.11b
) in place of
 $\hat{V}(c)$
. The only quantitative differences compared to (C 1)–(C 2) are that the left-hand side of (C 5) and the right-hand side of (C 6b
) are different. This was accommodated straightforwardly by a minor alteration of our Runge–Kutta integrator.
$\hat{V}(c)$
. The only quantitative differences compared to (C 1)–(C 2) are that the left-hand side of (C 5) and the right-hand side of (C 6b
) are different. This was accommodated straightforwardly by a minor alteration of our Runge–Kutta integrator.


