


1. Introduction
Starting jets, i.e. a flow impulsively ejected into a quiescent fluid through a nozzle, have been studied as a means of revealing the mechanical principles of biological phenomena such as pulsatile blood flows through heart valves (e.g. Domenichini, Pedrizzetti & Baccani Reference Domenichini, Pedrizzetti and Baccani2005; Pedrizzetti & Domenichini Reference Pedrizzetti and Domenichini2005; Gharib et al. Reference Gharib, Rambod, Kheradvar, Sahn and Dabiri2006; Sotiropoulos, Le & Gilmanov Reference Sotiropoulos, Le and Gilmanov2016) and the propulsion of aquatic animals (e.g. Krueger & Gharib Reference Krueger and Gharib2003; Linden & Turner Reference Linden and Turner2004; Dabiri et al. Reference Dabiri, Colin, Costello and Gharib2005a; Krueger et al. Reference Krueger, Moslemi, Nichols, Bartol and Stewart2008; Dabiri Reference Dabiri2009). Most of these biological systems generate pulsatile starting jets with flexible structures that interact with the surrounding fluid (Lucas et al. Reference Lucas, Johnson, Beaulieu, Cathcart, Tirrell, Colin, Gemmell, Dabiri and Costello2014). To better understand the development of a starting jet in the interaction with flexible structures, simplified models have been adopted. For instance, Ledesma-Alonso, Guzmán & Zenit (Reference Ledesma-Alonso, Guzmán and Zenit2014) experimentally investigated the dynamical behaviour of a model valve in a pulsatile flow using a two-dimensional (2-D) model with deformable leaflets. They predicted whether the valve would buckle under changes in the flexibility of the leaflets and variations in flow conditions such as the pulsation frequency and stroke volume. Das, Govardhan & Arakeri (Reference Das, Govardhan and Arakeri2013) investigated the effect of two rigid leaflets hinged at the end of a channel on the formation of a 2-D counter-rotating vortex pair using a piston–cylinder apparatus. Furthermore, Das, Govardhan & Arakeri (Reference Das, Govardhan and Arakeri2018) considered the flexibility of flaps, which improve the thrust performance, and analysed the deformation of the flaps and the flow structure of the generated starting jet.
Based on previous studies regarding the formation of starting jets with flexible structures, a novel structure that may produce a fast jet with a high impulse through its large elastic deformation, namely an everting structure, is proposed in the present study; the eversion of a structure refers to the process of turning the structure inside out. Everting processes are observed in nature and have been applied in various engineering fields. For instance, everting structures are found in the proboscises of nemerteans, which function to capture prey (McDermott & Roe Reference McDermott and Roe1985), the pollen tubes that deliver sperm cells to an egg cell for fertilization (Palanivelu & Preuss Reference Palanivelu and Preuss2000), and the nematocysts of Cnidaria, one of the fastest stinging organelles, which can penetrate the skin of a prey or a predator and inject neurotoxin through an everted structure (Holstein & Tardent Reference Holstein and Tardent1984; Nüchter et al. Reference Nüchter, Benoit, Engel, Özbek and Holstein2006). Moreover, by using an everting structure, Hawkes et al. (Reference Hawkes, Blumenschein, Greer and Okamura2017) designed a tip-growing soft robot that can control its direction and pass through narrow gaps.
Although the eversion process has drawn attention, most studies have been limited to understanding the structural deformation that occurs during the process (e.g. Gent & Rivlin Reference Gent and Rivlin1952; Haughton & Orr Reference Haughton and Orr1997; Liang, Tao & Cai Reference Liang, Tao and Cai2016; Sigaeva et al. Reference Sigaeva, Mangan, Vergori, Destrade and Sudak2018). The underlying mechanisms regarding the mutual interaction of an everting structure and an external fluid flow remain unclear. In this study, we examine the capability of an everting structure to achieve the impulsive transport of fluid and experimentally investigate the formation of a starting jet through the eversion process using a simplified model. The model used in this study is a general 2-D vortex-pair generator consisting of a rectangular channel and a piston, with two thin elastic sheets attached at the exit of the channel (figure 1). The ends of two thin elastic sheets with a large aspect ratio are clamped at either side of a rectangular channel, and the free ends of the sheets are initially everted to contact each other in the middle of the channel. Because of the rapid eversion of the sheets under the hydrodynamic force and the restoring bending force of the sheets, the fluid is expected to accelerate when it is ejected through the channel exit.

Figure 1. Schematic diagram of the experimental set-up with two elastic sheets attached at the channel exit: ( $a$) side view and (
 $b$) top view; (i) initial state and (ii) after eversion process. (
 $c$) Measured piston speed
  $U_p$ (
 $\circ$) as a function of time. The dashed line denotes the desired velocity profile of the piston with constant
  $U_p$ of
  $15.0\ \textrm {cm}\ \textrm {s}^{-1}$.
The experimental set-up and measurement techniques are described in § 2. In § 3.1, the detailed eversion process of the elastic sheets in response to a piston stroke is examined, and the flow structures with and without the sheets are compared. The effects of the bending rigidity and length of the sheets and the stroke speed of the piston on the deformation of the sheet are analysed in § 3.2. The relation between the kinematics of the sheet and the characteristics of the generated jet, such as the velocity profile and hydrodynamic impulse, is then discussed in § 3.3. Finally, some concluding remarks are presented in § 4.
2. Experimental set-up
Experiments were conducted in a free-surface water tank with internal dimensions of 120 cm (length)  $\times$ 60 cm (width)
  $\times$ 50 cm (height). A piston and a channel made of 5-mm-thick acrylic were used to generate a starting jet. The channel had a rectangular cross-section of 12 cm (height)
  $\times$ 4 cm (width) and a length of 20 cm, and the rectangular piston fitted inside the channel so as to minimize leakage at its edges. Two end plates made of 5-mm-thick acrylic with dimensions of
  $20 \ \textrm {cm} \times 20\ \textrm {cm}$ were attached to the ends of the upper and lower walls of the channel, respectively, to ensure 2-D flow (figure 1a). To generate a starting jet through the translating motion of the piston, a linear guide (MW-EQB45, NTRex Co.) was mounted above the tank and connected to the piston. A data acquisition board (PCIe-6321, National Instrument Co.) sent signals to a stepper motor via a motor driver (MW-VSTB24D3S, NTRex Co.) in order to control the displacement and speed of the linear guide and accordingly the piston, which were prescribed by a MATLAB (Mathworks Inc.) code.
Two thin elastic sheets were clamped at either end of the channel sidewalls, respectively, using thin double-sided tape; the other ends of the sheets were initially everted to contact each other in the middle of the channel (figure 1bi). As the piston moved forward, the sheets flipped over, as shown in figure 1(bii). The elastic sheets were made from polycarbonate (Young's modulus  $E = 2.38 \times 10^9\ \textrm {N}\ \textrm {m}^{-2}$, Poisson's ratio
  $\nu _s = 0.38$, density
  $\rho _s = 1.2 \times 10^3\ \textrm {kg}\ \textrm {m}^{-3}$) with four different sheet thickness values of
  $h = [0.20, 0.25, 0.30, 0.38]$ mm and a constant height
  $H$ of 11.9 cm, which was set slightly less than the height of the channel to reduce the effect of friction between the sheets and the end plates as well as to minimize leakage. Elastic sheets with four different bending rigidities per unit height,
  $B (=Eh^3/(12(1 - \nu _s^2))) = [1.9, 3.6, 6.3, 12.8] \times 10^3\ \textrm {N}\ \textrm {m}$, and three different sheet lengths,
  $L_s = [6.0, 8.0, 10.0]$ cm, were considered. Experiments were also conducted at three different piston speeds,
  $U_p = [7.5, 10.0, 15.0]\ \textrm {cm}\ \textrm {s}^{-1}$. The piston speed
  $U_p$ was measured to be nearly constant except for the impulsive acceleration and deceleration phases, and the measured
  $U_p$ value varied within 3.8 % of the designated input value (figure 1c). The stroke length
  $L_p = 12.0\ \textrm {cm}$ remained constant for all experimental cases; the corresponding stroke ratio
  $L_p/d$ was fixed to 3.0, where
  $d$ is the channel width of 4.0 cm. The Reynolds number
  $Re = U_pd /\nu$ ranged from 3000 to 6000, where
  $U_p$ is the piston speed and
  $\nu$ is the kinematic viscosity of water,
  $1.0 \times 10^{-6}\ \textrm {m}^2\ \textrm {s}^{-1}$ at
  $20\,^{\circ }\textrm {C}$. The variables used in this study are listed in table 1.
Table 1. Experimental variables.

To track the motion of the sheets, the horizontal lines along the middle height of the sheets were illuminated by a continuous laser (10 W, MGL-W-532A, CNI, Co., Ltd.) and captured using a high-speed camera (FASTCAM MINI-UX50, Photron Inc.) mounted below the water tank. The upper side of the test section was covered with black paper to highlight the illuminated lines of the sheets. Images were recorded at 1000 frames per second, and the centreline of the sheets in the images was detected with a MATLAB (Mathworks Inc.) code, which allowed for the coordinates of the deforming sheets to be obtained. The deformation of the two sheets was found to be quite symmetric regardless of the experimental variables considered. For example, the average deviation of  $y$-directional displacement between the two sheets was within 1.4 % along the
  $x$-axis when the sheets had the largest gap between their free ends.
Particle image velocimetry (PIV) was conducted to acquire the velocity fields of the fluid domain near the channel exit. Images were filmed at 1000 frames per second using a high-speed camera with a resolution of  $1280 \times 1024$ pixels. Hollow glass particles with an average density of
  $1.6\ \textrm {g}\ \textrm {ml}^{-1}$ and a mean diameter of
  $14\ \mathrm {\mu }\textrm {m}$ (SH400S20, Potters Industries) were seeded inside the tank. A horizontal planar laser sheet generated by the continuous laser was placed at the middle height of the channel. The cross-correlation among the image pairs was determined with a multiple-pass interrogation method (PIVview2C 3.6, PIVTEC GmbH). A window size of
  $32 \times 32$ pixels with a 50 % overlap was chosen, which yielded
  $79 \times 55$ nodes and a spatial resolution of 3.2 mm. The average size of the particles was set to 2–3 pixels, and approximately 10 particles were included in a single interrogation window. The time interval between a pair of images for cross-correlation was 2 ms. The maximum displacement of individual particles between the two images in a pair was set to be within approximately 1/6 of the window size, based on the results of Willert & Gharib (Reference Willert and Gharib1991). The divergence of the velocity field was evaluated to ensure the accuracy of the PIV results. Although the divergence should ideally be zero for incompressible flow, the maximum magnitude of the divergence evaluated over the entire fluid domain for our experimental cases was
  $O(10^{-4}\ \textrm {s}^{-1})$. This was 5–6 orders of magnitude lower than the maximum vorticity, which suggested that our data were reliable.
The aspect ratio  $AR ({=}H/d)$ of the rectangular channel should be determined prior to the experiments. PIV was employed to obtain the flow field around the channel exit for
  $AR$ values from 1 to 6; the piston speed
  $U_p$ and the piston stroke length
  $L_p$ were kept constant at
  $15.0\ \textrm {cm} \ \textrm {s}^{-1}$ and 12.0 cm, respectively, for this test. The
  $AR$ value of the channel was selected such that the generated vortex pair was 2-D and well maintained its form near the channel exit (
 $x/d<2.0$) during its propagation; for the
  $x$ coordinate, see figure 1(
 $b$i). For small aspect ratios (
 $AR = 1$ and 2), the generated vortex pair changed its shape as it propagated due to the influence of the close upper and lower end plates. For larger aspect ratios (
 $AR = 5$ and 6), three-dimensional (3-D) deformation of the sheets was observed even at rest due to the large height of the sheets. Hence, to minimize these two negative effects, we set
  $AR = 3$. For
  $AR = 3$, the
  $x$-directional velocity profiles were found to be similar at the middle height of the channel and at a vertical distance of
  $H/4$ above or below the middle height. The difference in the magnitude of the peak velocity from that of the middle height was within 3 %, and the difference in the magnitude of the velocity profile remained within approximately 10 % from when the vortex pair was pinched-off to when it passed
  $x/d = 2.0$, which ensured the two-dimensionality of the generated flow. During the eversion process, the difference in the maximum deflection of the sheet at
  $H/4$ from that of the middle height was 4.1 %; the 3-D deformation of the sheet was negligible.
3. Results and discussion
3.1. Eversion process and vortex formation
We first describe the deformation profiles of thin elastic sheets during the eversion process and examine the effect of the elastic deformation of the sheets on starting jet formation by comparing the flow structures between the cases with and without the sheets. Figure 2 shows a time sequence of the deformation profiles of the sheets, which are superimposed on the contours of dimensionless vorticity  $\omega d/U_p$ for a representative case with sheet length
  $L_s = 8.0$ cm, bending rigidity
  $B = 3.6\ \textrm {kN}\ \textrm {m}$ and piston speed
  $U_p = 15.0\ \textrm {cm}\ \textrm {s}^{-1}$. The dimensionless time is defined as
  $U_p t/d$ and the instant when the piston starts to move is
  $U_p t/d = 0$.

Figure 2. Time sequence of sheet deformation profiles and vorticity contours. The dimensionless time  $U_p t/ d$ is (
 $a$) 0, (
 $b$) 0.66, (
 $c$) 1.20, (
 $d$) 1.49, (
 $e$) 1.71 and (
 $f$) 2.21.
The motion of the elastic sheets can be divided into two major stages during the eversion process. When the piston stroke starts, the fluid inside the channel accelerates and pushes the sheets forward. As the sheets slowly unfold, the free ends of both sheets move along the  $x$-axis because they are still in contact with each other. Simultaneously, the shear layer is generated along the inner side of the sheets by the forward flow induced by the piston motion (figure 2b). At this first stage of the eversion process, the motion of the sheets and the resulting flow mostly depend on the piston stroke.
The second stage involves more active motion of the sheets, which causes the generation of greater vorticity, as the sheets completely unfold (figure 2c–e). The sheets bulge outwards as shown in figure 2(c), and vorticity is generated along the outer side of the sheets as it pushes against the surrounding fluid due to the restoring bending force of the sheets. Because of the point contact at the free ends of the sheets, fluid inside the sheets is not yet released. Fast unfolding of the sheets is observed between figures 2(c) and 2(e), where greater vorticity develops outside the sheets undergoing a flipping motion. Eventually, as the flip-over process of the sheets is near completion, the sheets become straight and a fast jet is ejected through the opening between the two sheets (figure 2e). Vorticity induced by the jet develops on the inner side of the sheets, and it is fed into the forming vortex pair near the free ends of the sheets. The vortex pair near the free ends consists of vorticity from the outer side of the sheets, which is induced by the flipping motion, and vorticity from the inner side of the sheets, which is induced by the forward flow inside the channel. Sufficient growth of the leading vortex pair leads to its pinch-off.
The inward motion of the sheet tips is observed soon after the detachment of the leading vortex pair from the sheets (figure 2f). The velocity head development of the jet passing through may be the main reason behind the inward motion; a similar mechanism was also discussed for the inward motion of rigid and flexible flaps by Das et al. (Reference Das, Govardhan and Arakeri2013) and Das et al. (Reference Das, Govardhan and Arakeri2018). Such motion generates the vorticity of a sign opposite to that of the detached leading vortex pair at the free ends of the sheets.
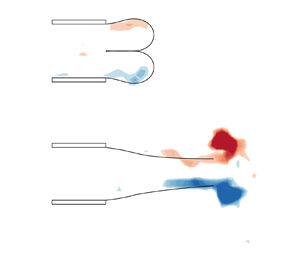
The effect of the eversion process on the starting jet formation is more clearly identified by comparing it with the case in the absence of the sheets and the case in the presence of flexible flaps without an eversion process (figure 3 and supplementary movie available at https://doi.org/10.1017/jfm.2021.609); we consider the flexible flaps only for figure 3 in this study. The flexible flaps had the same length and bending rigidity as those of the everting sheets. The same piston speed  $U_p = 15.0\ \textrm {cm} \ \textrm {s}^{-1}$ and stroke length
  $L_p = 12.0\ \textrm {cm}$ were used for the three cases. The case with the everting sheets chosen for the comparison was identical to that in figure 2. For each of the three cases, the dimensionless times (
 $U_pt/d$) were chosen so that three instances, one during vortex pair development, another just before pinch-off and some arbitrary time after pinch-off, were presented. Therefore, the dimensionless times varied significantly depending on the cases. For the case without the sheets and the case with the non-everting flexible flaps, vortices developed until
  $U_pt/d = 3.0$ when the piston stroke ended, and the developed vortex pair immediately pinched-off afterwards. However, for the case with the everting sheets, a vortex pair was formed in a short time by the eversion of the sheets, and the propagation speed of the vortex pair was relatively greater than that of the other two cases. For this reason, the time interval between sequences was set to be shorter than the other two cases.

Figure 3. Comparison of vorticity contours between ( $a$) the case in the absence of the sheets, (
 $b$) the case with flexible flaps and (
 $c$) the case with everting sheets (
 $L_s = 8.0\ \textrm {cm}$,
  $B = 3.6\ \textrm {kN}\ \textrm {m}$ for both (b,c))
  $U_p = 15.0\ \textrm {cm}\ \textrm {s}^{-1}$. Note that the presented instances differ among the three cases: (a)
  $U_pt/d = 0.64$, 3.08 and 6.44, (b)
  $U_pt/d = 1.21$, 3.08 and 4.00, and (c)
  $U_pt/d = 1.34$, 1.80 and 2.21; the same legend applies to the three cases. See the supplementary movie for raw images.
A distinct difference between flexible flaps and everting sheets was the number of vortex pairs formed during the piston stroke (figure 3b,c). For the case of flexible flaps, multiple counter-rotating vortex pairs were generated due to the unsteady motion of the flaps, which was also reported in figure 10 of Das et al. (Reference Das, Govardhan and Arakeri2018), although the experimental conditions do not match precisely. This was in contrast to the case with the everting sheets where a single vortex pair was formed. When the two cases where the formation of a single vortex pair was observed (the case without the sheets and the case with the everting sheets) are compared, it is notable that much stronger vortices were produced by the rapid eversion of the sheets. As discussed in figure 2, the shear layers that developed on the outer surfaces of the everting sheets eventually merged with the vortices generated by the piston motion and contributed to the enhanced strength of the vortices.
For a quantitative comparison of the vortices generated without and with the sheets, the circulation of the vortex was computed. In this study, the circulation is defined as
 \begin{equation} \varGamma = \int_A\omega\,\mathrm{d}A = \sum_{A}\omega_z\Delta x\Delta y, \end{equation}
where  $A$ is the integration area, and
  $\Delta x$ and
  $\Delta y$ are the spatial resolution of the flow field obtained by PIV. Because the generated flow was symmetric with respect to the
  $x$-axis, only the upper region was considered. The integration area
  $A$ was sufficiently large to encompass all vortices presented in the upper half region of the flow field (figure 4a). To avoid noise being included in the calculation, vorticity with an absolute value of less than
  $1\ \textrm {s}^{-1}$ was neglected. The measurements were repeated five times for the case in the absence of the sheets, and the maximum difference in circulation from the average value for the five cases was less than 3.1 % over the entire time (
 $U_pt/d = 3.0$), which demonstrated the repeatability of our experiments.

Figure 4. ( $a$) Integration area
  $A$ (red box) for computing circulation. (
 $b$) Time history of dimensionless circulation
  $\varGamma /(U_pd)$ in the absence of the sheets (
 $\circ$) and in the presence of the sheets with
  $L_s = 8.0\ \textrm {cm}$ and
  $B = 3.6\ \textrm {kN}\ \textrm {m}$ (
 $\square$):
  $U_p = 15.0\ \textrm {cm}\ \textrm {s}^{-1}$. The instances (
 $b$–
$b$– $f$) inside panel (
 $b$) correspond to panels (
 $b$–
$b$– $f$) of figure 2. The filled symbol denotes dimensionless circulation
  $\varGamma /(U_pd)$ only for the upper vortex of the pinched-off leading vortex pair.
To compute the total circulation ejected from the channel exit, the left boundary of the integration area was placed at the channel exit:  $x/d = 0$ (figure 4a). The total circulation was evaluated until the leading vortex pair was pinched-off for both cases with and without the sheets. For the case without the sheets, the total circulation was evaluated until the piston stroke ended at
  $U_p t/d = 3.0$. For the cases with the sheets, the total circulation was evaluated including the shear layer created around the sheet as well as the upper vortex of the leading vortex pair until the leading vortex pair was pinched-off. After the leading vortex pair was pinched-off, only the circulation for the upper vortex of the leading vortex pair was considered using a moving integration area so that trailing jets generated by the residual stroke were not included. The computed circulation
  $\varGamma$ was made dimensionless using the piston speed
  $U_p$ and the channel width
  $d$:
$d$:  $\varGamma /(U_p d)$.
The trends of the temporal change in circulation were compared between the cases without and with the sheets ( $L_s = 8.0\ \textrm {cm}, B = 3.6\ \textrm {kN}\ \textrm {m}$) (figure 4b). In the absence of the sheets, as fluid continued to be ejected from the channel exit from
  $U_pt/d = 0$, the total circulation value gradually increased up to
  $\varGamma /(U_p d)\approx 1.3$ until the piston stroke stopped at
  $U_p t/d = 3.0$. Shortly after, the leading vortex pair was shed from the exit and began to dissipate. Thus, the circulation no longer increased, but decreased slowly, although this is not provided in figure 4(b). In the presence of the sheets, in addition to the shear layer developed by the piston-generated flow, the strong vorticity generated from the deforming sheets should also be considered, and the temporal change in total circulation shows a different trend from that without the sheets. Instances corresponding to figure 2(b–f) are marked in figure 4(b) so that the temporal change in total circulation can be correlated with the behaviour of the sheets.
From the start of the piston stroke ( $U_pt/d = 0$) to
  $U_pt/d = 1.2$, the total circulation was maintained at
  $\varGamma /(U_p d) \approx 1.1$, which drastically increased thereafter: the instance (c) in figure 4(b). This instance was when the sheets began to flip over outwards while their ends remained in contact (figure 2c). The cause of such an abrupt increment in total circulation was reasonably linked to the rapid flipping motion of the sheets throughout the instances from figures 2(c) to 2(e). The generation of strong vorticity was initiated by the motion of the sheets (figure 2c), which eventually accumulated a greater vorticity into the forming vortex pair. Therefore, the rapid unfolding motion during the eversion process was regarded as the key behaviour of the sheets on the generation of a strong vortex structure.
The drastic increase in total circulation came to an end, reaching a maximum value ( $\varGamma /(U_p d)\approx 8.3$) at
  $U_pt/d = 1.7$ when the sheets were fully unfolded (figure 2e). Thereafter, the inward motion of the sheets toward the centre of the channel was responsible for forming a vortex of a sign opposite to that of the leading vortex pair. Thus, the total circulation decreased, and the leading vortex pair was pinched-off around
  $U_pt/d = 2.1$ (figure 2f). From this instance, only the circulation for the upper vortex of the leading vortex pair is presented. It remained near
  $\varGamma /(U_p d) = 5.3$, which is roughly four times greater than that without the sheets. Including the case presented in figure 4(b), the peak circulation values for the upper vortex of the leading vortex pair, for all of the different sheet lengths and bending rigidities considered in this study, were at least twice the value without the sheets.
In addition to the magnitude of the maximum circulation, the time required for the circulation to reach its maximum was also affected by the everting sheets. The presence of the sheets caused the vortex pair to become fully developed within a notably shorter time (figures 3 and 4b). According to Gharib, Rambod & Shariff (Reference Gharib, Rambod and Shariff1998), the maximum circulation that a vortex ring can attain is equivalent to the total circulation ejected from the nozzle up to a certain dimensionless time called the formation number. Generally, the formation number was found near 4.0 for a vortex ring generated from a piston–cylinder apparatus for various velocity programs although the formation number could be varied by the temporal change in the flow velocity or the nozzle diameter (Rosenfeld, Rambod & Gharib Reference Rosenfeld, Rambod and Gharib1998; Mohseni, Ran & Colonius Reference Mohseni, Ran and Colonius2001; Dabiri & Gharib Reference Dabiri and Gharib2005b). In our study, the formation number of most cases in the presence of the sheets was found to be less than 3.0.
3.2. Sheet kinematics
Quantitative analysis of the deformation of the sheets is a prerequisite for a better understanding of the features of the jet flow generated through the eversion of the sheets. During the eversion process, the behaviour of the sheets depends on the mechanical properties of the sheets and the fluid force applied to the sheets. Here, we examine the effects of design variables such as the sheet length  $L_s$, bending rigidity
  $B$ and piston speed
  $U_p$ on the deformation of the sheets.
First, we chose a parameter that represented the deformation of the sheets in the eversion process. The exit width  $d_e$, i.e. the width between the tips of the sheets, was considered as such a parameter (figure 5a). Temporal change in the dimensionless exit width
  $d_e/d$ for the case with the sheets (
 $L_s = 8.0\ \textrm {cm}$ and
  $B = 3.6\ \textrm {kN}\ \textrm {m}$) is shown in figure 5(b). The dimensionless exit width
  $d_e/d$ started to increase when the fluid inside the channel began to be ejected through the widening gap between the sheets (figure 2d), and it reached its maximum value after a very short duration,
  $\Delta U_p t/d \simeq 0.2$. The decrease in the exit width reflected the inward motion of the elastic sheets, as shown in figure 2(f). However, the exit width was not appropriate for representing the deformation of the sheets at the early stage of the eversion process because it had a value of zero when the sheets were in contact (figure 2a–d).

Figure 5. ( $a$) Schematic diagram describing the sheet tip angle
  $\theta$ and the exit width
  $d_e$. Time history of (
 $b$) dimensionless exit width
  $d_e/d$, (
 $c$) sheet tip angle
  $\theta$ and (
 $d$) dimensionless elastic strain energy
  $E_s/E_{s,max}$ in the presence of the sheets with
  $L_s = 8.0\ \textrm {cm}$ and
  $B =\ 3.6\ \textrm {kN}\ \textrm {m}$:
  $U_p = 15.0\ \textrm {cm}\ \textrm {s}^{-1}$. The instances (
 $b$–
$b$– $f$) in panels (
 $b$–
$b$– $d$) correspond to panels (
 $b$–
$b$– $f$) of figure 2.
The key behaviour of the sheets in the eversion process is their rapid unfolding. Thus, to investigate how fast and wide the sheets are flipped over, we considered the sheet tip angle  $\theta$, which is the angle between the channel end and the free tip of the sheet (figure 5a). Temporal change in the sheet tip angle
  $\theta$ for the case with the sheets (
 $L_s =\ 8.0\ \textrm {cm}$ and
  $B = 3.6\ \textrm {kN}\ \textrm {m}$) is shown in figure 5(c). Although the evolution of
  $\theta$ does not solely represent the elastic deformation of the sheets, it provides a rough idea on the trajectory of the free ends of the sheets over the entire period of the eversion process. Thus, together with the exit width in figure 5(b), it is useful for identifying several kinematic features of the eversion process.
Along with  $d_e/d$ and
  $\theta$, the time history of the elastic strain energy normalized by its maximum value,
  $E_s/E_{s,max}$, of a single sheet is presented in figure 5(d). The elastic strain energy
  $E_s$ per unit depth is defined as
  $\frac {1}{2}B\int _{0}^{L_s} \kappa ^2\,\mathrm {d}s$, where
  $\kappa$
  $({=}(\mathrm {d}^2y/\mathrm {d} x^2)/[1+(\mathrm {d}y/\mathrm {d} x)^2]^{3/2})$ is the curvature of the sheet. The curvature was calculated from the position data obtained from the filmed images. The sheet was discretized into 90–100 segments along its length with the same
  $\mathrm {d}s$. For each segment, the central difference scheme was used to obtain
  $\mathrm {d}^2y/\mathrm {d} x^2$ and
  $\mathrm {d} y/\mathrm {d} x$. Gradual increase in the elastic strain energy until the instance (
 $c$) was expected as the sheets were more deformed when pushed outward by the piston stroke, which formed a local bulge (figure 2b,c). However, as the sheets rapidly unfolded, a drastic decrease in the strain energy was observed, which was transferred to the developing flow throughout the fast unfolding motion.
In figure 6(a,b), three different  $L_s$ values of 6.0, 8.0 and 10.0 cm are considered for the same
  $B ({=}\ 3.6\ \textrm {kN}\ \textrm {m})$, and four different
  $B$ values of 1.9, 3.6, 6.3 and 12.8 kN m are considered for the same
  $L_s ({=}\ 8.0\ \textrm {cm}$); the effects of the piston speed
  $U_p$ will be discussed later. The temporal histories of the sheet tip angle
  $\theta$ showed a similar trend as discussed in figure 5(c). However, the maximum value of the sheet tip angle (
 $\theta _{max}$) and the time taken to reach
  $\theta _{max}$ (
 $t |_{\theta = \theta _{max}}$) clearly depended on the values of
  $L_s$ and
  $B$ (figure 6ai,bi). When the sheet length
  $L_s$ increased, the magnitude of
  $\theta _{max}$ became larger (figure 6ai). The dependence of
  $\theta _{max}$ on
  $L_s$ was also illustrated in the deformation profiles of the sheets at
  $\theta = \theta _{max}$ (figure 6aii). With a small sheet length (
 $L_s = 6.0\ \textrm {cm}$),
  $\theta _{max}$ was approximately
  $-5.7^{\circ }$ and the exit width was smaller than the width of the rigid channel (4.0 cm), although the sheets became fully unfolded. For a large sheet length (
 $L_s = 10.0$ cm),
  $\theta _{max}$ was approximately
  $4.8^{\circ }$ and the exit width was greater than the channel width. This difference in the sheet tip angle also affected the characteristics of the jet ejected from the apparatus, as discussed in § 3.3. In addition, the time required to reach
  $\theta _{max}$ increased with
  $L_s$:
  $t |_{\theta = \theta _{max}} = 0.26$, 0.46 and 0.67 s for
  $L_s =6.0$, 8.0 and 10.0 cm, respectively.

Figure 6. (ai) Sheet tip angle  $\theta$ as a function of time
  $t$ and (aii) sheet deformation profiles at the instance (c) in figure 2 and at
  $\theta = \theta _{max}$ for
  $B = 3.6 \ \textrm {kN}\ \textrm {m}$ with three different sheet lengths:
  $L_s = 6.0$ cm (
 ${\triangle}$); 8.0 cm (
 $\square$); 10.0 cm (
 $\diamond$). (bi, bii)
  $L_s = 8.0$ with four different bending rigidities:
  $B = 1.9\ \textrm {kN}\ \textrm {m}$ (
 ${\triangle}$); 3.6 kN m (
 $\square$); 6.3 kN m (
 ${\triangledown}$); 12.8 kN m (
 $\diamond$). For all cases,
  $U_p = 15.0\ \textrm {cm}\ \textrm {s}^{-1}$. The dashed line and the down arrow in panels (ai,bi) indicate the instances (c,d) from figure 2, respectively.
In contrast to the trend of the sheet length  $L_s$, the value of
  $\theta _{max}$ decreased as the bending rigidity
  $B$ increased (figure 6bi,bii);
  $\theta _{max} = 5.1^\circ$ for
  $B = 1.9 \ \textrm {kN}\ \textrm {m}$ and
  $\theta _{max} = -3.5^\circ$ for
  $B = 12.8\ \textrm {kN}\ \textrm {m}$. From the instance when the flip-over occurred, the influence of
  $B$ related to the bending force of the sheets was dominant. For the larger value of
  $B$, the sheets were more resistant to deformation, and a greater restoring force acted to return to the natural state of the sheets, which resulted in a lower
  $\theta _{max}$ and less time required to reach
  $\theta _{max}$:
  $t |_{\theta = \theta _{max}} = 0.52$ and 0.39 s for
  $B = 1.9$ kN m and 12.8 kN m, respectively. Generally,
  $\theta _{max}$ and the corresponding
  $t |_{\theta = \theta _{max}}$ are less sensitive to changes in
  $B$ than in
  $L_s$.
The dotted lines in figure 6(ai,bi) indicate the time of the instance ( $c$) in figure 2 when the flipping motion of the sheets became apparent. The absolute time when the instance (
 $c$) was reached increased with
  $L_s$, while the effect of
  $B$ was minimal. Such a trend is illustrated in the first row of figure 6(aii,bii) as the free ends of the sheets are located notably further in the
  $x$-direction for the larger
  $L_s$ value in contrast to nearly similar shapes observed for various
  $B$ values.
Although not provided here, the temporal variations in  $\theta$ with respect to the stroke speed
  $U_p$ exhibited a different trend from those of the two groups shown in figure 6(ai,bi). The value of
  $\theta _{max}$ increased and
  $t |_{\theta = \theta _{max}}$ decreased with increasing
  $U_p$; for example,
  $\theta _{max} = -4.8$,
  $-3.0$ and
  $2.1^{\circ }$, and
  $t |_{\theta = \theta _{max}} = 0.75$, 0.55 and 0.46 s for
  $U_p = 7.5$,
  $10.0$ and
  $15.0\ \textrm {cm}\ \textrm {s}^{-1}$, respectively (
 $L_s = 8.0\ \textrm {cm}$ and
  $B = 3.6\ \textrm {kN}\ \textrm {m}$).
To characterize the behaviour of the sheet in the eversion process, a dimensionless parameter was introduced which combined the three variables  $L_s$,
  $B$ and
  $U_p$: the dimensionless bending rigidity
  $B^*$. Dimensionless forms of the bending rigidity have been used in previous studies regarding the interaction of fluid flow with elastic structures such as a flag (Connell & Yue Reference Connell and Yue2007; Kim et al. Reference Kim, Cossé, Cerdeira and Gharib2013a) and a flap (Shukla, Govardhan & Arakeri Reference Shukla, Govardhan and Arakeri2013; Das et al. Reference Das, Govardhan and Arakeri2018). To investigate the deflection of flexible flaps following the interaction with a jet flow coming out of a channel, Das et al. (Reference Das, Govardhan and Arakeri2018) defined a dimensionless bending rigidity by comparing the scale of the kinetic energy of the fluid ejected from the channel with the scale of the elastic energy stored in the flaps.
The kinetic energy of the flow is regarded as the work done by the fluid force (i.e. the product of hydrodynamic pressure and the channel cross-sectional area) while the fluid slug is translated a distance  $L_s$ inside the channel. Thus, the kinetic energy
  $E_k$ of the fluid coming from the channel per unit depth scales as
  $E_k \sim \frac {1}{2}\rho _f d L_s U_p^2$, where
  $\rho _f$ is the fluid density and
  $d$ is the channel width. The elastic strain energy
  $E_s$ stored in the sheets per unit depth is expressed in the form of a line integral,
  $E_s = \frac {1}{2}B\int _{0}^{L_s} \kappa ^2\,\mathrm {d}s$. The strain energy can be assumed to scale as
  $E_s \sim B\delta ^2/L_s^3$, where
  $\delta$ is the characteristic deflection of the sheet tip;
  $\kappa$ scales with
  $\delta /L_s^2$. When the sheets are in contact at the centre of the channel before the flip-over process, the contact force and relevant energy, which restricts the motion of the sheets, should also be considered (figure 2a–c). Thus, as for the representative magnitude of
  $E_s$, we consider the phase in which the sheets begin to flip-over. At this phase, the sheets bulge outward with a magnitude that scales with the total length
  $L_s$ of the sheet (figure 2c). The characteristic deflection
  $\delta$ of the sheets can be assumed to scale with
  $L_s$, and the scale of the strain energy
  $E_s$ per unit depth can be rearranged as
  $E_s \sim B/L_s$. As defined by Das et al. (Reference Das, Govardhan and Arakeri2018), the dimensionless bending rigidity
  $B^*$ indicates the relative magnitude of two energy scales,
  $E_s/E_k$, between the strain energy of the sheets and the fluid kinetic energy generated by the piston:
 \begin{equation} B^* = \frac{B}{\frac{1}{2}\rho_f d L_s^2 U_p^2}. \end{equation}
 The maximum sheet tip angle  $\theta _{max}$ and the dimensionless time
  $t^*|_{\theta = \theta _{max}}$ (
 ${=}U_pt/L_s|_{\theta = \theta _{max}}$) to reach
  $\theta _{max}$ are plotted with respect to
  $B^*$ in figure 7 for all values of
  $L_s$,
  $B$ and
  $U_p$ considered in this study. Note that, in figure 7(b), the time
  $t|_{\theta = \theta _{max}}$ is made dimensionless using
  $L_s$ (
 $U_pt/L_s|_{\theta = \theta _{max}}$) rather than
  $d$ (which was used to make
  $t$ dimensionless in § 3.1) because
  $L_s$ is more relevant to the determination of
  $\theta$ than
  $d$ which is constant in this study. Despite large variations in
  $L_s$,
  $B$ and
  $U_p$ as well as the aforementioned different trends of
  $\theta _{max}$ and
  $t|_{\theta = \theta _{max}}$ with respect to changes in each of
  $L_s$,
  $B$ and
  $U_p$, both
  $\theta _{max}$ and
  $t^*|_{\theta = \theta _{max}}$ tended to decrease asymptotically with
  $B^*$. That is, the trends in
  $\theta _{max}$ and
  $t^*|_{\theta = \theta _{max}}$ were captured by the single dimensionless parameter
  $B^*$.

Figure 7. (a) Maximum sheet tip angle  $\theta_{max}$, (b) dimensionless time
  $t^*|_{\theta = \theta_{max}}$ taken to reach
  $\theta_{max}$, with respect to dimensionless bending rigidity
  $B^*$ for different values of B,
  $L_s$ and
  $U_p$. Each point represents the value averaged over 4–5 repeated experiments, and error bars denote the standard deviation.
In explaining the eversion process of the sheets using figure 2, the whole process was divided into two stages, in which the kinematics of the sheets in the first stage was primarily determined by the piston motion (figure 2a–c) and the second stage was governed by the flipping motion of the sheets itself under restoring elastic force (figure 2c–e). Our conjecture on the key mechanism behind the formation of a strong leading vortex pair, which is the rapid flipping motion of the sheets, was verified by the drastic increase in the total circulation around the instance (c) in figure 4(b). To quantify the flipping motion of the sheets, the time duration when the apparent flipping motion of the sheets was observed, the instances from (c) to (e) in figure 2, is denoted as  $t_{ce}$. The dimensionless time taken for the sheets to undergo active flipping motion,
  $t^*_{ce}({=}\ U_pt_{ce}/L_s)$, tended to reduce asymptotically with respect to the dimensionless bending stiffness
  $B^*$ (figure 8a). Although the change in
  $\theta$ during the instances from (
 $c$) to (
 $e$),
$e$),  $\theta _{ce}$, varied with respect to
  $B^*$, the variation in
  $\theta _{ce}$ was observed to be relatively small compared with the variation in
  $t^*_{ce}$. Thus, the rate of change in
  $\theta$ (i.e. mean angular velocity) during the same instances,
  $\varOmega ^*_m = \theta _{ce}/t^*_{ce}$ in dimensionless form, exhibited an asymptotically increasing trend versus
  $B^*$ (figure 8b).

Figure 8. (a) Dimensionless time duration  $t^*_{ce}$ and (b) dimensionless mean angular velocity
  $\varOmega _m^*$ of the unfolding sheets from the instance (c) to the instance (e) in figure 2 with respect to dimensionless bending rigidity
  $B^*$. (c) Dimensionless elastic strain energy
  $E^*_s$ of a single sheet at the instance (c) in figure 2 with respect to dimensionless bending rigidity
  $B^*$. Each point represents the value averaged over 4–5 repeated experiments, and error bars denote the standard deviation.
Moreover, it was already shown in figure 5(d) that maximum elastic strain energy  $E_{s,max}$ occurred at the instance (c) and it was eventually transferred to the fluid at the instance (e). In figure 8(c), the dimensionless elastic strain energy
  $E^*_{s,max} ({=}\ E_{s,max}/(0.5\rho _f d L_s U_p^2))$ at the instance (
 $c$), normalized by the kinetic energy of the fluid as in
  $B^*$, increased monotonically with respect to
  $B^*$. The increase in
  $B^*$ led to the faster unfolding of the sheets, which resulted in the faster and also greater transfer of elastic energy to the generating flow. This process was responsible for the generation of a faster jet with a greater hydrodynamic impulse in regards to
  $B^*$, which will be further addressed in the next section.
3.3. Jet characteristics
In this section, by varying certain geometric and kinematic parameters, we investigate how the fluid velocity profile and hydrodynamic impulse of the jet are affected by its interaction with the sheets in the eversion process. To examine how a fast jet forms during the eversion process, the profile of  $x$-directional velocity
  $U$ along the
  $y$-axis, normalized by the piston speed
  $U_p$, is shown in figure 9. Elastic sheets with three different
  $L_s$ values of 6.0, 8.0 and 10.0 cm for a fixed value of
  $B = 3.6\ \textrm {kN}\ \textrm {m}$ and three different
  $B$ values of 1.9, 3.6 and 12.8 kN m for a fixed value of
  $L_s = 8.0\ \textrm {cm}$ were used for the analysis; the case without sheets was also considered. In each case, the experiment was conducted with the same piston speed of
  $U_p = 15.0\ \textrm {cm}\ \textrm {s}^{-1}$. For a proper comparison of the velocity profile among cases with different
  $L_s$ and
  $B$ values, the velocity profile was presented on a
  $y$-directional straight line passing through the two cores of the counter-rotating leading vortex pair when the vortex pair was pinched-off (figure 9c). The
  $x$-location for the cases used in our study ranged between 1.10 and 1.24
  $L_s$.

Figure 9. ( $a$) The
  $X$-directional flow velocity profiles of the starting jet for
  $B = 3.6\ \textrm {kN}\ \textrm {m}$,
  $L_s = 6.0\ \textrm {cm}$ (
 ${\triangle}$); 8.0 cm (
 $\square$); 10.0 cm (
 $\diamond$). (
 $b$) The
  $X$-directional flow velocity profiles for
  $L_s = 8.0\ \textrm {cm}$,
  $B = 1.9\ \textrm {kN}\ \textrm {m}$ (
 ${\triangle}$); 3.6 kN m (
 $\square$); 12.8 kN m (
 $\diamond$). For all cases,
  $U_p = 15.0\ \textrm {cm}\ \textrm {s}^{-1}$. In (a,b), the blue circles (
 ${\bigcirc}$) denote the case in the absence of the sheets. Note that the range of the
  $y$-axis differs between (a,b). In panel (
 $c$), the vertical dashed line denotes the
  $x$ location of the velocity profile when the vortex pair is pinched-off.
In all cases considered in figure 9, the velocity  $U_c$ at the centre (
 $y/d = 0$) was notably greater with the sheets than without them. For instance, the central velocity
  $U_c$ for the case with
  $B = 12.8\ \textrm {kN}\ \textrm {m}$ was more than four times greater than that for the case without the sheets. Even with the least stiff sheets (
 $B = 1.9\ \textrm {kN}\ \textrm {m}$), the central velocity was approximately 1.5 times greater. In addition to the central velocity of the jet, the core-to-core distance of the leading vortex pair,
  $d_c$, varied with
  $L_s$ and
  $B$. The location of the vorticity peak on the vorticity profile was assumed to be the centre of the vortex core, and the
  $y$-directional distance between the two vorticity peak locations of the vortex pair was measured. The vorticity peak was very close to the point with zero
  $x$-directional velocity on the velocity profile. In this study, the distance between the two vorticity peaks was regarded as the width of the jet.
When  $L_s$ was varied with the other conditions unchanged, a shorter
  $L_s$ tended to produce a narrower and faster jet (figure 9a). That is, as
  $L_s$ decreased,
  $d_c$ decreased, whereas
  $U_c$ increased. For the shortest sheet length (
 $L_s = 6.0\ \textrm {cm}$), the
  $d_c$ and
  $U_c$ values were 0.6
 $d$ and 4.1
 $U_p$, respectively, which were 0.5 and
  $\sim$2 times the
  $d_c$ and
  $U_c$ values of the
  $L_s = 10.0\ \textrm {cm}$ case (
 $d_c = 1.2d$ and
  $U_c = 2.4U_p$). Similar to the trend observed with decreasing
  $L_s$, a more focused and faster jet was generated as
  $B$ increased (figure 9b). For
  $B = 1.9$ and 12.8 kN m,
  $d_c/d$ was 1.4 and 0.8, and
  $U_c/U_p$ was 1.9 and 7.8, respectively. The central velocity of the jet was more sensitive than the jet width to changes in
  $B$.
$B$.
In addition to  $L_s$ and
  $B$, we also examined how the jet velocity at the centre and the jet width were affected by the piston speed
  $U_p$, although a corresponding figure is not provided. Three different
  $U_p$ values of 7.5, 10.0 and
  $15.0\ \textrm {cm}\ \textrm {s}^{-1}$ were considered, given
  $L_s = 8.0\ \textrm {cm}$ and
  $B = 3.6\ \textrm {kN}\ \textrm {m}$. As
  $U_p$ increased, the leading vortex pair exhibited a larger value of
  $d_c$;
  $d_c/d = 1.0$ for
  $U_p = 15.0\ \textrm {cm}\ \textrm {s}^{-1}$ and
  $d_c/d = 0.8$ for
  $U_p = 7.5\ \textrm {cm} \ \textrm {s}^{-1}$. Furthermore, the velocity
  $U_c$ at the centre of the jet naturally increased with
  $U_p$. However,
  $U_c$ was not proportional to
  $U_p$, and the value of
  $U_c$ normalized by
  $U_p$ decreased somewhat:
  $U_c/U_p$ was 7.1, 5.7 and 4.2 for
  $U_p = 7.5$,
  $10.0$ and
  $15.0\ \textrm {cm}\ \textrm {s}^{-1}$, respectively.
The effects of  $L_s$,
  $B$ and
  $U_p$ on the velocity profile of the generated starting jet were comprehensively considered using the dimensionless parameter
  $B^*$. The dimensionless width
  $d_c/d$ and central velocity
  $U_c/U_p$ of the jet are plotted with respect to
  $B^*$ for all experimental cases in figure 10. The jet characteristics were coupled with the deformation of the sheets during the eversion process. As
  $B^*$ increased, the maximum sheet tip angle, a parameter relevant to the exit width, became smaller (figure 7a). As a consequence, a more focused jet with a small
  $d_c/d$ was generated as
  $B^*$ increased (figure 10a). As the maximum sheet tip angle decreased with
  $B^*$, the jet velocity (more specifically the central jet velocity) increased by the conservation of mass. In addition, through the eversion process, additional momentum was imposed on the flow by the restoring elastic sheets, and this was expected to scale with
  $B^*$. Therefore, the
  $U_c/U_p$ value tended to increase monotonically with
  $B^*$ (figure 10b). Notably, a jet velocity of approximately 3–13 times the piston speed
  $U_p$ was achieved through the eversion process.

Figure 10. ( $a$) Dimensionless width
  $d_c/d$ of the jet and (
 $b$) dimensionless flow speed
  $U_c/U_p$ at the centre of the jet with respect to dimensionless bending rigidity
  $B^*$. Each point represents the value averaged over 4–5 repeated experiments, and error bars denote the standard deviation.
The hydrodynamic impulse of the starting jet is now analysed to determine how the jet generated through the eversion process is related to the momentum transfer to the surrounding fluid. The hydrodynamic impulse  $I$ in a 2-D fluid domain is formulated as an integration of the cross-product of the position vector and vorticity over a control area (
 $A$) that is large enough to include all vortical structures; vorticity and velocity are assumed to be negligible on the boundaries of
  $A$.
$A$.
 \begin{equation} I = \rho\int_{A} (\boldsymbol{x} \times \boldsymbol{\omega})\,\mathrm{d}{A}. \end{equation}
The rate of change of the hydrodynamic impulse can be considered as the total sum of non-conservative body forces applied to the fluid (Saffman Reference Saffman1992), and this quantity has been applied to estimate the forces around a body in an unsteady flow (e.g. Noca, Shiels & Jeon Reference Noca, Shiels and Jeon1997; Kim, Hussain & Gharib Reference Kim, Hussain and Gharib2013b; DeVoria, Carr & Ringuette Reference DeVoria, Carr and Ringuette2014; Lee et al. Reference Lee, Park, Cho, Kim and Kim2017). Using experimentally obtained velocity fields, Das et al. (Reference Das, Govardhan and Arakeri2018) also evaluated the hydrodynamic impulse of the jet flow ejected from a nozzle with flexible structures attached.
Due to the symmetry of the flow generated through the eversion process, the impulse in the  $y$ direction on the 2-D domain is assumed to be zero, and only the impulse in the
  $x$ direction (the direction of the jet) is evaluated. The
  $x$-directional impulse
  $I_x$ is expressed as
 \begin{equation} I_x = \rho\int_{A} y \omega_{z}\,\mathrm{d}A = \rho\sum_{A} y \omega_{z}\Delta x\Delta y, \end{equation}
where  $A$ is the integration area and
  $\Delta x$ and
  $\Delta y$ are the spatial resolution of the flow field obtained by PIV. The integration area
  $A$ was sufficiently large to encompass all vortices presented in the flow field (figure 11c). To avoid noise being included in the calculation, vorticity with an absolute value of less than
  $1\ \textrm {s}^{-1}$ was neglected. In the calculation of the total hydrodynamic impulse of the flow ejected from the channel exit, the left boundary of the integration area was placed and fixed at the channel exit (figure 11c). The total hydrodynamic impulse was considered until the vortex pair was pinched-off for both cases with and without the sheets. After the vortex pair was pinched-off, the impulse of the isolated leading vortex pair was calculated separately in a moving integration area so that trailing jets generated by the residual stroke were not included.

Figure 11. ( $a$) Hydrodynamic impulse with respect to time for
  $B = 3.6\ \textrm {kN}\ \textrm {m}$,
  $L_s = 6.0\ \textrm {cm}$ (
 ${\triangle}$); 8.0 cm (
 $\square$); 10.0 cm (
 $\diamond$). (
 $b$) Hydrodynamic impulse for
  $L_s = 8.0\ \textrm {cm}$,
  $B = 1.9\ \textrm {kN}\ \textrm {m}$ (
 ${\triangle}$); 3.6 kN m (
 $\square$); 12.8 kN m (
 $\diamond$). For all cases,
  $U_p = 15.0\ \textrm {cm}\ \textrm {s}^{-1}$. In (a,b), the blue circles (
 ${\bigcirc}$) denote the case in the absence of the sheets. The filled symbol denotes the hydrodynamic impulse of the pinched-off leading vortex pair. (c) Integration area
  $A$ (red box) for computing the hydrodynamic impulse.
The time history of the  $x$-directional hydrodynamic impulse
  $I_x$ is shown in figure 11(a,b). Along with the case without the sheets, the cases with three different
  $L_s$ values (6.0, 8.0 and 10.0 cm) for the same
  $B$ and three different
  $B$ values (1.9, 3.6 and 12.8 kN m) for the same
  $L_s$ are presented, similar to figure 9(a,b). In the absence of the sheets, because the piston stroke began at
  $t = 0$ s, the vortex pair gradually developed near the exit of the channel, and the impulse increased linearly over time until the piston stroke ended at
  $U_p t/d = 3.0$ (
 $t = 0.8\ \textrm {s}$). In the presence of the sheets, the impulse increased sharply from the instance (c) in figure 2, and reached its peak value within a very short time; this was in accordance with the sharp increase in total circulation shown in figure 4(b). Then, the total impulse decreased due to the re-narrowing motion of the sheets which induced the vorticity of an opposite sign. To examine the effect of
  $L_s$ and
  $B$ on the impulse of the starting jet, the impulse of only the leading vortex pair rather than the total impulse is considered throughout the following discussion, and this value is denoted as filled symbols in figure 11(a,b).
In the presence of the sheets, the hydrodynamic impulse of the leading vortex pair attained a greater peak through the eversion process than the case without sheets (figure 11a,b); this also held for all cases considered in this study. Regarding the effect of  $L_s$ on the hydrodynamic impulse (figure 11a), the rate of change in the impulse (slope of the impulse versus time curve) decreased slightly as
  $L_s$ increased. However, the trend of the impulse peak differed significantly from that of the impulse slope. According to figure 9(a), a relatively slow jet was formed in the case of the longest sheet length,
  $L_s = 10.0\ \textrm {cm}$. Nevertheless, the impulse peak of this case (
 $I_{x,peak} = 1.7\ \textrm {kg}\ \textrm {s}^{-1}$) was greater than in the two cases with shorter sheet lengths:
  $I_{x,peak} = 1.0$ and
  $1.5\ \textrm {kg}\ \textrm {s}^{-1}$ for
  $L_s = 6.0$ and 8.0 cm, respectively. This indicated that, even with a fast jet, the impulse may not necessarily be large.
According to (3.4), the hydrodynamic impulse of the generated vortex pair is relevant to the vorticity  $\omega _z$ and the
  $y$-directional distance from the
  $x$-axis. In figure 12(a), the profile of the vorticity is depicted for different values of
  $L_s$, which correspond to the cases shown in figure 11(a). The vorticity profiles were obtained on a
  $y$-directional straight line passing through the cores of the counter-rotating leading vortex pair when the vortex pair was pinched-off. Although the magnitude of peak vorticity at the vortex core remained similar as
  $L_s$ increases, the core-to-core distance (jet width)
  $d_c$ became larger, which resulted in a greater impulse being imposed on the surrounding fluid.

Figure 12. (a) Vorticity profiles of the starting jet for  $B = 3.6\ \textrm {kN}\ \textrm {m}$,
  $L_s = 6.0\ \textrm {cm}$ (
 ${\triangle}$); 8.0 cm (
 $\square$); 10.0 cm (
 $\diamond$). (b) Vorticity profiles for
  $L_s = 8.0\ \textrm {cm}$,
  $B = 1.9\ \textrm {kN}\ \textrm {m}$ (
 ${\triangle}$); 3.6 kN m (
 $\square$); 12.8 kN m (
 $\diamond$). For all cases,
  $U_p = 15.0\ \textrm {cm}\ \textrm {s}^{-1}$.
As  $L_s$ increased, it took a longer stroke time until the hydrodynamic impulse reached a maximum (figure 11a). To quantify the magnitude of the impulse generated per unit time, we considered a parameter
  $\bar {F}$, which is defined as the peak impulse
  $I_{x, peak}$ divided by the stroke time
  $t_s$ corresponding to the peak impulse: the slope between the point of the maximum impulse and the origin in figure 11(a).
 \begin{equation} \bar{F} = \frac{I_{x, peak}}{t_s}. \end{equation}
This parameter can be regarded as the time-averaged force imposed on the surrounding fluid by the jet generated by the piston stroke and the eversion of the sheets. In contrast to  $I_{x, peak}$,
  $\bar {F}$ decreased as
  $L_s$ increased:
  $\bar {F} = 3.3\ \textrm {N}\ \textrm {m}^{-1}$ for
  $L_s = 6.0\ \textrm {cm}$ and
  $\bar {F} = 2.2\ \textrm {N}\ \textrm {m}^{-1}$ for
  $L_s = 10.0\ \textrm {cm}$. That is, as
  $L_s$ increased, the impulse of the leading vortex pair increased, but the force imposed on the surrounding fluid decreased in the time-averaged sense.
Next, regarding the effect of  $B$, the peak hydrodynamic impulse
  $I_{x, peak}$ was found to increase as
  $B$ increased (figure 11b);
  $I_{x, peak}$ was 1.2, 1.5 and 2.2 for
  $B = 1.9\ \textrm {kN}\ \textrm {m}$,
  $3.6\ \textrm {kN}\ \textrm {m}$ and
  $12.8\ \textrm {kN}\ \textrm {m}$, respectively. Although a narrower jet with a smaller
  $d_c$ formed as
  $B$ increased, a greater impulse was transferred to the surrounding fluid because the peak vorticity
  $\omega _z d/U_p$ increased significantly with
  $B$ (figure 12b). In contrast to the cases shown in figure 11(a), the time to reach the instance (
 $c$) in figure 4 was independent of
  $B$ (figure 11b). However, the leading vortex pair formed and was pinched-off quickly at a higher
  $B$; i.e.
  $t_s$ became smaller. Accordingly, the order in
  $I_{x,peak}$ was consistent with the order in the time-averaged force
  $\bar {F}$ among the three cases in figure 11(b). That is,
  $\bar {F}$ also increased with
  $B$.
$B$.
We define a dimensionless hydrodynamic impulse  $I^*$ to show how this quantity is affected by the dimensionless bending rigidity
  $B^*$ for all values of
  $L_s$,
  $B$ and
  $U_p$ considered in this study.
 \begin{equation} I^* = \frac{I_{x,peak}}{\frac{1}{2}\rho_f U_p^2 d t_s} = \frac{\bar{F}}{\frac{1}{2}\rho_f U_p^2 d}. \end{equation}
Here,  $I^*$ is actually the time-averaged force per unit depth,
  $\bar {F}$, normalized by
  $0.5\rho _f U_p^2 d$, the product of the characteristic fluid pressure inside the channel and the channel width. The
  $I^*$ reflects how much the hydrodynamic impulse of the generated jet can be enhanced by the eversion of the sheets, given the work by the fluid volume inside the channel through the piston motion.
According to figure 13,  $I^*$ tended to increase with
  $B^*$. Although the slope of the curve was large in the small
  $B^*$ regime, it gradually decreased with increasing
  $B^*$. The
  $I^*$ values for all cases with the sheets were greater than the value without the sheets (
 $I^* = 1.9$). The reason behind such a trend can be found from the faster unfolding motion as
  $B^*$ increased (figure 8b), which was directly linked to the generation of stronger vorticity resulting in the formation of a stronger leading vortex pair. In addition, the rapid decrease in the elastic strain energy
  $E_s$ during the rapid unfolding motion of the sheets was correlated with the momentum transferred to the flow (figure 5d). As
  $B^*$ increased, the maximum strain energy
  $E^*_{s,max}$ became larger (figure 8c), and a greater momentum was transferred to the flow through the eversion process.

Figure 13. Dimensionless hydrodynamic impulse  $I^*$ with respect to dimensionless bending rigidity
  $B^*$. Each point represents the value averaged over 4–5 repeated experiments, and error bars denote the standard deviation.
By virtue of the momentum transferred to the flow by the eversion process, the impulse of the jet was always greater than the fluid momentum applied by the piston motion alone. Thus, as  $B^*$ increased, the contribution of the everting sheets to the resultant jet became increasingly dominant, and consequently the dimensionless impulse of the jet was enhanced. Although the precise relationships among the parameters were not derived in this study, the trends in
  $d_c/d$,
  $U_c/U_p$ and
  $I^*$ with respect to
  $B^*$ in figures 10 and 13 demonstrate that the dynamic characteristics of starting jet formation are strongly coupled with the kinematic and geometric parameters of the everting structure.
4. Concluding remarks
We have experimentally investigated the formation of a starting jet through the eversion of two clamped elastic sheets. As the elastic strain energy stored in the everted sheets is transferred to the flow through their flip-over process, a much faster starting jet with an improved hydrodynamic impulse can be produced within a shorter stroke time, compared with the case in the absence of the sheets. The length and bending rigidity of the sheets, and the speed of the piston have significant effects on the kinematics of the sheets and the formation of the jet. These effects can be characterized using a dimensionless bending rigidity parameter that includes these three variables. As the dimensionless bending rigidity increases, the maximum tip angle of the sheet and the corresponding dimensionless time decrease. Furthermore, the maximum elastic strain energy of the everted sheets increases, and the sheets are flipped over faster. The behaviour of the sheets during the eversion process also affects the characteristics of the starting jet. With increasing dimensionless bending rigidity, the width of the jet tends to decrease, whereas the speed at the centre of the jet tends to increase. The dimensionless hydrodynamic impulse, which indicates how effectively the fluid force is generated by the stroke of the piston and its interaction with the everted sheets, becomes stronger as the dimensionless bending rigidity increases. In conclusion, the rapid flipping motion during the eversion process can be regarded as the key mechanism for the formation of a fast jet with an improved hydrodynamic impulse.
As a preliminary study, our model is limited to two dimensions to simplify the dynamics of the everting structure. Although an axisymmetric cylindrical elastic structure would be more practical in engineering applications using the eversion process, this study on the coupling between an everting structure and a jet flow offers insights into the design of medical devices for delivering fluids rapidly as a focused jet at once, such as in the treatment of total occlusions in blood vessels or transdermal drug delivery. In the future, we plan to investigate the effects of 3-D everting structures on vortex ring formation and explore whether the use of the eversion process is hydrodynamically advantageous in small-scale models.
Supplementary movie
Supplementary movie is available at https://doi.org/10.1017/jfm.2021.609.
Funding
This research was supported by the Basic Science Research Program through the National Research Foundation of Korea (NRF) funded by the Ministry of Science and ICT (NRF-2020R1A2C2102232), and the Human Resources Program in Energy Technology of the Korea Institute of Energy Technology Evaluation and Planning (KETEP) granted financial resource from the Ministry of Trade, Industry & Energy, Republic of Korea (No. 20204030200050).
Declaration of interests
The authors report no conflict of interest.


