


1. Introduction
Multiphase flows of polymer solutions represent a prototypical viscoelastic flow that is relevant for many practical applications including fuel development (Jaffe & Allam Reference Jaffe and Allam2015), oil recovery (Li et al. Reference Li, Jing, He, Ren and Wei2016), hydraulic fracturing (Lai et al. Reference Lai, Rallabandi, Perazzo, Zheng, Smiddy and Stone2018b), sprays (Keshavarz et al. Reference Keshavarz, Houze, Moore, Koerner and McKinley2016) and jet-based printing and deposition techniques (Arnold, Serra & Piqué Reference Arnold, Serra and Piqué2007; Ponce-Torres et al. Reference Ponce-Torres, Montanero, Vega and Gañán-Calvo2016). Due to the wide range of applications of viscoelastic materials, there have been numerous attempts to model the underlying dynamics of polymer solutions. In particular, the thinning and breakup of viscoelastic liquids has attracted attention because of the formation of the beads-on-a-string structure (Goldin et al. Reference Goldin, Yerushalmi, Pfeffer and Shinnar1969), in which a uniform filament develops into a series of well-spaced drops connected by thin threads. Various earlier modelling studies (e.g. Clasen et al. Reference Clasen, Eggers, Fontelos, Li and McKinley2006; Ardekani, Sharma & McKinley Reference Ardekani, Sharma and McKinley2010) have investigated the capillary thinning of viscoelastic filaments and formation of this structure by using one-dimensional models to solve for the polymeric stresses during the thinning. One-dimensional models have been used conventionally to tackle this problem due to their relative simplicity and the numerical stiffness of two-dimensional models (Dealy Reference Dealy2010). One-dimensional models rely on the long-wave approximation and slender jet equations (Eggers & Fontelos Reference Eggers and Fontelos2015), which by definition cannot capture the jet dynamics during the later stages of the thinning when the jet geometry consists of an array of drops connected by thin filaments. Also, the one-dimensional model cannot capture the radial change of the velocity components and the off-diagonal components of the stress tensor, which are important parameters especially for the later stages of the thinning (Fernandez & Ganan-Calvo Reference Fernandez and Ganan-Calvo2020).
Viscoelastic liquid jet formation and droplet breakup phenomena have also been studied using two-dimensional models (e.g. Bousfield et al. Reference Bousfield, Keunings, Marrucci and Denn1986; Foteinopoulou, Mavrantzas & Tsamopoulos Reference Foteinopoulou, Mavrantzas and Tsamopoulos2004) and the finite-element method as detailed in Szady et al. (Reference Szady, Salamon, Liu, Bornside, Armstrong and Brown1995) and Bhat, Basaran & Pasquali (Reference Bhat, Basaran and Pasquali2008). The polymeric stress tensor in these studies is obtained using a conformation-tensor based formalism (e.g. Pasquali & Scriven Reference Pasquali and Scriven2002, Reference Pasquali and Scriven2004). This method has proved to be very robust in simulating viscoelastic liquid filaments of various non-Newtonian rheologies, including the Oldroyd-B (Bhat et al. Reference Bhat, Appathurai, Harris, Pasquali, McKinley and Basaran2010), Giesekus and PTT (Bhat, Pasquali & Basaran Reference Bhat, Pasquali and Basaran2009) constitutive equations, and identifying the parameters effective during the formation of beads-on-a-string structure and their dynamics. Among these, the Oldroyd-B model has been used to represent ideally elastic liquids, the Giesekus model has been used to represent elastic liquids that exhibit shear thinning (Öztekin, Brown & McKinley Reference Öztekin, Brown and McKinley1994), and the PTT model has been used mostly in the modelling of polymer melts (Ferrás et al. Reference Ferrás, Morgado, Rebelo, McKinley and Afonso2019).
One of the biggest challenges in such studies is the numerical stiffness arising from the constitutive equations for liquids that exhibit larger elastic stresses. In a previous study (Turkoz et al. Reference Turkoz, Lopez-Herrera, Eggers, Arnold and Deike2018b), we used the log-conformation technique (Fattal & Kupferman Reference Fattal and Kupferman2005) to overcome the numerical stiffness issue associated with the governing equations (López-Herrera, Popinet & Castrejón-Pita Reference López-Herrera, Popinet and Castrejón-Pita2019), and presented direct numerical simulations of the two-phase axisymmetric momentum equations, including the Oldroyd-B model, for capillary thinning of a viscoelastic liquid bridge. Our simulations produced flow parameters that agree with the theory (Clasen et al. Reference Clasen, Eggers, Fontelos, Li and McKinley2006) including the rate of thinning and the axial component of the stress tensor, but fell short of capturing the evolution of the jet profile that was observed in the experiments. In a more recent study (Eggers, Herrada & Snoeijer Reference Eggers, Herrada and Snoeijer2019), similarity solutions are discussed for the thinning of viscoelastic filaments.
In this study we investigate the dynamics of jets produced from viscoelastic liquid films. Such a configuration is especially relevant for drop-on-demand printing applications such as inkjet printing and the laser direct-write technique. We use a laser direct-write technique called blister-actuated laser-induced forward transfer (BA-LIFT) to actuate jets from viscoelastic liquid films (Turkoz, Fardel & Arnold Reference Turkoz, Fardel and Arnold2018a).
Blister-actuated laser-induced forward transfer is a nozzleless jet-based printing technique where the energy of a laser pulse is converted into mechanical energy through a rapidly expanding blister on a solid film (Turkoz et al. Reference Turkoz, Fardel and Arnold2018a), which in turn deforms the liquid film initially coated on the solid film. In this technique a laser pulse is absorbed by the solid layer, which in turn deforms rapidly and forms a plastically deformed blister. The rapid expansion provides the pressure gradient required for jet formation from the liquid film. A detailed analysis of the impulsive solid boundary deformation and the resulting momentum transfer to the liquid film is presented in Brasz et al. (Reference Brasz, Arnold, Stone and Lister2015), where it was shown that the remnant momentum in the liquid film creates a velocity field that results in jet formation. Viscoelastic liquid jets induced from shear-thinning aqueous polyelectrolyte solutions formed using this technique were analysed before (Turkoz et al. Reference Turkoz, Perazzo, Kim, Stone and Arnold2018c) to predict different printing regimes by combining the rheology and parameters regarding the solid boundary deformation. A variant of this technique, where a laser pulse is directly absorbed by the liquid film, is used to study the jets formed from viscoplastic fluids (Jalaal et al. Reference Jalaal, Schaarsberg, Visser and Lohse2019), including predicting the velocity of formed jets and generation of a deposition regime diagram. A recent review of various other laser-induced forward applications can be found in Piqué & Serra (Reference Piqué and Serra2018). In this study we are interested in the formation of a viscoelastic jet as a result of mechanical solid boundary deformation, which is followed by thinning of the filament and droplet formation.
For jet-based printing and deposition techniques, the placement of the acceptor surface, which is the surface to be printed on, relative to the maximum jet extension length is a critical factor in determining the amount of deposited material. Previous studies (Unger et al. Reference Unger, Gruene, Koch, Koch and Chichkov2011; Zhang et al. Reference Zhang, Xiong, Corr and Huang2016; Turkoz et al. Reference Turkoz, Perazzo, Deike, Stone and Arnold2019b) have shown that the gap between the donor surface, which is the surface that hosts the liquid film where the jet is induced from, and the acceptor surface can determine if the induced jet would result in a quicker single-drop deposition, or a longer lasting beads-on-a-string deposition for a viscoelastic liquid. Similarly, the time to reach this maximum length determines the amount of time required between printing of each voxel. Therefore, these two parameters, the maximum jet length and the time to reach the maximum jet length, are of critical importance for practical applications in printing techniques. We also note that descriptions of the jet time evolution, including velocity, maximum extension and width are the parameters discussed in theoretical studies of jet ejection in various geometries (Fernandez & Ganan-Calvo Reference Fernandez and Ganan-Calvo2020).
The thinning of a viscoelastic filament involves the balance of inertial, viscous, capillary and elastic stresses. The strength of these stresses is conventionally expressed by identifying relevant time scales. The inertia-capillary time scale is defined as  $t_c = \sqrt {\rho H_f^3/\gamma }$, where
  $\rho$ is the liquid density,
  $\gamma$ is the liquid–air surface tension and
  $H_f$ is the liquid film thickness, which determines the length scale of the liquid jet radius (Turkoz et al. Reference Turkoz, Perazzo, Kim, Stone and Arnold2018c). The viscous-capillary time scale is expressed as
  $t_{\nu }=\mu H_f/\gamma$, where
  $\mu = \mu _s + \mu _p$ is the liquid viscosity,
  $\mu _s$ is the contribution coming from the solvent viscosity and
  $\mu _p$ is the polymeric contribution to viscosity. The elastic time scale is the relaxation time
  $\lambda$, which is the time for the strain to relax when the stress is removed (Rubinstein & Colby Reference Rubinstein and Colby2003). We evaluate dimensionless parameters using the time scales defined above to compare the governing forces, and we define the Deborah number,
  $De$, Ohnesorge number,
  $Oh$, and the viscosity ratio,
  $\beta$, as follows (Turkoz et al. Reference Turkoz, Lopez-Herrera, Eggers, Arnold and Deike2018b):
 \begin{equation} De = \frac{\lambda}{t_c} = \frac{\lambda}{\sqrt{\rho H_f^3/\gamma}},\quad Oh = \frac{t_v}{t_c}= \frac{\mu}{\sqrt{\rho H_f \gamma}},\quad \beta = \frac{\mu_s}{\mu} = \frac{\mu_s}{\mu_s + \mu_p}. \end{equation}
In addition to these dimensionless parameters, the problem is fully determined by two additional parameters  $\mu _a/\mu$, and
  $\rho _a/\rho$, which are the ratios of the ambient air viscosity to the liquid viscosity, and ambient air density to the liquid density, respectively. These latter two ratios are much less than one and do not influence the undergoing dynamics for aqueous polymer solutions in ambient air.
In this paper we present experiments and numerical simulations for the BA-LIFT of viscoelastic liquids. The numerical simulations build on two already established and validated numerical models on BA-LIFT and viscoelastic modelling. In Turkoz et al. (Reference Turkoz, Lopez-Herrera, Eggers, Arnold and Deike2018b) we performed direct numerical simulations of viscoelastic filament thinning using the Basilisk open source flow solver (López-Herrera et al. Reference López-Herrera, Popinet and Castrejón-Pita2019), while in Turkoz et al. (Reference Turkoz, Kang, Du, Deike and Arnold2019a) we presented direct numerical simulations of BA-LIFT with Newtonian liquids. These simulations captured the ejected droplet size, breakup time, and jet profile in good agreement with the BA-LIFT experiments performed using Newtonian liquids. Here, we combine these recent advances to investigate the effects of the elasticity on viscoelastic liquid jet formation, and their properties, such as jet length, jet thickness and potential droplet size.
The paper is structured as follows. First, in § 2 we introduce the problem statement, the experimental realization of BA-LIFT, the blister shape description, and the numerical methods and numerical model used to simulate the formation of jets from viscoelastic liquids. This section introduces a dimensionless energy parameter,  $E_b/E_{\gamma }$, that compares the energy deposited to generate the jet with the surface tension energy resisting the jet formation from a liquid thin film and which will be used to compare experiments with simulations for various blister shapes. In § 3 we present experiments on viscoelastic jets at high Deborah numbers for two representative values of
  $Oh$ and laser energy. We present the corresponding numerical simulations performed at lower Deborah numbers but with other parameters the same. We identify a high-Deborah-number regime for
  $De>100$ that allows comparison of the experiments and simulations. In § 4 we present a study at the Newtonian breakup threshold energy, varying
  $Oh$ and we discuss the properties of the resulting viscoelastic jet, its maximum extension length and the time the maximum is obtained. In § 5 we extend the parameter sweep for various laser energy values, and discuss the effects of viscoelasticity on the maximum jet length and the maximum extension time. We discuss how to compare all of the data sets presented in this paper and discuss scaling relationships to describe the maximum jet extension and time of maximum extension. In § 6 we present conclusions and recommendations.
2. Formulation of the problem
2.1. Principles of BA-LIFT
We recall the principle of the laser direct-write technique called BA-LIFT, which we use to actuate jets from viscoelastic liquid films (Turkoz et al. Reference Turkoz, Fardel and Arnold2018a). The schematic illustrating how this process works is presented in figure 1(a). An example blister profile is shown with a colour-coded depth profile in figure 1(b). The jets are created through the mechanical impulse provided by a rapidly expanding blister in a solid boundary, which is coated with the viscoelastic liquid layer. The physics of the early times of jet formation from Newtonian liquids has been investigated in a previous study (Brasz et al. Reference Brasz, Arnold, Stone and Lister2015), where it was shown that the remnant momentum in the liquid layer after the blister formation is directed towards the centre of the blister and results in jet formation.

Figure 1. The experimental set-up of the BA-LIFT process. (a) Schematic of jet formation with BA-LIFT. We use a 20 ns laser pulse of varying energies with 355 nm wavelength. The pulse is absorbed by the solid polyimide (PI) layer, which forms a rapidly expanding blister. The jet forms after a certain time  ${\rm \Delta} t$, which is the order of microseconds after which there is reversal of the remnant momentum in the liquid film towards the centre of the blister (Brasz et al. Reference Brasz, Arnold, Stone and Lister2015). The PI layer shields the liquid from heating effects (Brown, Kattamis & Arnold Reference Brown, Kattamis and Arnold2011) and the jet formation takes place due to the mechanical impulse supplied by the blister. (b) An example blister profile measured using confocal microscopy. The blister height is
  $H_b=6.2\ \mathrm {\mu }$m and radius is
  $R_b\approx 25\ \mathrm {\mu }$m. An empirical formula (Brown et al. Reference Brown, Brasz, Ventikos and Arnold2012) is fitted to the generated blisters and used in simulations to represent the expanding elastic boundary as explained in § 2.2.
2.2. Solid boundary deformation
The rapid formation of the blister on a solid polyimide film was derived empirically in previous studies (Kattamis, Brown & Arnold Reference Kattamis, Brown and Arnold2011; Brown et al. Reference Brown, Brasz, Ventikos and Arnold2012). For the sake of completeness, the formulation for the deformation of the solid boundary is also presented here. The blister profile is expressed as  $\delta (r,E,t) = X(r,E)T(t)$, where
  $X(r,E)$ and
  $T(t)$ define the energy-dependent (
 $E$ in
  $\mu$J) blister profile and the time dependence, respectively. The blister profile is expressed empirically as
 \begin{equation} X(r,E) = H_b(E) \left(1-\left(r/R_b(E) \right)^2 \right)^C \end{equation}
expressed in  $\mathrm {\mu }$m and the time-dependent function is expressed as
 \begin{equation} T(t) = (2/{\rm \pi})\textrm{arctan}(t/\tau_b), \end{equation}
where  $H_b(E)=-0.0093E^2 + 2.5708E-9.2618$ is the blister height (in
  $\mathrm {\mu }$m),
  $R_b(E)=18.117\ln (E) - 12.887$ is the blister radius (in
  $\mathrm {\mu }$m),
  $C$ is a shape coefficient and
  $\tau _b=23.5 \times 10^{-9}$ s is the characteristic time scale for blister formation (Kattamis et al. Reference Kattamis, Brown and Arnold2011) set by the laser used in this study. The blister profiles for a shape factor
  $C=1.25$ are presented in figure 2(a), and correspond to the profiles fitted to blisters generated with a top-hat beam shape (Brown et al. Reference Brown, Brasz, Ventikos and Arnold2012). The expression presented in (2.1) can be used to fit blister profiles generated by using other beam shapes, i.e. Gaussian, by replacing
  $H_b(E)$ and
  $R_b(E)$ with the corresponding measured blister height and radius, respectively. The shape coefficient
  $C$ can be obtained as the result of this fit, and in this study we present experimental and numerical studies performed with blisters with shape coefficients
  $C=4.713$ and
  $C=3.778$ as detailed in next section, and typical of laboratory studies on BA-LIFT. Blister-actuated laser-induced forward transfer simulations using a Gaussian beam and blister profile are presented in Turkoz et al. (Reference Turkoz, Kang, Du, Deike and Arnold2019a), where the simulations could reproduce the profiles of jets created from Newtonian liquid films. The blister configurations used in this study are presented in table 1 and again in table 2.

Figure 2. Deformation of the elastic boundary and the energy input into the liquid layer for five different laser pulse energies. (a) The steady-state blister profiles obtained using the empirical formula presented in § 2.2 (Brown et al. Reference Brown, Brasz, Ventikos and Arnold2012) with five different laser energy  $E_L$ values and (b) the total dimensionless energy supplied into the system
  $\bar {E}_b (E,t)/E_{\gamma }$ as a function of time
  $t/\tau _b$. The formulae for blister height
  $H_b$ and radius
  $R_b$ are given in the text with the formula to calculate
  $E_b$, which is the final value of total energy deposited (2.3) as a function of time
  $E_b = \int _0^{\infty } \bar {E}_b (E,t)\,\textrm {d} t$. The characteristic blister expansion time
  $\tau _b$ is set by the laser. For the experiments in this study, this value is
  $\tau _b = 23.5 \times 10^{-9}$ s (Brown et al. Reference Brown, Brasz, Ventikos and Arnold2012). The surface tension energy is formulated as
  $E_{\gamma } \equiv {\rm \pi}\gamma H_b H_f$, where
  $\gamma$ is the surface tension and
  $H_f$ is the liquid film thickness.
Table 1. Range of blister height ( $H_b$), radius (
 $R_b$) and shape coefficient (
 $C$) values used in this study. Solid boundary deformation is implemented by using the formula presented in (2.1) with the values presented in this table.

Table 2. Simulation configurations presented in § 5 with the  $Oh$,
$Oh$,  $E_{ve}$,
  $E_b/E_{\gamma }$ and
  $H_f$ parameters. A sweep in
  $De$ is performed for each of these configurations.

Due to the inherent energy losses associated with the absorption of the laser pulse energy by the polymer layer during BA-LIFT, the actual energy deposited into the liquid is smaller than the laser pulse energy. To calculate the energy deposited in the liquid, the time-dependent motion of the blister can be used along with the no-slip boundary condition, so that the expansion of the elastic boundary into a blister deposits energy into the liquid film. The formulae presented here can be used to calculate the total amount of energy  $E_b$ deposited into the liquid layer by integrating the velocity profile in space and time as
 \begin{equation} E_b(E) = \int_0^{\infty} \bar{E}_b (E,t)\,\textrm{d} t = \int_0^{\infty} \left( \int_{0}^{R_b(E)} \rho U_b^2(r,E,t) 2{\rm \pi} r X(r,E) T(t)\,\textrm{d} r \right)\textrm{d} t, \end{equation}
where  $\bar {E}_b (E,t)$ is the time-dependent kinetic energy, and
  $U_b(r,E,t)$ is the blister velocity, which is defined as
 \begin{equation} U_b(r,E,t) = \frac{\partial\delta(r,E,t)}{\partial t} = \frac{H_b(E)}{\tau_b} \left( 1- \left( \frac{r}{R_b(E)} \right)^2 \right)^C \left(\frac{2}{\rm \pi} \right) \left( \frac{1}{1 + t^2/\tau_b^2} \right). \end{equation}
 To calculate a dimensionless parameter for the energy, the energy associated with the blister formation  $E_b$ is divided by the energy associated with the resisting capillary effects due to the liquid film. We evaluate the energy stored in the corresponding deformation of the liquid–air boundary as
  $E_{\gamma } \equiv {\rm \pi}\gamma H_b H_f$. We use
  $E_b/E_{\gamma }$ to identify the relative effect of the energy supplied by the laser pulse. Similarly, the time-dependent ratio
  $\bar {E}_b/E_{\gamma }$ shows how the energy is deposited as a function of time. This ratio for various laser pulse energies used in this study for
  $H_f = 5\ \mathrm {\mu }$m layer and
  $\gamma = 0.072$ N m
 $^{-1}$ liquid–air surface tension is presented in figure 2(b), where the value of
  $\bar {E}_b/E_{\gamma }$ is plotted as a function of dimensionless time
  $t/\tau _b$. The energy reaches a maximum as the blister expansion stops after a certain amount of time, which means that almost all of the kinetic energy is deposited into the fluid by about
  $4\tau _b \approx 100$ ns.
Overall, the impulsive jet formation from a viscoelastic liquid through rapid blister deformation is defined by the non-dimensional numbers  ${De}$,
  ${Oh}$ and
  $\beta$ introduced above along with the liquid–air density and viscosity ratios,
  $\rho _a/\rho _s$ and
  $\mu _a/\mu _s$, which are expected to have small effects in the limit of small ratios, together with the laser energy represented by
  $E_b/E_{\gamma }$. Note that the geometry of the blister is only partially accounted for in the energy ratio and will be of importance when comparing the various blister shapes. Results presented in this study will have the length scale normalized by
  $H_f$ and the time
  $t$ normalized by either the inertia-capillary time scale
  $t_c$, or the viscous time scale
  $t_{\nu }$, as noted below.
2.3. Oldroyd-B equations
Elasticity affects the filament thinning and breakup by introducing another resistance due to elastic stresses. In the literature, these stresses are accounted for by introducing a constitutive equation. There are various models in the literature to evaluate the polymeric stresses. We begin with the momentum equation for a polymeric solution,
 \begin{equation} \rho \left(\frac{\partial \boldsymbol{u}}{\partial t} + \boldsymbol{u} \boldsymbol{\cdot} \boldsymbol{\nabla} \boldsymbol{u} \right) = -\boldsymbol{\nabla} p + \boldsymbol{\nabla} \boldsymbol{\cdot} \boldsymbol{\sigma}, \end{equation}
where the total stress tensor has two components  $\boldsymbol {\sigma } = \boldsymbol {\sigma }_s + \boldsymbol {\sigma }_p$. The solvent viscous stress tensor has the usual definition
  $\boldsymbol {\sigma }_s = 2 \mu _s \boldsymbol{\mathsf{D}}$, where
  $\mu _s$ is the solvent viscosity and
  ${\boldsymbol{\mathsf{D}} = (\boldsymbol {\nabla } \boldsymbol {u} + \boldsymbol {\nabla } \boldsymbol {u}^\textrm {T})/2}$ is the strain-rate tensor. If the polymeric stress
  $\boldsymbol {\sigma }_p=\boldsymbol {0}$, (2.5) reduces to the Navier–Stokes equation.
One of the most commonly used constitutive equation for  $\boldsymbol {\sigma }_p$ is the Oldroyd-B equation (Oldroyd Reference Oldroyd1950), which is expressed as (Ardekani et al. Reference Ardekani, Sharma and McKinley2010)
 \begin{equation} \frac{\textrm{D} \boldsymbol{\sigma}_p}{\textrm{D} t} = \left(\boldsymbol{\nabla} \boldsymbol{u} \right)^\textrm{T} \boldsymbol{\cdot} \boldsymbol{\sigma}_p + \boldsymbol{\sigma}_p \boldsymbol{\cdot} (\boldsymbol{\nabla} \boldsymbol{u}) - \frac{1}{\lambda}\boldsymbol{\sigma}_p + \frac{\mu_p}{\lambda} (\boldsymbol{\nabla} \boldsymbol{u} + (\boldsymbol{\nabla} \boldsymbol{u})^\textrm{T}), \end{equation}
where  $\mu _p$ is the polymer viscosity and
  $\lambda$ is the relaxation time. Conventionally, this equation is expressed as
 \begin{equation} \boldsymbol{\sigma}_p + \lambda \overset{\triangledown}{\boldsymbol{\sigma}}_p = 2\mu_p \boldsymbol{\mathsf{D}}, \end{equation}
where  $\overset {\triangledown }{\boldsymbol {\sigma }}_p$ denotes the upper convected time derivative of
  $\boldsymbol {\sigma }_p$,
 \begin{equation} \overset{\triangledown}{\boldsymbol{\sigma}}_p \equiv \frac{\partial \boldsymbol{\sigma}_p }{\partial t} + \boldsymbol{u}\boldsymbol{\cdot} \boldsymbol{\nabla} \boldsymbol{\sigma}_p - (\boldsymbol{\nabla} \boldsymbol{u})^\textrm{T} \boldsymbol{\cdot} \boldsymbol{\sigma}_p - \boldsymbol{\sigma}_p \boldsymbol{\cdot} \boldsymbol{\nabla} \boldsymbol{u}. \end{equation}
The dimensionless form of these equations was given previously (e.g. Ardekani et al. Reference Ardekani, Sharma and McKinley2010; Li, Yin & Yin Reference Li, Yin and Yin2017) and presented in appendix A. A key feature of the Oldroyd-B model is that the filament never breaks up as there is no imposed limit for the axial stress (Renardy Reference Renardy1995; Sattler et al. Reference Sattler, Gier, Eggers and Wagner2012). Therefore, filament breakup observed with the Oldroyd-B model is a numerical breakup related to limits in grid resolution, due to the fact that the filament radius becomes smaller than the smallest grid size. If a small or adaptive grid size is applied, the filament may continue to thin and the axial stress would keep increasing to non-physical magnitudes, as shown in Turkoz et al. (Reference Turkoz, Lopez-Herrera, Eggers, Arnold and Deike2018b), for example. An effort dedicated to overcome this numerical and physical problem is the development of the FENE-P model, which limits the increase in the axial stress. The experiments performed with Boger fluids, which are fluids that exhibit elasticity but do not have shear-rate dependent viscosity, show that the droplet breakup does not take place through neck formation between the filament and the drop, but it takes place near the centre of the filament (Tirtaatmadja, McKinley & Cooper-White Reference Tirtaatmadja, McKinley and Cooper-White2006), and the FENE-P model has not been successful at reproducing this feature. The breakup with this model takes place at the neck between the drop and filament as for a Newtonian filament (Eggers et al. Reference Eggers, Herrada and Snoeijer2019).
In this study we use the Oldroyd-B model as it has been used widely in the literature (e.g. Clasen et al. Reference Clasen, Eggers, Fontelos, Li and McKinley2006; Ardekani et al. Reference Ardekani, Sharma and McKinley2010; Bhat et al. Reference Bhat, Appathurai, Harris, Pasquali, McKinley and Basaran2010) to model Boger fluids. We have no droplet breakup in our simulations when we use the Oldroyd-B rheology, as we increase the grid resolution as necessary depending on the dimensionless parameters. We note that high  $De$ and low
  $Oh$ cases require finer grids.
2.4. Numerical methods: the Basilisk flow solver
We examine the ejection from a viscoelastic liquid film by using direct numerical simulations of an Oldroyd-B fluid and solving the axisymmetric two-phase incompressible momentum equations including surface tension, using the open source solver Basilisk (Popinet Reference Popinet2009, Reference Popinet2015, Reference Popinet2018). The Basilisk package is a free software program which can be used to solve a variety of partial differential equation systems on regular adaptive Cartesian meshes (Popinet Reference Popinet2009). For this study, we use it to solve the nonlinear incompressible momentum equations (2.5) for two phases with variable density and surface tension. The interface between the high-density viscoelastic liquid and the low-density ambient air is reconstructed by a volume-of-fluid (VOF) method, which has been validated for complex multiphase flows such as breaking waves (Deike, Melville & Popinet Reference Deike, Melville and Popinet2016; Mostert & Deike Reference Mostert and Deike2020), bubble bursting (Deike et al. Reference Deike, Ghabache, Liger-Belair, Das, Zaleski, Popinet and Séon2018; Lai, Eggers & Deike Reference Lai, Eggers and Deike2018a; Berny et al. Reference Berny, Deike, Séon and Popinet2020), impact of viscoelastic liquids (López-Herrera et al. Reference López-Herrera, Popinet and Castrejón-Pita2019) and viscoelastic thinning (Turkoz et al. Reference Turkoz, Lopez-Herrera, Eggers, Arnold and Deike2018b). Adaptive Cartesian meshing combined with the VOF method has the advantage of preserving sharp interfaces, where the transition from one phase to another takes place within one cell (Popinet Reference Popinet2018), while minimizing the appearance of spurious numerical parasitic currents (Popinet Reference Popinet2009). In this study we have investigated  $Oh$ ranging from 0.01 to 1.0; and
  $De$ from 1 up to 500. Using a similar numerical framework, López-Herrera et al. (Reference López-Herrera, Popinet and Castrejón-Pita2019) and Turkoz et al. (Reference Turkoz, Lopez-Herrera, Eggers, Arnold and Deike2018b) have investigated problems involving viscoelastic droplets and filaments for
  $De$ ranging from 0 to 175 and for
  $Oh$ ranging from 1.5 to 26.
We focus on the behaviour of Oldroyd-B jets for increasing Deborah number and investigate how well this framework can describe the experimental characteristics of elastic liquid jets. Within the Oldroyd-B framework, the liquid jets do not breakup, so that we consider experimental cases at fairly high  $De$ number that also do not breakup. As discussed in detail in the paper, we discuss the asymptotic behaviour of Oldroyd-B jets at high
  $De$ number by comparing the experimental and numerical characteristics of high
  $De$ liquid jets.
The implementation of the deformation of the elastic boundary, so as to represent the blister, is very important for the accuracy of the simulations. We implement a moving boundary condition, as prescribed by (2.1) and (2.2). The numerical stiffness of the governing equations is overcome by using the log-conformation technique (López-Herrera et al. Reference López-Herrera, Popinet and Castrejón-Pita2019), where the matrix logarithm of the exponentially growing stress tensor is tracked in time. We used a multigrid solver with constant grid size throughout the computational domain. The results become grid independent when we use about 128 grid points along the thickness of the liquid film. The details of the grid convergence study are presented in appendix B.
3. Experiments at high  $De$ numbers and comparison with numerical simulations

3.1. Experimental results
We start by presenting experimental results for viscoelastic jets created by the BA-LIFT technique, which is used to generate jets from liquid films as described before and shown in figure 1. The experimental set-up itself is similar to the set-ups in our previous studies (Turkoz, Deike & Arnold Reference Turkoz, Deike and Arnold2017). The laser pulse is absorbed by the polyimide layer, which in turn results in the rapid formation of a blister as shown in figure 1(b). The videos are captured using a high-speed camera (Phantom v2012) operating at 700 000 fps using a constant LED backlight. The laser pulse is provided by a frequency-tripled Nd:YVO $_4$ laser (Coherent AVIA, 20 ns) and has a 355 nm wavelength. The laser beam diameter is approximately 20
  $\mathrm {\mu }$m. The laser pulse energies used in this study result in jets that do not breakup but retract back to the liquid film.
The viscoelastic solutions are made by adding polyethylene oxide (PEO) of 8 MDa molecular weight into deionized water (DI water) with 0.15 and 0.20 wt.% concentrations. The high molecular weight PEO makes the solutions have longer relaxation times and increased viscoelasticity (Tirtaatmadja et al. Reference Tirtaatmadja, McKinley and Cooper-White2006). The solutions created using this polymer have previously been assumed to behave like an ideal Boger fluid (Clasen et al. Reference Clasen, Eggers, Fontelos, Li and McKinley2006; Keshavarz et al. Reference Keshavarz, Houze, Moore, Koerner and McKinley2016), which is a viscoelastic liquid that does not exhibit a shear-rate dependent shear viscosity. The density of the solutions  $\rho$ is assumed to be 1000 kg m
 $^{-3}$ and the surface tension
  $\gamma$ is taken as 70 mN m
 $^{-1}$. We measured the shear viscosity values of the solutions in a previous study (Turkoz et al. Reference Turkoz, Perazzo, Deike, Stone and Arnold2019b) as 4.0 and 6.5 mPa s for 0.15 wt.% and 0.20 wt.%, respectively. The liquid film thicknesses are measured as
  $H_f=8.2 \pm 1.1$ and
  $H_f=10.5 \pm 2.5\ \mathrm {\mu }$m for 0.15 wt.% and 0.20 wt.%, respectively. These values correspond to viscosity ratio,
  $\beta$, values of 0.23 and 0.13 for the respective cases (the effect of viscosity ratio, β, on jet parameters is presented in appendix C). Similarly, the elongational relaxation times were reported as
  $2.5 \pm 0.3$ and
  $6.6 \pm 1.3$ ms for 0.15 wt. and %, 0.20 wt., respectively. The relaxation times are measured by tracking the filament thinning of a falling viscoelastic liquid jet as explained in Roché, Kellay & Stone (Reference Roché, Kellay and Stone2011) and Anna & McKinley (Reference Anna and McKinley2001). The minimum radius of a falling jet,
  $h_{min}$, decreases as a function of time following the functional form
  $h_{min} \propto \exp ((t_0 -t)/3\lambda )$, where
  $t_0$ is the initial time step of the measurement, and
  $\lambda$ is the relaxation time of the viscoelastic liquid. The laser pulse energy used to generate the jets for 0.20 wt% results in a blister whose height is
  $H_b = 6.2\ \mathrm {\mu }$m and radius is
  $R_b=25\ \mathrm {\mu }$m with the blister shape coefficient determined as
  $C=4.713$. The resulting Ohnesorge number for this case is
  $Oh=0.26$ and the Deborah number is
  $De=2065$. The dimensionless energy ratios is
  $E_b/E_{\gamma } = 26.48$. In addition, the laser pulse energy used to generate the jets for 0.15 wt% results in a blister whose height is
  $H_b = 7.9\ \mathrm {\mu }$m and radius is
  $R_b=25\ \mathrm {\mu }$m. The blister shape coefficient is determined as
  $C=3.778$. The Ohnesorge number is calculated as
  $Oh=0.16$ and the Deborah number is calculated as
  $De=393$. For this case, the dimensionless energy parameters are determined as
  $E_b/E_{\gamma } = 44.97$.
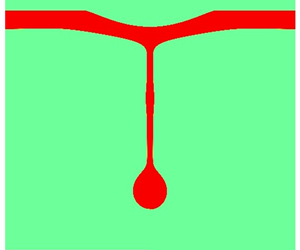
A set of images of the jet formation process is presented in figure 3. The images show that the formed jet reaches its maximum at about  $18.5\ \mathrm {\mu }$s. It can be seen from this figure that the jet has a bulbous end attached to its tip. For the rest of this study, we refer to this bulbous end as the effective drop or droplet. The effective drop retracts completely back to the liquid film on top at about 50
  $\mathrm {\mu }$s. We note that the time scale of the process depends on the liquid film thickness and laser pulse energy, where larger film thicknesses and laser pulse energies lead to longer lasting jets. The laser pulse energy will also affect the maximum extension of the jet
  $L_{max}$, before it starts to retract back. As the laser pulse energy increases, this length also increases. While the jet length depends on the laser pulse energy supplied, the main profile of the jet is the same for the laser pulse energy values used in this study: the jet extends with an effective drop attached to it, reaches a maximum extension
  $L_{max}$, and eventually retracts back.

Figure 3. The high-speed images of a BA-LIFT experiment with 0.2 wt.% PEO solutions. The jet reaches its maximum length  $L_{max}$ at about 18
  $\mathrm {\mu }$s and retracts back in about 20
  $\mathrm {\mu }$s. We refer to the bulbous end attached at the end of the filament as the effective drop or droplet for the rest of this study. The liquid film thickness is measured as
  $H_f = 8.2 \pm 1.1\ \mathrm {\mu }$m. The scale bar represents 20
  $\mathrm {\mu }$m.
The jetting behaviour of 0.20 wt.% PEO solutions is shown in figure 4(a), with the jet length  $L_j$ as a function of time
  $t$ extracted from high-speed videos. The liquid film thickness for this case is measured as
  $8.2 \pm 1.1\ \mathrm {\mu }$m. The second experimental case, for the jetting of 0.15 wt.% PEO solutions, is shown in figure 4(b), with the jet length
  $L_j$ as a function of time
  $t$. The liquid film thickness is measured as
  $10.5 \pm 2.5\ \mathrm {\mu }$m. In both cases, we observe that the jet length initially grows, reaches a maximum value and then retracts. However, significant differences are visible between the two configurations, with maximum jet length varying by about 30 %. These differences might be attributed to the inhomogeneities in liquid film thickness. We also note that the variability of elastic deformation between different experiments can also play a role in the standard deviation of the experimental results. The variability of elastic deformation was studied by Brown, Kattamis & Arnold (Reference Brown, Kattamis and Arnold2010), with variations in the surface area and volume up to 10 %. As a consequence, when comparing with numerical simulations, we will consider the ensemble average jet profiles.

Figure 4. Experimental observation of the evolution of the jet length as a function of time for several realizations of the same experiment, for two configurations. (a) Jet length  $L_j$ as a function of time
  $t$ for 0.20 wt.% PEO. The experimental parameters are measured as
  $H_f=8.2 \pm 1.1\ \mathrm {\mu }$m,
  $Oh=0.26$,
  $De=2065$. Significant variability is observed between multiple realizations. (b) Jet length
  $L_j$ as a function of time
  $t$ for 0.15 wt.% PEO. The experimental parameters are measured as
  $H_f=10.5 \pm 2.5\ \mathrm {\mu }$m,
  $Oh=0.16$,
  $De=393$. Experimental results are obtained from high-speed videos captured at 700 000 fps.
3.2. Numerical simulations representing the experimental conditions: high-Deborah-number limit
In these experiments, the  $De$ number is much higher than what we can easily obtain through numerical simulations. It is more difficult to perform simulations for high
  $De$ due to the numerical stiffness of the viscoelastic constitutive equations (Fattal & Kupferman Reference Fattal and Kupferman2005). However, we will show that a high-Deborah-number limit is observed for viscoelastic jets, which allows comparison between experiments and computations.
We present simulations for the same  $Oh$, blister and energy configuration as used in the experiments presented in the previous section for a wide range of
  $De$, from 1 to 250 and determine the maximum jet length
  $L_{max}$ and the time of maximum extension
  $t_{max}$. The two sets of simulations correspond to the experiments previously presented, and are characterized by
  $Oh=0.26$ and
  $E_b/E_{\gamma } = 26.48$ in the first case and
  $Oh=0.16$ and
  $E_b/E_{\gamma } = 44.97$ in the second case.
Figure 5(a,b) shows snapshots of the numerical simulations of viscoelastic jets with parameters matching the experiments presented in figures 3 and 4 ( $Oh=0.26$), but for lower
  $De$ numbers, here 120 and 240. The snapshots show the formation of a relatively straight jet, a bulge forms at the tip of the jet, and then the jet retracts without breaking. The two simulations present relatively similar behaviour, with the maximum extension being reached at a later time for high
  $De$ number. The overall shape is also comparable to the experimental images. The maximum extension length
  $L_{max}$ appears to be roughly the same in these two relatively high
  $De$ numbers.

Figure 5. Snapshots of jet formation from simulations for increasing  $De$ for the experimental configuration presented in figures 3 and 4(a),
  $Oh=0.26$. The high-Deborah-number cases (a)
  $De=120$ and (b)
  $De=240$ show similar dynamics. The viscoelastic jets extend to a maximum amount of stretch
  $L_{max}$ at time
  $t_{max}$ and then start to retract back to the liquid film. (c) Maximum extension of the jet
  $L_{max}$ in the simulations (open rectangles for
  $Oh=0.26$ and diamonds for
  $Oh=0.16$) as a function of
  $De$ for the two experimental configurations. As
  $De$ increases above a threshold value,
  $L_{max}$ reaches an asymptotic value,
  $L_{max}^{\infty }$, roughly at
  $De>100$, with the plateau value close to the experimentally observed maximum extension of the jet (indicated as a full square for
  $Oh=0.26$ and a full diamond for
  $Oh=0.16$). (d) Time at which the maximum extension is reached,
  $t_{max}/t_{\nu }$ as a function of
  $De$. The time evolution can be described by a power law
  $t_{max}/t_{\nu } = c_1 De^{1/4}$, with
  $c_1\approx 0.15$ and 0.25.
Figure 5(c) shows  $L_{max}$ as a function of
  $De$ for the experiments and for the two sets of simulations, at
  $Oh=0.26$ and
  $Oh=0.16$. We observe that the maximum extension length in the simulations first increases with increasing
  $De$ number and then reaches a constant value,
  $L_{max}^{\infty }$, for
  $De>100$. The experimental value appears to match reasonably well the values obtained by numerical simulations with the experiments performed at significantly higher
  $De$ number. This asymptotic extension
  $L_{max}^{\infty }$, evaluated as the plateau value of
  $L_{max}$ at high
  $De$, appears to slightly increase with increasing viscosity (
 $Oh$).
Figure 5(d) shows the time to reach the maximum extension,  $t_{max}$, as a function of
  $De$, and this time increases with
  $De$. Note that we normalize the time
  $t_{max}$ by
  $t_{\nu }$ instead of
  $t_c$ as we are investigating the dependence on
  $De=\lambda /t_c$, which is the ratio between the elastic and inertia-capillary time scales (and recall that
  $Oh=t_{\nu }/t_c$). The dependence of each
  $t_{max}/t_{\nu }$ curve can be described by a power law,
  $t_{max}/t_{\nu } = c_1 De^{1/4}$, with the non-dimensional coefficient
  $c_1$ estimated as 0.15 and 0.25 for the two cases studied here. We observe that the experimental values fall approximately on these fits (very good agreement in
  $Oh=0.26$ and larger discrepancy for
  $Oh=0.16$).
Having identified this high-Deborah-number regime, we can now compare the time evolution of the jet length as a function of time for the experiments and simulations. Figure 6(a,b) presents the average experimental jet length and the corresponding error bars calculated from the individual jets presented in figure 5(a) along with the numerical results, with the time axis normalized by  $t_{max}$, estimated as
  $t_{max}/t_{\nu }=c_1 De^{1/4}$ and the length axis normalized by the value of
  $L_{max}^{\infty }$, identified in the previous analysis (and being
  $L^{\infty }_{max}/H_f = 7.1$, figure 6(a) and
  $L^{\infty }_{max}/H_f = 6.7$, figure 6b). The experimental and numerical data sets compare remarkably well, with the maximum of the averaged experimental curve being very close to
  $t/t_{max} = 1$ and
  $t/t_{max} \approx 1.43$. As expected, the numerical cases with lower
  $De$ do not reach the same jet length as the experimental case does, while higher
  $De$ cases reach values closer to the experimental maximum. Both of these cases show that the numerical simulations presented in this study can capture the main features of the experiment in terms of the maximum jet length
  $L_{max}$ and time to reach that maximum jet length
  $t_{max}$.

Figure 6. Comparison of the average experimental and numerical results for jet length as a function of time for (a) 0.20 wt.% PEO ( $H_f=8.2 \pm 1.1\ \mathrm {\mu }$m,
  $Oh=0.26$,
  $De=2065$); (b) 0.15 wt.% PEO.
  $H_f=10.5 \pm 2.5\ \mathrm {\mu }$m,
  $Oh=0.16$,
  $De=393$. Experimental and numerical simulations are very similar once time is rescaled as
  $t/t_{max}$ and length as
  $L_j/L_{max}^{\infty }$.
4. Viscoelastic liquid jets at the Newtonian breakup threshold energy and role of the $Oh$ number

In the previous section we identified a high-Deborah-number regime for two sets of experimental parameters, the jet energy and the  $Oh$ number. We demonstrated that the numerical simulations are able to capture the main features of the jet. We now systematically investigate the role of the
  $Oh$ number and the jet energy through numerical simulations. In this section we focus on the role of the
  $Oh$ number on the jet properties, by working at the laser threshold energy for the corresponding Newtonian fluid. The blister configuration corresponds to earlier studies (shape factor
  $C=1.25$) as described in § 2.
4.1. Laser threshold energy for a Newtonian fluid
We define the laser threshold energy  $E_{th}$ that would result with the breakup of a droplet for the Newtonian (
 $De=0$) case. The Newtonian cases (
 $De=0$) in this study are simulated using Newtonian rheology. This threshold energy is a function of blister shape and
  $Oh$, and is important because it offers an account for viscous, inertia and capillary effects that would be at play for a Newtonian liquid jet as well. Considering the laser threshold energy, we define a dimensionless energy parameter as
  $E_{ve} = (E_b - E_{th})/(E_{\gamma })$ to represent the energy spent on viscoelastic effects. We note that this value can also be negative if
  ${E_{th} > E_b}$, for which the deposited energy into the liquid film would not result in breakup for the Newtonian case (
 $De=0$). We use this dimensionless parameter
  $E_{ve}$ to denote the relative magnitude of the energy deposited into viscoelastic liquid films.
For a Newtonian liquid, the energy at the threshold of breakup corresponds to the lowest energy at which one droplet is ejected, which is the simplest droplet ejection regime and is therefore well suited to reveal the effect of viscoelasticity. In this section we discuss the physics of viscoelastic jets at the Newtonian breakup threshold energy. For Newtonian liquids, it is shown that this threshold energy increases with viscosity, liquid–air surface tension, liquid film thickness and liquid density (Brown et al. Reference Brown, Brasz, Ventikos and Arnold2012).
We determine the Newtonian threshold energies for various  $Oh$ satisfying the condition
  $0.05 \leq Oh \leq 1.0$ for the different blister configurations introduced in § 2. Figure 7 shows
  $E_{th}/E_{\gamma }$ as a function of
  $Oh$ and displays a linear scaling with
  $Oh$ for all blister shapes considered here. These results are in agreement with previous studies on laser threshold energy (Brown et al. Reference Brown, Brasz, Ventikos and Arnold2012).

Figure 7. Threshold energy values  $E_b/E_{\gamma }$ for various
  $Oh$. Jets induced from Newtonian (
 $De=0$) liquid jets breakup into a single droplet at these energy levels. The film thickness is
  $H_f = 5\ \mathrm {\mu }$m, and the surface tension is
  $\gamma = 72$ mN m
 $^{-1}$. The threshold energy increases approximately linearly with
  $Oh$ as
  $E_b/E_{\gamma } \sim 75Oh$. Blue symbols correspond to the blister profile introduced by Brown et al. (Reference Brown, Brasz, Ventikos and Arnold2012). Red symbols correspond to the experimental configurations presented in the previous section. The dashed lines are previous parameter sweep results from Brown et al. (Reference Brown, Brasz, Ventikos and Arnold2012).
An example of the Newtonian jet ( $De=0$) at the laser threshold energy is shown in figure 8(a) for
  $Oh=0.2$, and a viscosity ratio
  $\beta =0.6$, at the threshold energy
  $E_b/E_{\gamma } = E_{th}/E_{\gamma } = 22.8$. After deformation of the elastic boundary (following figure 2), a jet forms at
  $t/t_c\approx 1$, extends and an effective drop forms at the tip (
 $1<t/t_c<5$) of the jet before detaching at about
  $t/t_c=5.8$. This picture is in agreement with previous experimental and numerical work on impulsive jetting (Brown et al. Reference Brown, Brasz, Ventikos and Arnold2012).

Figure 8. Snapshots of jet formation from simulations for various  $De$ for
  $H_f=5\ \mathrm {\mu }$m,
  $Oh=0.2$, at the Newtonian droplet formation threshold
  $E_b/E_{\gamma } = 22.8$. (a) Newtonian case (
 $De=0$). A jet forms and then breaks up to form a droplet since the conditions are the threshold energy level for droplet formation. The viscoelastic cases (
 $\beta =0.6$) are presented in (b)
  $De=5$, (c)
  $De=20$ and (d)
  $De=120$. The viscoelastic jets extend to a maximum amount of stretch
  $L_{max}$ and starts to retract back to the liquid film. Filaments look like a cylinder of nearly constant radius with a bulbous end (referred to as an effective drop) at the end when it reaches its
  $L_{max}$. As
  $De$ increases,
  $L_{max}$ increases as well. The thickness of the filament connecting the effective drop to the liquid film decreases with increasing
  $De$. While the thinning is slower for high
  $De$, the increased elastic effects yield thinner filaments that can support the connection between the drop and the liquid film.
Now we present direct numerical simulations of viscoelastic jets obtained at these particular Newtonian breakup threshold energies for increasing  $De$.
$De$.
4.2. Phenomenological description for increasing viscoelastic effects
We consider three typical viscoelastic cases,  $De=5$,
  $De=20$ and
  $De=120$. For all of these cases, the other parameters are the same as given for the Newtonian case presented in figure 8(a) (
 $Oh=0.2$,
  $E_b/E_{\gamma } = 22.8$ or
  $E_{ve}=0$,
  $\beta =0.6$), i.e. we are at the Newtonian threshold energy. Figure 8(b) shows the smallest
  $De$ number,
  $De=5$. The initial stages of the formation of viscoelastic jets are very similar to the initial stages of the Newtonian case, with jet formation of similar length, extension of the jet and formation of an equivalent droplet at the tip of the jet. However, instead of breaking, the jet retracts at longer times. The viscoelastic jets start to differ from the Newtonian case at a time dictated by their corresponding relaxation times. The dynamics among the viscoelastic cases is similar with some notable differences, e.g. the maximum length of the filament being longer with increasing
  $De$ and the maximum length is reached at later times as visible in figures 8(c) and 8(d). We see from these figures that the viscoelastic jets extend to a maximum amount at about
  $t/t_c\approx 6$, similar to the time at which ejection occurred previously. At longer times, the jet retracts. We also note that the filament looks like a cylinder of nearly constant radius, with an equivalent droplet attached at its end when it reaches its maximum stretch. From these figures we observe that increasing
  $De$ results in a larger maximum stretch at a larger
  $t/t_c$ value. It follows that the thinning gets slower with increased
  $De$ while the maximum jet length increases as well. Furthermore, the thickness of the filament connecting the effective drop to the liquid film decreases with increasing
  $De$. The physical reasoning behind these trends can be explained based on our previous work on viscoelastic filament thinning (Turkoz et al. Reference Turkoz, Lopez-Herrera, Eggers, Arnold and Deike2018b): while the thinning is slower for high
  $De$, the increased elastic effects yield thinner filaments that can support the connection between the effective drop and the liquid film.
The transient dynamics of the jet is further illustrated in figures 9(a) and 9(b) for  $Oh=0.2$,
  $De=20$,
  $\beta = 0.6$ and
  $E_{ve} = 0$. Figure 9(a) shows the evolution of the dimensionless jet length
  $L_j/H_f$ and the dimensionless minimum filament radius
  $R_{fil}/H_f$ as a function of time. We observe that the minimum filament radius decreases rapidly during the initial stages of jet formation for
  $t/t_c < 2.0$. After this time, the minimum filament radius stays roughly constant as the filament stretches further until it reaches its maximum stretch
  $L_{max}$ at about
  $t/t_c \approx 4.5$. The filament radius stops its sharp decrease after the viscoelastic effects kick in. Figure 9(b) shows the jet profile for four different snapshots in time, and illustrates the previous discussions during an initial stage, the filaments thins and elongates, starting to form an effective droplet at the end of the filament. Once elastic effects start to be important, we can see that the main features of the jet profile are preserved as the amount of stretching changes over time.

Figure 9. Viscoelastic liquid jets propagate with a straight filament with a bulge attached to its end. The configuration simulated in this figure is  $Oh=0.2$,
  $De=20$,
  $\beta = 0.6$ and
  $E_b / E_{\gamma } = 22.8$. (a) The time evolution of the jet length
  $L_j/H_f$ and minimum filament radius
  $R_{fil}/H_f$ as a function of time. The filament thickness decreases up to a limit dictated by the relaxation time of the polymer. (b) The jet profiles corresponding to different times. The jet reaches its maximum at about
  $t/t_c = 6.08$ and starts to retract back. The filament remains straight throughout the extension and retraction processes after the initial jet formation period.
4.3. Maximum jet extension length as a function of $Oh$ and $De$


Figure 10(a) shows the time evolution of the jet length  $L_j$ as a function of time for increasing
  $De$, considering the Newtonian threshold energy
  $E_{ve}=0$ (
 $E_b/E_{\gamma }=22.8$) for
  $Oh=0.2$ and
  $\beta =0.6$. As it is evident from the results in figure 10(a), increasing
  $De$ does not affect the initial part of the curves, but it affects the length reached before retraction begins. This means that, for
  $t/t_c<2$, the elastic effects are negligible. As
  $De$ increases, the jet reaches its maximum jet length
  $L_{max}$ at later times. Again, we observe that
  $L_{max}$ appears to reach an asymptotic value at high
  $De>100$ values. This is confirmed in figure 10(b), which shows
  $L_{max}$ as a function of
  $De$ for two values of
  $Oh$, both at
  $E_{ve}=0$. The asymptotic value
  $L_{max}^{\infty }$ increases with increasing
  $Oh$, which was already noted in § 3.

Figure 10. (a) Jet length  $L_j/H_f$ as a function of time
  $t/t_c$ for increasing Deborah numbers
  $De$, with constant
  $Oh=0.2$ and the laser energy
  $E_b/E_{\gamma }=22.8$ is the Newtonian threshold energy,
  $E_{ve}=0$. Maximum jet length
  $L_{max}$ increases with increasing
  $De$ before saturating at high
  $De$. The time to reach the maximum jet length
  $t_{max}$ increases as well. Early time evolution (
 $t<2t_c$) is independent of
  $De$. (b) Plot of
  $L_{max}$ as a function of
  $De$ for two sets of simulations at
  $Oh=0.2$ and 0.4. A plateau value,
  $L_{max}^{\infty }$, is observed for
  $De>100$, and increases with increasing
  $Oh$. (c) Time of maximum extension,
  $t_{max}/t_{\nu }$, as a function of
  $De$, for two sets of simulations at
  $Oh=0.2$ and 0.4 and laser threshold energy. Dashed lines indicate
  $t_{max}/t_{\nu }=c_1 De^{1/4}$, with
  $c_1= 1$. (d) Plot of
  $L_{max}^{\infty }$ as a function of
  $Oh$ at
  $E_{ve}=0$. Here
  $L_{max}^{\infty }$ is evaluated at high
  $De$ where
  $L_{max}/H_f$ reaches a plateau;
  $L_{max}^{\infty }$ increases linearly with
  $Oh$. (e) Maximum value of the axial stress component
  $\sigma ^{\infty }_{zz}/(\gamma /H_f)$ along the filament as a function of time
  $t/t_c$ for three Deborah numbers,
  $De=1$,
  $De=40$ and
  $De=160$, during jet formation with
  $Oh=0.2$ and
  $E_b/E_{\gamma }=22.8$, as with the cases presented in (a). As
  $De$ increases, the elastic stresses start to be effective at later time steps, and the magnitude of the stress component increases as well.
Figure 10(c) shows the time  $t_{max}$ at which the jet reaches maximum extension
  $L_{max}$, which continuously increases with increasing
  $De$. The data can be described by a power law,
  $t_{max}/t_{\nu }=c_1 De^{1/4}$ with
  $c_1\approx 1$ here. Again these results are similar to those described in § 3 with some differences in the prefactor
  $c_1$. Figure 10(d) shows the asymptotic high-Deborah-number limit value of the jet extension
  $L_{max}^{\infty }$ as a function of
  $Oh$ number, which exhibits a linear scaling. Here
  $L_{max}^{\infty }/H_f$ values are evaluated as the value to which
  $L_{max}/H_f$ converges at high
  $De$ for the simulations performed with
  $5\leq De \leq 240$. These data show that the maximum extension
  $L_{max}^{\infty }$ in the high
  $De$ regime depends on the viscosity (
 $Oh$). Therefore, the effect of
  $Oh$ on viscoelastic jets is both on the initial stages of the dynamics to determine the laser threshold energy, and also on the asymptotic regime at high
  $De$ number. We note that all these results are at the laser threshold energy (i.e.
  $E_{ve}=0$), which correspond to various values of
  $E_b$. The characteristic of the high
  $De$ regime, and in particular the value of
  $L_{max}^{\infty }$ might therefore also depend on laser energy. This will be discussed later in the paper.
The asymptotic value of the maximum extension  $L_{max}/H_f$ can be discussed as follows. The initial stage of extension does not depend on the elastic stresses, which kicks in later, leading to a time of maximum extension that increases with
  $De$. The maximum extension increases with
  $De$ as well, as elastic stresses sustain thinner and thinner filaments. A regime independent of the
  $De$ number is observed for high enough elastic stresses, related to the constraints imposed by the fluid viscosity and initial laser energy, which eventually control the final length. The effect of
  $De$ on elastic stresses is demonstrated in figure 10(e), where the maximum axial stress component
  $\sigma _{zz}^{\infty }/(\gamma /H_f)$ is plotted as a function of time
  $t/t_c$ for three
  $De$ values;
  $De=1$,
  $De=40$ and
  $De=160$. The maximum axial stress component starts to increase later for higher
  $De$. Also, the magnitude of the maximum stress is greater for higher
  $De$. Therefore, while the Newtonian and viscoelastic jets are very similar at the initial parts of the jet formation (see first snapshots in time of figure 8a–d), elasticity becomes effective later in the process as the jet is stretched and causes the differences observed.
4.4. Equivalent droplet radius as a function of $Oh$ and $De$


For an application such as printing, the droplet size is an important parameter as droplet volume determines the amount of material transferred. Here, the viscoelastic filament does not break and does not eject a droplet by design since we use the Oldroyd-B formulation which does not support breakup. However, an estimate of the potential droplet size is still relevant for jet-based deposition techniques and is possible when a contact is established between the drop and a transfer surface (Turkoz et al. Reference Turkoz, Perazzo, Deike, Stone and Arnold2019b). Figure 11(a–c) compares a Newtonian liquid jet with the viscoelastic liquid jet ( $De=1$) at different times. It can be observed from these figures that the filament thinning stops for the viscoelastic jet due to elastic effects while the Newtonian jet goes through the Rayleigh–Plateau instability and ejects a droplet. Figure 11(a) shows the two principal radii,
  $R_1$ and
  $R_2$, used to evaluate the effective droplet radius attached to a viscoelastic filament
  $R_{ve}=\sqrt {R_1R_2}$. This definition of an effective droplet radius will be used to estimate the potential droplet ejection for viscoelastic jets as a function of the controlling parameters.

Figure 11. Newtonian and viscoelastic jet formation. Comparison of jet profiles of Newtonian and viscoelastic ( $De=1$) cases is presented for (a)
  $t/t_c = 3.51$, (b)
  $t/t_c = 4.56$ and (c)
  $t/t_c = 4.91$. We observe that, for the Newtonian case, the thinning continues beyond
  $t/t_c = 3.51$ and results in a breakup, while the viscoelastic jet retracts back to the liquid film. The viscoelastic effective droplet radius is evaluated using the two principal radius values
  $R_1$ and
  $R_2$, as shown in (a) as
  $R_{ve}=\sqrt {R_1R_2}$. The viscoelastic effective droplet radius is evaluated at the maximum stretch
  $L_{max}$ of the filament. Here
  $R_1$ represents the maximum radius of the effective droplet in the radial direction at maximum extension, while
  $R_2$ is measured in the axial direction from the same point on the centreline. (d) Change in the ratio of the viscoelastic droplet radius to Newtonian droplet radius
  $R_{ve}/R_{Newt}$ as a function of
  $De$. Here
  $R_{Newt}$ is evaluated by simulating the corresponding cases with
  $De=0$. There is an optimum
  $De$ for a given threshold energy
  $E_b/E_{\gamma }$ and
  $Oh$.
$Oh$.
We now discuss the effective viscoelastic droplet radius values evaluated for various  $De$ numbers. As documented in figure 11(d), the effective viscoelastic droplet size depends on
  $De$, while previous studies with Newtonian fluids have shown that the ejected droplet size depends on
  $Oh$ (Brown et al. Reference Brown, Brasz, Ventikos and Arnold2012). For example, it was shown that while increasing viscosity and surface tension both result in the increase of the laser transfer threshold energy, increasing viscosity yields smaller droplets and increasing surface tension yields larger droplets.
We vary systematically and independently the two controlling parameters  $Oh$ and
  $De$, always at the laser threshold energy. In this way we can document the dependence of the effective droplet size on viscoelasticity. In particular, the droplet radius
  $R_{Newt}$ obtained using the Newtonian laser transfer threshold energy is compared with the effective droplet radius
  $R_{ve}$ obtained at the same energy and
  $Oh$ for different
  $De$. The results are shown in figure 11(d), and display an optimum
  $De$ that minimizes the effective droplet radius at the laser threshold energy. We note that the energy is set to the threshold energy values presented in figure 7 for the corresponding
  $Oh$. For larger
  $Oh$, this effect is stronger reaching close to 30 % at
  $Oh=1$. It is also seen that the
  $De$ resulting in the minimum effective droplet radius shifts towards higher
  $De$ as the energy and
  $Oh$ increase.
Physically, this could be due to the fact that higher  $Oh$ jets, which have larger viscosity, extend longer at their Newtonian laser transfer threshold energies than low
  $Oh$ jets. We also note that this optimum in effective droplet size occurs well before the high
  $De$ regime identified above, which is typically
  $De>100$, while the smallest effective viscoelastic droplets are obtained for
  $De$ between 2 (low
  $Oh$) and 5 (high
  $Oh$). This suggests that this optimal smallest effective droplet size arises for a balance between viscoelastic and inertio-capillary effects. Therefore, if it is desired to decrease the droplet size of a jet-based deposition process, the process could be run at the optimum
  $De$ corresponding to the particular set of parameters in terms of
  $Oh$.
$Oh$.
4.5. Minimum filament radius as a function of $Oh$ and $De$


Figure 12(a) shows the shape of the jet at maximum extension,  $t_{max}$, for four different
  $De$ at their corresponding maximum stretch at
  $t_{max}/t_{\nu }$. As
  $De$ increases, the maximum jet length increases and the filament connecting the tip of the jet, or drop, to the liquid film is thinner, corresponding to elastic stresses starting to be important later in the thinning process. We also extract the filament radius
  $R_{fil}$ for different
  $Oh$ and
  $De$. Figure 12(b) presents the change in
  $R_{fil}/H_f$ at the Newtonian laser transfer threshold energies. Again, the filament radius does not exhibit a monotonic dependence on
  $De$. Above a critical
  $De$ value that depends on
  $Oh$, varying from
  ${\approx }1$ at high
  $Oh$ to
  ${\approx }2$ at lower
  $Oh$, the filament radius decreases with
  $De$. Below the critical value, a sharp decrease is observed. This is consistent with the physical picture presented in previous sections; more elasticity yields thinner filaments that can still support the attached droplet. However, for
  $De$ smaller than the threshold value, the filament radius increases with higher elasticity. As the
  $De$ is increased, the filament thickness keeps decreasing, and the droplet size converges back to a value at about the Newtonian droplet radius. Note that while higher
  $Oh$ values can yield a smaller droplet size compared with the Newtonian value, they also correspond to a thicker filament radius compared to the ink width.

Figure 12. Effect of viscoelasticity on jet parameters: minimum filament radius. (a) Jet profiles for different  $De$ at their maximum length. The filament radius at maximum stretch decreases with increasing
  $De$, with constant
  $Oh=0.2$ and the laser energy
  $E_b/E_{\gamma }=22.8$ is the Newtonian threshold energy,
  $E_{ve}=0$. (b) Change in the minimum filament radius
  $R_{fil}/H_f$ with changing
  $De$ and
  $Oh$ at the corresponding Newtonian laser transfer threshold energies, which are presented in figure 3. For all of the cases, the filament radius decreases with increasing
  $De$ for
  $De > 1$.
In this section we have described the dynamical features of the jet at the Newtonian threshold energy, focusing on how the effective droplet radius, radius filament and maximum extension depend on the  $De$ and
  $Oh$ numbers. We found that an optimal value of
  $De$ exists for formation of smaller drops at a given
  $Oh$ number, while the filament thickness decreases with
  $De$ above a critical value of order unity, the critical value having a slight dependence on
  $Oh$ number. We note that an increase in both
  $De$ and
  $Oh$ lead to an increase in the jet length at the breakup threshold. While these parameters seem to have a similar effect, the underlying physics are different. Varying
  $De$ does not have noticeable effects during the early times of jet formation (figure 10), while
  $Oh$ has a direct impact on the early time dynamics by determining the laser transfer threshold energy (figure 7).
5. Scaling relationships for viscoelastic liquid jets as a function of $De$, $Oh$, laser energy and blister shape


We now discuss how viscoelasticity affects the maximum jet length  $L_{max}$ and maximum extension time
  $t_{max}$ for various laser energies
  $E_{ve} = (E_b-E_{th})/E_{\gamma }$, and non-dimensional viscosities
  $Oh$ and compare the blister shapes used in §§ 3 and 4. We discuss scalings for
  $L_{max}$ and
  $t_{max}$ and the high-Deborah-number limit, where an asymptotic
  $L_{max}^{\infty }$ is reached, which depends on
  $E_{ve}$ and
  $Oh$, while the time of maximum extension keeps increasing with
  $De$. The relationships presented here expand the experimental results and simulations performed at much higher
  $De$ and presented in §§ 3 and 4. A list of the simulations presented in this section can be found in table 2.
5.1. The maximum extension of viscoelastic jets is controlled by laser energy and $Oh$

Figure 13 presents the profiles of jets at their maximum length for increasing laser energies  $E_{ve}$, keeping all other variables constant at
  $\beta =0.6$,
  $Oh=0.2$ and
  $De=40$. This figure shows that the filament radius
  $R_{fil}$ at maximum extension is a parameter that strongly depends on elasticity and does not seem to depend on laser energy itself for fixed
  $Oh$. We note that the jet volume is small compared with the total volume of the liquid film, and the effect of longer jet lengths can be observed with a slight change at the profile of the base of the filament.

Figure 13. The jet profiles at maximum jet length for various laser pulse energies. At this configuration,  $Oh=0.2$ and four different energy ratios
  $E_{ve}$ are
  $-$4.57 (
 $E_b/E_{\gamma }= 18.8$),
  $-$0.99 (
 $E_b/E_{\gamma }= 22.9$), 3.17 (
 $E_b/E_{\gamma } = 27.5$) and 7.97 (
 $E_b/E_{\gamma } =32.8$) as indicated in the figure. Jet profiles at their maximum length have the same filament radius regardless of the laser pulse energy, and whether the deposited energy is above the Newtonian threshold energy.
Figure 14(a) shows the normalized maximum jet length  $L_{max}/H_f$ as a function of
  $De$ for different laser pulse energies, with all curves at a constant
  $Oh$ number of 0.4. We observe an increase of
  $L_{max}$ with increasing
  $De$ at a rate which increases with the laser energy. Moreover, we observe that at high
  $De$ number, a plateau value is obtained,
  $L_{max}^{\infty }$, further confirming that for a given laser energy, a maximum extension is obtained. This maximum extension increases with the laser pulse energy. The maximum length
  $L_{max}^{\infty }$ as a function of the laser pulse energy is shown in the inset figure. Note that when increasing the laser pulse energy, the plateau value is reached at a higher
  $De$ number; here for the lowest energy,
  $L_{max}^{\infty }$ is reached around
  $De\sim 10$, while for the highest energy,
  $L_{max}^{\infty }$ is reached around
  $De\sim 200$. Note that for the lowest energy (
 $E_{ve}<-10$), there is almost no variation in the maximum jet extension with
  $De$ number, as the jet barely forms, with too little energy to significantly extend. For the same data, figure 14(b) shows the variation of the normalized time to reach the maximum jet length
  $t_{max}/t_{\nu }$ as a function of
  $De$;
$De$;  $t_{max}/t_{\nu }$ continuously increases with
  $De$. We observe that the prefactor of the power law increases with increasing laser energy, and the data can be fitted by a power law,
  $t_{max}/t_{\nu }=c_1 De^{1/4}$ with
  $c_1$ varying by a factor 2. These graphs show that the increased elasticity causes the thinning to slow down as observed during the experiments with viscoelastic filament thinning (Dinic et al. Reference Dinic, Zhang, Jimenez and Sharma2015).

Figure 14. Effect of viscoelasticity on the maximum jet length and time to reach the maximum jet length. (a) Plot of  $L_{max}$ as a function of
  $De$. At constant
  $Oh=0.4$ and increasing
  $E_b$ (and accordingly
  $E_{ve}$), the asymptotic jet length
  $L_{max}^{\infty }$ is reached for higher
  $De$ as the energy increases and the overall extension
  $L_{max}$ increases with increasing laser energy. (b) Plot of
  $t_{max}/t_{\nu }$ as a function of
  $De$. All data display a scaling
  $t_{max}/t_{\nu } = c_1 De^{1/4}$ indicated by the dashed line, with
  $c_1=1$. Some scatter between the different
  $E_b$ is visible with
  $t_{max}$ slightly increasing with
  $E_b$. (c) Plot of
  $L_{max}$ as a function of
  $De$, keeping
  $E_b/E_{\gamma }$ constant and varying
  $Oh$ (and therefore varying
  $E_{ve}$). Jets induced from more viscous liquids reach
  $L_{max}^{\infty }$ for smaller
  $De$, and
  $L_{max}^{\infty }$ increases with decreasing
  $Oh$ (viscosity). (d) Plot of
  $t_{max}/t_{\nu }$ as a function of
  $De$ for constant
  $E_b$ and increasing
  $Oh$. When the viscosity dominates, the jet can not keep its extension at high
  $De$ (this is for
  $Oh>0.5$ and low laser energy, triangle symbols). Dashed lines indicate
  $t_{max}/t_{\nu }=c_1 De^{1/4}$, where
  $c_1$ depends on
  $E_{ve}$ and
  $Oh$. The dashed lines in (a,c) denote the
  $L_{max}^{\infty }$ values plotted also in inset.
Similarly, figures 14(c) and 14(d) further discuss the effect of changing  $Oh$ on
  $L_{max}/H_f$ and
  $t_{max}/t_{\nu }$, respectively, at a constant laser pulse energy
  $E_b$ (note that constant
  $E_b$ does not yield constant
  $E_{ve}$ when
  $Oh$ is changed). At high
  $Oh$, we observe a behaviour similar to low pulse energy, with a relatively small value for
  $L_{max}^{\infty }$, which is reached at relatively low
  $De$. Again, these high
  $Oh$ values correspond to low
  $E_{ve}$ so that there is almost no energy in the jet for it to extend. In the inset of figure 14 we see that
  $L_{max}^{\infty }$ decreases with increasing
  $Oh$ (i.e. increasing viscosity), which is opposite to the results discussed previously, and again is attributed to the low energies. The time at which maximum extension is reached is shown in figure 14(d), where
  $t_{max}/t_{\nu }$ continuously increases with
  $De$, at a rate that increases with decreasing
  $Oh$. Again, the data can be fitted by a power law,
  $t_{max}/t_{\nu }=c_1 De^{1/4}$, except for the data at high
  $Oh$, low energy, with the same constant
  $c_1$, which depends on
  $Oh$, as introduced in the previous paragraph.
5.2. Synthesis and scaling relationships
To develop scaling relationships valid for various conditions, we summarize the data in the asymptotic high  $De$ regime presented in this paper, which include data at various
  $Oh$ and
  $E_{ve}=0$, a data set at constant
  $Oh$ and various
  $E_{ve}$, a data set at constant
  $E_b$ and various
  $Oh$, and finally data corresponding to the experimental cases presented in § 3. Figure 15 summarizes the dependency of the high
  $De$ regime on
  $Oh$,
$Oh$,  $E_{ve}$ and blister shape and makes an empirical attempt to describe scaling relationships.

Figure 15. Synthesis of the data and identification of controlling parameters. (a,b) The maximum extension length  $L_{max}^{\infty }/H_f$ as a function of
  $E_{ve}$ and
  $Oh$ (inset) (a) and the cumulative variable
  $Oh+\chi E_{ve}$, where
  ${\chi =0.05}$ (b). (c) Trend of the time to reach the maximum extension
  $t_{max}/t_{\nu }$ described by
  $t_{max}/t_{\nu } = c_1 De^{1/4}$. The prefactor
  $c_1$ varies by up to a factor of five between the various data sets. (d) Plot of
  $t_{max}/t_{\nu }$ normalized by a geometric factor
  $H_f/H_b$ to take into account the blister shape. Scatter between data sets is reduced to a factor three. Circles in the legends of (c,d) represent the colours to which each data set corresponds. The complete parameter list for the simulations presented in this figure is presented in table 2.
First, let us summarize the dependency of  $L_{max}^{\infty }$ as a function of
  $Oh$ and
  $E_{ve}$. Figure 15(a) shows
  $L_{max}^{\infty }$ as a function of energy
  $E_{ve}$ and
  $Oh$ (inset). For all cases considered here,
  $L_{max}^{\infty }$ increases with
  $E_{ve}$, while a strong
  $Oh$ dependency is also visible. The dependence in
  $Oh$ is nonlinear as shown in the inset, as high viscosity cases that also have low energy behave differently than lower
  $Oh$, higher energy cases. Indeed, for the low energy cases (
 $E_{ve} \ll -10$), we observe that
  $L_{max}^{\infty }$ decreases slightly with
  $Oh$, where these cases corresponding to cases far from droplet ejection for a Newtonian jet, because a jet is barely formed, viscous effects dominate and elastic effects appear negligible (viscosity prevents the development of the jet). For
  $-5<E_{ve}<5$, the maximum jet length increases with increasing
  $Oh$, as higher viscosity allows formation of thinner jets. In this configuration of intermediate laser energy, which is the most interesting for practical purposes, the effect of
  $Oh$ and
  $E_{ve}$ are similar and potentially cumulative. As a consequence, we introduce
  $Oh+\chi E_{ve}$ as a non-dimensional variable to describe the evolution of
  $L_{max}^{\infty }$, with
  $\chi =0.05$ a fitting parameter (which could be merged in the definition of the normalization energy
  $E_{\gamma }$). As shown in figure 15(b),
  $L_{max}^{\infty }$ increases continuously with this parameter
  $Oh+\chi E_{ve}$. Negative values correspond to cases where the laser energy is too low to overcome the dissipation. The value of the coefficient
  $\chi$ remains to be understood, but our data strongly suggest a cumulative effect of liquid viscosity and laser energy in controlling the maximum extension of the jet at high
  $De$ number.
Now we consider the time of maximum extension,  $t_{max}$. Figure 15(c) shows
  $t_{max}/t_{\nu }$ as a function of
  $De$ for all data presented in the paper (showing data already discussed in figures 5, 10 and 14). As already discussed, all data can be described by
  $t_{max}/t_{\nu }\propto De^{1/4}$ with a prefactor varying by about five. Attempts to use the energy as a rescaling parameter did not succeed, while using a geometrical factor comparing the thin liquid thickness
  $H_f$ and blister height
  $H_b$ leads to a reduction of the scatter of the data, with
  $({t_{max}}/{t_{\nu }}){H_f}{H_b}\propto De^{1/4}$, the data scatter now being within a factor of three. We note that the introduction of the blister height into the scaling also provides the connection with the laser pulse energy, whose relationship with the blister height can be determined empirically as presented in § 2. Again, a detailed physical explanation of these rescaling factors remains to be provided.
6. Discussion and conclusion
The length and the effective droplet size of a viscoelastic liquid jet depend on the interplay between the forcing parameters and material properties. Here, we present an extensive study on viscoelastic jets by combining laboratory experiments and a numerical framework to simulate the jet formation from a liquid film actuated by a rapidly deforming solid boundary. The mechanical impulse by the solid boundary deformation leads to jet and droplet formation. Our numerical simulations solve the two-phase incompressible continuity and momentum equations coupled with the Oldroyd-B constitutive equation to capture the polymeric stress component of the flow. We investigate the elastic and viscous effects separately by varying the relevant dimensionless parameters, the Deborah number  $De$ and the Ohnesorge number
  $Oh$, respectively. Combined with the dimensionless laser pulse energy
  $E_b/E_{\gamma }$, it is possible to simulate various cases to understand how these parameters couple. We discuss the Newtonian threshold energy (the minimum energy to eject a single droplet in the Newtonian case) as a critical energy to understand the behaviour of a viscoelastic jet.
We discuss the complexity of viscoelastic on jet profile and effective droplet size. We see that the maximum jet length  $L_{max}$ increases with increasing
  $De$ while the filament radius at the maximum jet length decreases. We also compare the effective droplet size attached to the viscoelastic filaments with those obtained from the Newtonian filaments at the laser transfer threshold energy, which results in the ejection of a single drop from Newtonian liquid films. The simulations show that there is an optimum
  $De$ that yields the minimum viscoelastic effective drop radius for a given laser pulse energy and
  $Oh$. It is a significant result for jet-based printing and deposition applications, where the droplet size determines the resolution of the process. While the filament radius decreases as a function of
  $De$, we remarkably observe that it is not a function of laser pulse energy.
We characterize the maximum jet extension in viscoelastic configurations and the time of maximum extension. The maximum extension increases with increasing viscoelasticity and we identify a high  $De$ regime where the maximum extension reaches a plateau value
  $L_{max}^{\infty }$. This asymptotic extension increases with viscosity and laser energy, and can be described by a scaling law as a function of these two parameters,
  $L_{max}^{\infty }\propto Oh+\chi E_{ve}$. The time of maximum extension is found to scale with
  $De$ in a consistent way throughout all experiments, and again can be described by a scaling law, including the viscous time scale, the
  $De$ number and a geometric factor accounting for the blister shape,
  $t_{max}/t_{\nu } (H_f/H_b) \propto De^{1/4}$. Experimental and numerical data agree well in this asymptotic high
  $De$ regime, while a theoretical understanding of these scaling relationships remain to be provided.
Numerical studies presented in this paper are performed with the Oldroyd-B constitutive equation, which does not allow for the droplets to breakup and be ejected from the formed jets. This formulation would not be able to capture the rheological response of weakly viscoelastic, shear-thinning liquids. In a previous study (Turkoz et al. Reference Turkoz, Perazzo, Kim, Stone and Arnold2018c) we analysed the printing regimes for such liquids by modifying the dimensionless parameters  $De$ and
  $Oh$. We expect shear thinning to cause the initial viscous dissipation during jet formation to be small, so that more energy can be spent on the extension of the liquid jet. The extensional viscosity should grow as the strain rate decreases during jet extension and act as a stabilizing effect against jet breakup. The breakup of the liquid filament would depend on the balance of the energy left over after the initial deformation and the elastic energy due to jet extension. A numerical model with a different constitutive equation, such as the Giesekus model (Ardekani et al. Reference Ardekani, Sharma and McKinley2010), would be more appropriate for the simulation of such liquids.
In this paper we show that viscoelasticity affects the jet and droplet formation from liquid films. The results presented here are relevant for many other applications where multiphase flow of polymeric solutions is important. We believe the numerical framework presented here can be used for other applications including inkjet printing (Morrison & Harlen Reference Morrison and Harlen2010; Basaran, Gao & Bhat Reference Basaran, Gao and Bhat2013), spraying (Kooij et al. Reference Kooij, Sijs, Denn, Villermaux and Bonn2018) and many other applications where fragmentation of droplets is relevant (Villermaux Reference Villermaux2007; Keshavarz et al. Reference Keshavarz, Houze, Moore, Koerner and McKinley2016).
Acknowledgements
We are grateful for the support of the Princeton University Schmidt Fund.
Declaration of interests
The authors report no conflict of interest.
Appendix A. Dimensionless form of the governing equations
Dimensionless forms of the momentum equations for viscoelastic liquid jets with Oldroyd-B rheology have been derived using slender-body approximation, where  $h$ denotes the radius of the liquid jet. By choosing the liquid film thickness
  $H_f$ as the length scale, capillary time
  $t_c=\sqrt {\rho H_f^3/\gamma }$ as the time scale, and capillary pressure
  $\gamma /H_f$ as the pressure scale, the governing equations become
 \begin{gather} \frac{\partial h}{\partial t} + u \frac{\partial h}{\partial z} = -\frac{h}{2}\frac{\partial u}{\partial z}, \end{gather}
 \begin{gather}\frac{\partial u}{\partial t} + u \frac{\partial u}{\partial z} = -\frac{\partial}{\partial z}(\boldsymbol{\nabla} \boldsymbol{\cdot} \boldsymbol{n}) + 3\beta \, {Oh} \frac{1}{h^2}\frac{\partial}{\partial z}\left(h^2 \frac{\partial u}{\partial z}\right) + \frac{1}{h^2}\frac{\partial}{\partial z} [h^2(\sigma_{zz} - \sigma_{rr}], \end{gather}
 \begin{gather}\boldsymbol{\nabla} \boldsymbol{\cdot} \boldsymbol{n} = \frac{1}{[1+(\partial h / \partial z)]^{3/2}}\left[ \frac{1 + (\partial h / \partial z)^2}{h} - \frac{\partial^2 h}{\partial z^2} \right], \end{gather}
 \begin{gather}\sigma_{zz} + {De}\left(\frac{\partial \sigma_{zz}}{\partial t} + u \frac{\partial \sigma_{zz}}{\partial z} - 2 \sigma_{zz} \frac{\partial u}{\partial z} \right) = 2(1-\beta){Oh} \frac{\partial u}{\partial z}, \end{gather}
 \begin{gather}\sigma_{rr} + {De}\left(\frac{\partial \sigma_{rr}}{\partial t} + u \frac{\partial \sigma_{rr}}{\partial z} + \sigma_{rr} \frac{\partial u}{\partial z} \right) = -(1-\beta){Oh} \frac{\partial u}{\partial z}, \end{gather}
where  $u$ is the axial velocity component,
  $\sigma _{zz}$ is the diagonal component of the stress tensor in the axial direction and
  $\sigma _{rr}$ is the diagonal component of the stress tensor in the radial direction. Definitions of the dimensionless parameters
  $Oh$,
$Oh$,  $De$ and
  $\beta$ are given in (1.1a–c).
Appendix B. Grid convergence
The parameter sweep studies are performed for 5  $\mathrm {\mu }$m thick liquid films for various
  $De$. To check the grid convergence, a uniform square grid is generated on a square domain of
  $80\ \mathrm {\mu } \textrm {m}\times 80\ \mathrm {\mu }\textrm {m}$ with
  $2^{Level}$ grid points along one edge of the domain. The parameter
  $Level$ is set to 10, 11 and 12, corresponding to 64, 128 and 256 points along the 5
  $\mathrm {\mu }$m thick film in the axial direction, respectively. Figure 16 shows the evolution of the jet length
  $L_j$ as a function of time
  $t$ for three different Deborah numbers, (a)
  $De = 1$, (b)
  $De = 40$ and (c)
  $De = 160$. The laser pulse energy is set to
  $E = 5.30\ \mathrm {\mu }$J (
 $E_b/E_{\gamma } = 18.8$) and the viscosity ratio is
  $\beta =0.6$. It is seen from this figure that the results become grid independent for the grids as refine as
  $Level = 11$. The results in this paper are evaluated with this or a higher level of refinement.

Figure 16. Jet length  $L_j/H_f$ as a function of time
  $t/t_c$ for
  $E_b/E_{\gamma }=18.8$ with different Deborah numbers (a)
  $De =1$, (b)
  $De=40$, (c)
  $De=160$ and grid refinement levels. Here
  $2^{Level}$ denotes the number of grid points along one edge of the
  $80\ \mathrm {\mu } \textrm {m}\times 80\ \mathrm {\mu }\textrm {m}$ square domain with the liquid film thickness of
  $H_f=5\ \mathrm {\mu }$m.
Appendix C. Effect of the viscosity ratio
The results presented in §§ 4 and 5 are evaluated with the same viscosity ratio  $\beta =0.6$. However, the change in this parameter can be relevant as it can change drastically depending on the amount of polymer in the solution. It is important to note that the problem becomes numerically stiffer as
  $\beta$ decreases so that the relative effect of polymer viscosity increases. The change of the jet length at maximum stretch as a function
  $\beta$ is presented in figure 17(a). Here, it is seen that effect of
  $\beta$ is enhanced for high
  $De$. However, the same effect is not observed for the droplet radius. We see that the change in droplet radius is negligible with changing
  $\beta$ as shown in figure 17(b).

Figure 17. The effect of the viscosity ratio  $\beta =\mu _s/(\mu _s + \mu _p)$ on (a) jet length at maximum stretch
  $L_{max}/H_f$ and (b) droplet radius
  $R/H_f$ for
  $E=5.40\ \mathrm {\mu }$J and
  $Oh=0.2$ for various
  $De$. The effect of viscosity on jet length increases with high
  $De$. Droplet radius has a weak dependence on
  $\beta$.


