


1. Introduction
Can we infer the small scale features of a turbulent flow from the angular dynamics of a particle advected by it? This question has represented a motivation and a formidable challenge for much of the research performed on Lagrangian studies of turbulence over the last decade (Voth & Soldati Reference Voth and Soldati2017). The angular dynamics of a small material body advected by a flow indeed inherits properties of the spatial gradient of the carrying flow. However, even in the most simple instance, the one of an inertialess axisymmetric particle in a plane steady shear flow whose description is due to Jeffery (Reference Jeffery1922), the connection is not straightforward owing to the nonlinearity of the particle equation of motion. A particle performing a so-called Jeffery orbit tumbles at variable speed and, as a result, on average preferentially aligns with certain flow directions. Notable progress has been made in the context of statistically steady, homogeneous and isotropic turbulence (HIT), where a robust universal behaviour, i.e. independent of external forcing, has been highlighted (Shin & Koch Reference Shin and Koch2005; Pumir & Wilkinson Reference Pumir and Wilkinson2011; Parsa et al. Reference Parsa, Calzavarini, Toschi and Voth2012; Gustavsson, Einarsson & Mehlig Reference Gustavsson, Einarsson and Mehlig2014; Ni, Ouellette & Voth Reference Ni, Ouellette and Voth2014; Byron et al. Reference Byron, Einarsson, Gustavsson, Voth, Mehlig and Variano2015; Ni et al. Reference Ni, Kramel, Ouellette and Voth2015; Candelier, Einarsson & Mehlig Reference Candelier, Einarsson and Mehlig2016; Rosti et al. Reference Rosti, Banaei, Brandt and Mazzino2018).
The study of rotation of anisotropic particles has seen a great development in recent times, also motivated by applications in environmental sciences, geophysics and industry. Anisotropic particles are encountered in the form of cloud ice crystals in atmospheric precipitation models (Heymsfield Reference Heymsfield1977) or in the shape of planktonic organisms in ocean population dynamics research (Ardeshiri et al. Reference Ardeshiri, Schmitt, Souissi, Toschi and Calzavarini2017) or as cellulose fibres in papermaking industrial processes (Olson & Kerekes Reference Olson and Kerekes1998), to cite only few application domains. The advancement of knowledge has followed two main paths: (i) refinements in the particle description including hydrodynamic forces due to inertia, finite-size and shape (Chevillard & Meneveau Reference Chevillard and Meneveau2013; Parsa & Voth Reference Parsa and Voth2014; Kramel et al. Reference Kramel, Voth, Tympel and Toschi2016; Pujara & Variano Reference Pujara and Variano2017; Bounoua, Bouchet & Verhille Reference Bounoua, Bouchet and Verhille2018), or external forces such as gravity (Marchioli, Fantoni & Soldati Reference Marchioli, Fantoni and Soldati2010; Gustavsson et al. Reference Gustavsson, Jucha, Naso, Lévêque, Pumir and Mehlig2017); (ii) exploration of different fluid flows, from laboratory-scale turbulence to geophysical settings. The second aspect is still largely uncharted, while many studies are available for the above-mentioned HIT condition, only a handful of works cover the topics of bounded turbulence (Mortensen et al. Reference Mortensen, Andersson, Gillissen and Boersma2008; Marchioli & Soldati Reference Marchioli and Soldati2013; Challabotla, Zhao & Andersson Reference Challabotla, Zhao and Andersson2015; Zhao et al. Reference Zhao, Challabotla, Andersson and Variano2015; Bakhuis et al. Reference Bakhuis, Mathai, Verschoof, Ezeta, Lohse, Huisman and Sun2019), or surface flows (DiBenedetto, Ouellette & Koseff Reference DiBenedetto, Ouellette and Koseff2018). The fact that hitherto no study exists for thermally driven turbulence (so relevant for environmental and geophysical applications) provides a motivation for the present work. Instances of thermally driven flows are, for example, atmospheric winds and ocean currents, magma and earth mantle convection, and any molten flow in industry.
In this paper we show by means of experiments and numerical simulations that the tumbling rate of inertialess neutrally buoyant axisymmetric particles in a convective turbulence Rayleigh–Bénard (RB) cell displays a peculiar trend as a function of the particle aspect ratio, which is different from the one in HIT. We demonstrate that this trend is due to the combined effect of turbulent fluctuations and a persistent shear flow determined by the kinetic boundary layers (BL). In the discussion we speculate that such behaviour will vanish for larger thermal forcing (higher Rayleigh number), finally recovering the universal behaviour observed in turbulence.
The paper is organised as follows. The experimental and numerical methods are described in detail in § 2, including the governing equations of the flow and particles. We present the main results in § 3, focusing on the statistics of the tumbling rate and preferential alignment of anisotropic particles. Finally, in § 4 we summarise our findings.
2. Methodology
2.1. Experiments
The experiments are carried out in a cubic RB cell, with side  $H=24\ \textrm {cm}$. The dynamics of this system is determined by two control parameters, the Rayleigh number
  $Ra=\beta g {\rm \Delta} TH^{3}/(\nu \kappa )$ and Prandtl number
  $Pr=\nu /\kappa$. Here
  $\beta$ is the thermal expansion coefficient,
  $g$ the acceleration due to gravity,
  ${\rm \Delta} T$ the bottom-top thermal gap,
  $\nu$ the kinematic viscosity and
  $\kappa$ the thermal diffusivity. The experiments presented here have been conducted by means of a solution of glycerol with
  $55\,\%$ by weight at a mean temperature
  $T_m=40\, ^{\circ }\textrm {C}$ which corresponds to a Prandtl number
  $Pr\simeq 37$. The temperature difference between the bottom and top plates in the experiments is
  $17.4\, ^{\circ }\textrm {C}$ which corresponds to
  $Ra=4\times 10^{9}$, with which the Boussinesq approximation is valid. The cell is made of acrylic foils and they are sandwiched by two thick copper top and bottom plates. The temperature of the top plate is kept constant by a refrigerated liquid circulating bath. The bottom plate is powered by a power supply to provide a constant heat flux. The density of the fluid at
  $T_m$ is approximately equal to the one of the polyamide particles seeding the flow (
 $\rho _p=1.13\ \textrm {g}\,\textrm {cm}^{-3}$) so that they can be taken on average as neutrally buoyant. The particles are non-spherical and axisymmetric in shape. They are either rod-like with 0.45 mm diameter and aspect ratio
  $\alpha =6$, or disk-like with 3 mm diameter and aspect ratio
  $\alpha =1/6$. These shapes are produced, respectively, by cutting a long polyamide thread and by cutting out equal disks from a polyamide sheet. The uncertainly in length is 0.2 mm for rods which corresponds to an aspect ratio uncertainty of
  ${\pm }7\,\%$, and it is much smaller for disks as they were cut from a polyamide sheet by means of stainless-steel tube. The fluid–particle suspension is highly diluted, around 1 particle in a volume of
  $(34\eta )^{3}$ global dissipative units, corresponding to a volume fraction
  $O(10^{-5})$. In such conditions the effect of particles on the flow is negligible. We evaluate the global energy dissipation rate as
  $\overline {\epsilon }=Ra\,Pr^{-2}(Nu-1)\nu ^{3}/H^{4}$ (Shraiman & Siggia Reference Shraiman and Siggia1990). The Nusselt number
  $Nu$ is measured based on the relation
  $Nu=QH/(\chi {\rm \Delta} T)$, where
  $Q$ is the time-averaged total heat-flux through the system and
  $\chi$ the thermal conductivity of the fluid. The global dissipative length and time scales measure, respectively,
  $\eta =(\nu ^{3}/\overline {\epsilon })^{1/4} = 1.9\ \textrm {mm}$ and
  $\tau _{\eta }=(\nu /\overline {\epsilon })^{1/2} =1.1\ \textrm {s}$. In such conditions the particle translational and rotational response times estimated as in Voth & Soldati (Reference Voth and Soldati2017) are sufficiently small (
 ${\sim }10^{-2} \tau _{\eta }$) to neglect the effect of inertia on the dynamics. The three-dimensional (3-D) particle tracking is performed by means of two cameras pointing at the system horizontally from orthogonal directions. The imaging volume covers
  $89\,\%$ of the total volume, meaning that on average the field of view reaches a distance of
  $4.5\ \textrm {mm}$ from the walls. This wide field of view allows us to access both the dynamics in the kinetic BL, whose thickness is
  $\delta _{BL} = H/\sqrt {Re} \simeq 10\ \textrm {mm}$ (here
  $Re=u_{rms}H/\nu \simeq 545$) and the cell-size large-scale circulation flow structure. The individual 3-D particle trajectories are measured by combining the synchronised records from each camera using the reconstruction methods presented in Mathai et al. (Reference Mathai, Neut, van der Poel and Sun2016b) for the position and in Parsa (Reference Parsa2013) for the orientation. First, the particles are identified by finding the best matching in the vertical displacement and the vertical acceleration between each imaged particle in the two temporal series of frames. This allows us to access the 3-D position and velocity time series for each individual particle. Second, one makes use of projective geometry to identify the actual particle orientation in space. For each identified particle one determines two planes, each plane lying on (i) the line connecting the camera position to the particle position and (ii) the perceived orientation of the particle symmetry axis in the frame. The intersection of two such planes allows us to determine the particle orientation in 3-D. However, for measurements employing only two cameras, we shall carefully take into account the existence of an ambiguity when the particle is lying the epipolar plane, such an ambiguity is just transient and can be resolved by a polynomial fitting of the orientation in the frames before and after the undetermined event. The typical duration of the recorded particle trajectories is
  $O(10)$ large-eddy turnover times,
  $T=H/u_{rms}=26.3\ \textrm {s}$.
2.2. Simulations
In the present study we perform two series of simulations of anisotropic particles advected by a flow: (i) the first set concerns particles that are evolving in an RB flow with similar geometrical and physical parameters as the experiments,  $Ra=10^{9}$,
  $Pr=40$; (ii) the second set is for particles in a statistically homogeneous and isotropic turbulent flow at Taylor–Reynolds number
  $Re_\lambda =32$, i.e. close to the one estimated in the centre of the RB system. The need for simulation of particles in an HIT flow will be clarified further below. We adopt an Eulerian–Lagrangian model, meaning that we describe the flow evolution by means of fluid dynamics equations, while the particle trajectories (the evolution of their position and orientation) are described in a comoving frame by ordinary differential equations. Furthermore, we assume that only the evolution of the fluid affects the dynamics of the particles, i.e. we adopt a so-called one-way coupling approximation.
The flow in the RB cell is described by the Oberbeck–Boussinesq equations
 \begin{gather} \frac{\partial\boldsymbol{u}}{\partial t} + \boldsymbol{u}\boldsymbol{\cdot} \boldsymbol{\nabla} \boldsymbol{u} = - \frac{1}{\rho}{\nabla} p + \nu\ \nabla^{2} \boldsymbol{u} + \beta g (T-T_m) \boldsymbol{\hat{y}}, \end{gather}
 \begin{gather} \boldsymbol{\nabla} \boldsymbol{\cdot} \boldsymbol{u} = 0, \end{gather}
 \begin{gather} \frac{\partial T}{\partial t} + \boldsymbol{u}\boldsymbol{\cdot} \boldsymbol{\nabla} T = \kappa\ \nabla^{2} T, \end{gather}
where  $\boldsymbol {u}(\boldsymbol {x},t)$ and
  $T(\boldsymbol {x},t)$ are, respectively, the velocity and temperature fields,
  $\boldsymbol {\hat {y}}$ is the unit vector which points upwards, and the parameters are the kinematic viscosity (
 $\nu$), the thermal diffusivity (
 $\kappa$), the reference liquid density (
 $\rho$) at temperature
  $T_m$, the thermal expansion coefficient with respect to the same temperature
  $(\beta )$ and finally the intensity of gravitational acceleration
  $(g)$. The boundary conditions for the velocity are no-slip on all cell faces. The horizontal top and bottom plates are isothermal and the lateral boundaries are adiabatic.
The HIT flow is described by the incompressible Navier–Stokes equations driven by an external large-scale random force with constant global energy input capable to produce and sustain a statistically homogeneous and isotropic turbulent flow (same as in the direct numerical simulations (DNS) in Mathai et al. (Reference Mathai, Calzavarini, Brons, Sun and Lohse2016a)). The boundary conditions are periodic in all directions.
The two above-described flows are seeded by a fixed number of particles. The particles are assumed to be smaller than the typical dissipative scale of the flow, so that they experience just linear flow variations across their length and width. The effects due to inertia or particle size are neglected both in their translational and rotational dynamics. In such simplified conditions, the dynamic of particles is described by the following set of equations (Jeffery Reference Jeffery1922):
 \begin{gather} \dot{\boldsymbol{r}} = \boldsymbol{u}(\boldsymbol{r}(t),t), \end{gather}
 \begin{gather} \dot{\boldsymbol{p}} = \boldsymbol{\varOmega} \boldsymbol{p} + \frac{\alpha^{2} - 1}{\alpha^{2}+1} \left( \boldsymbol{\mathcal{S}}\boldsymbol{p} - (\boldsymbol{p}\boldsymbol{\cdot} \boldsymbol{\mathcal{S}}\boldsymbol{p}) \boldsymbol{p} \right), \end{gather}
where  $\boldsymbol {r}(t)$ and
  $\boldsymbol {p}(t)$ identify the particle position and orientation, respectively,
  $\alpha$ is the aspect ratio of the particles,
  $\boldsymbol{\mathcal {S}} = (\boldsymbol {\nabla } \boldsymbol {u}+ \boldsymbol {\nabla } \boldsymbol {u}^{T})/2$ and
  $\boldsymbol{\varOmega} =(\boldsymbol {\nabla } \boldsymbol {u}-\boldsymbol {\nabla } \boldsymbol {u}^{T})/2$ represent the symmetric and anti-symmetric components of the fluid velocity gradient tensors at the particle position,
  $\boldsymbol {\nabla } \boldsymbol {u}$. In our experiments the size of particles is smaller or comparable to the dissipation length scale of the flow, supporting the assumption that Jeffery's equation is an appropriate model to describe the angular dynamics of the particles in the present conditions, see also Ravnik, Marchioli & Soldati (Reference Ravnik, Marchioli and Soldati2018) for a more detailed discussion. For the present simulations a resolution of
  $512^{3}$ equally spaced gridpoints is used for the RB flow at
  $Ra = 10^{9}$,
  $Pr = 40$, while a
  $256^{3}$ grid is used for the HIT flow at
  $Re_\lambda = 32$. In all simulations the anisotropic particles cover a wide range of aspect ratios from thin disks to slender fibres,
  $\alpha \in [10^{-2},\ 10^{2}]$. The above-described models are simulated numerically by means of a tested code (Calzavarini Reference Calzavarini2019) which makes use of a Lattice Boltzmann Method (known as LBM) algorithm for the treatment of the fluid and thermal part and of a second-order-in-time tracking algorithm with trilinear interpolation of fields at the particle positions. The code has been used for the simulation of convection in a closed cavity (Jiang, Calzavarini & Sun Reference Jiang, Calzavarini and Sun2019), convection with particles (Calzavarini etal. Reference Calzavarini, Jiang and Sun2020) and HIT flows with inertial particles (Mathai et al. Reference Mathai, Calzavarini, Brons, Sun and Lohse2016a; Calzavarini et al. Reference Calzavarini, Huang, Schmitt and Wang2018).
3. Results and discussion
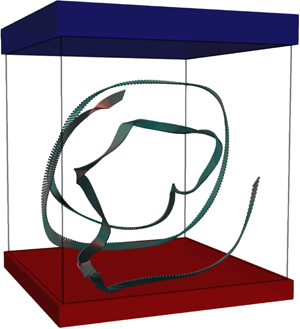
A visualisation of two typical trajectories of prolate and oblate particles from the experiments is shown in figure 1(a,b). The evolution of the particle centre of mass gives an indication of the large-scale circulation which occurs in the RB cell in the present conditions. The particle orientation, also visually rendered in figure 1(a,b), identified by the unit vector  $\boldsymbol {p}(t)$, evolves smoothly in the bulk and changes abruptly mostly in correspondence of the top and bottom regions (although particle–wall collisions do not occur). A quantitative measurement of these changes is obtained via the p.d.f. for the instantaneous normalised quadratic tumbling rate,
  $\dot {p}_i \dot {p}_i/\overline {\dot {p}_i \dot {p}_i}$. The p.d.f.s, figure 1(c,d), show exceptionally large fluctuations, up 60 times the mean quadratic tumbling value. For comparison we display on the same figure the expected p.d.f. for a set of initially random uniformly oriented particles of the corresponding aspect ratios tumbling in a stationary plane shear flow, i.e. performing so-called Jeffery orbits. Note that the latter p.d.f. has a finite support due to the periodic evolution of the particle orientation, and it has a much shorter tail. Additionally, we remark that the shape of these curves (i) does not seem to carry a particle aspect ratio dependence; (ii) agrees well with previous experimental measurements (Parsa et al. Reference Parsa, Calzavarini, Toschi and Voth2012; Marcus et al. Reference Marcus, Parsa, Kramel, Ni and Voth2014) performed in developed turbulent flows at much higher Reynolds numbers; and (iii) are in excellent agreement with the DNS. The latter point gives us confidence in relying on numerical results for further analysis.

Figure 1. Visualisation of two trajectories of a prolate  $(a)$ and oblate
  $(b)$ particle from experiments (EXP). Their duration is
  $215 \tau _{\eta }$ for
  $\alpha =6$ (rod) and
  $183\tau _{\eta }$ for
  $\alpha =1/6$ (disk). Probability density function (p.d.f.) of the square tumbling rate for rods
  $(c)$ and disks
  $(d)$: RB experiments (empty circles); DNS results (red line); Jeffery orbits in a steady plane shear flow (black line). For comparison, experimental results in HIT from Parsa et al. (Reference Parsa, Calzavarini, Toschi and Voth2012) at
  $\alpha =5, Re_{\lambda } =161$
 $(c)$and Marcus et al. (Reference Marcus, Parsa, Kramel, Ni and Voth2014) at
  $\alpha =1/10, Re_{\lambda } = 91$
 $(d)$ are shown.
We now look at the dependence of the mean quadratic tumbling as a function of the aspect ratio; the symbol  $\overline {\vphantom {M}\ldots }$ denoting in the following, global volume and time averages. Figure 2(a) presents the measurements from numerics in the aspect ratio range
  $\alpha \in [10^{-2},\ 10^{2}]$ together with the ones from the experiments for oblate and prolate particles, which again nicely agree with each other. More importantly the behaviour is compared with the measurements of the same quantity in HIT, here DNS at
  $Re_{\lambda }=32$ and results from Parsa et al. (Reference Parsa, Calzavarini, Toschi and Voth2012) in the same conditions. The tumbling rate in RB is for all the aspect ratios slower than the one observed in the HIT flow, pointing to the existence of either a stronger preferential alignment with the underlying flow or to an intrinsic smaller variability of the velocity gradient fluctuations.

Figure 2. Mean squared tumbling rate as a function of aspect ratio  $\alpha$ with global energy dissipation rate
  $\overline {\epsilon }$ as normalisation scale.
  $(a)$ Global measurements for RB DNS at
  $Ra=10^{9}$ and
  $Pr=40$ (blue diamond); HIT DNS at
  $Re_\lambda =32$ (black circles); and for comparison, HIT DNS at
  $Re_\lambda =31$ from Parsa et al. (Reference Parsa, Calzavarini, Toschi and Voth2012) (grey dashed-dotted line). Filled symbols are experimental measurements in RB for
  $\alpha =6$ and
  $1/6$.
  $(b)$ Local measurements in bulk and near-wall subdomains with the same normalisation as in panel
  $(a)$. Error bars on experimental data points are determined from the absolute difference of the same measurement in two equal data subsets.
A major difference between RB turbulence and HIT concerns the non-homogeneity caused by the presence of geometrical boundaries. Therefore, following the decomposition approach in Grossmann & Lohse (Reference Grossmann and Lohse2000) we divide the volume in two subsets, a central cubic volume of side  $H/3$ denoted as ‘bulk’ and the complement of it denoted as ‘near-wall’ region (see cartoon in figure 2b). Figure 2(b) shows the computed mean tumbling rates in the two regions both from experiments and simulations (note that we use the symbol
  $\langle \cdots \rangle$ to indicate a local-in-space average). Two observations are in order. First, this analysis confirms the strong inhomogeneity of the RB flow. The global tumbling rate appears to be dominated by the near-wall region, where it is twice as strong as in the bulk. Second, we observe very different trends for the quadratic tumbling rate versus
  $\alpha$ in the two regions.
In order to make sense of these two behaviours we normalise the mean tumbling rate with respect to the local dissipation scales in the two subregions, i.e. the energy dissipation rate  $\langle \epsilon \rangle$ is here computed either in bulk, or near-wall domains, see figure 3. For the bulk we observe a remarkable match with the measurements in HIT, proving that the flow gradient properties in the core of the RB system, at this
  $Ra$ number, are the same as in nearly homogeneous and isotropic turbulent flows. Interestingly, when the local energy dissipation rate rescaling is adopted, the near-wall tumbling rate falls below the bulk one. This behaviour can be contrasted with the one of an initially isotropic set of particles evolving in a steady plane shear flow, denoted as Jeffery orbits in the same figure. (Note that the behaviour for Jeffery orbits in figure 3 corrects the one provided in Parsa et al. (Reference Parsa, Calzavarini, Toschi and Voth2012, figure 4), which was affected by a normalisation error, hence the curve mentioned in that work should be multiplied by a factor 4/3. The mean normalised tumbling rate for Jeffery orbits is well approximated by
  $\alpha /(3\alpha ^{2}+3)$.)

Figure 3. Local measurements of mean squared tumbling rate in bulk and near-wall regions with the respective local energy dissipation rates normalisations ( $\langle \epsilon \rangle$ standing here either for
  $\langle \epsilon \rangle _{{bulk}}$ or
  $\langle \epsilon \rangle _{{near\text {-}wall}}$) as a function of aspect ratio
  $\alpha$. For comparison, we show HIT DNS at
  $Re_\lambda =32$ (black circles), Jeffery orbits (violet line) and a best fit of the linear-combination of the two latter curves:
  $a\times [ \langle \dot {p}_i \dot {p}_i \rangle \nu / \langle \epsilon \rangle ]_{{HIT}} + (1-a)\times [\langle \dot {p}_i \dot {p}_i \rangle \nu / \langle \epsilon \rangle ]_{\textit{Jeffery}}$ with coefficient
  $a=0.5 \pm 0.08$.
It is now tempting to speculate that the behaviour observed in the near-wall (and indeed globally dominant in the RB system) is a superposition of turbulence and steady shear. A test of this guess, based on a simplistic linear combination of the two mentioned tumbling rate behaviours does not fall far from the actual shape (see shaded region in figure 3). The linear combination fit provides an estimate for the background shear intensity comparable to the one of turbulent fluctuations. More importantly, it accounts for the observed local maximum that occurs for aspect ratios just below the unit value.
In order to support the hypothesis that a background shear affects the observed global tumbling rate, we study particle orientation with respect to the flow velocity. Figure 4(a) shows by means of DNS data that  $\alpha =6$ rods align with the velocity in the near-wall region, while
  $\alpha =1/6$ disks are orthogonal to it; on the contrary, in the bulk any preferential alignment vanishes. Note that the p.d.f. of the modulus of the cosine is considered here for symmetry reasons: due to the fore-and-aft symmetry of particles the parallel or antiparallel orientation with respect to a vector are equivalent. This qualitatively agrees with the Jeffery orbits phenomenology in a shear flow (Jeffery Reference Jeffery1922). Additionally, we also verified that rods/disks are biased towards parallel/perpendicular orientations to the cell walls, in agreement with the near-wall dynamics in turbulent channel flows (Marchioli et al. Reference Marchioli, Fantoni and Soldati2010; Challabotla et al. Reference Challabotla, Zhao and Andersson2015), see appendix 1 for details.

Figure 4.  $(a)$ The p.d.f. of the absolute value of the cosine of the angle of particle orientation with the fluid velocity,
  $|{\rm cos}\, \theta _{\boldsymbol {u},\boldsymbol {p}}| = |\boldsymbol {p} \boldsymbol {\cdot } \boldsymbol {u}|/\|\boldsymbol {u}\|$;
  $(b)$ the same for the temperature gradient,
  $|{\rm cos}\,\theta _{\boldsymbol {\nabla }T,\boldsymbol {p}}| = |\boldsymbol {p} \boldsymbol {\cdot } \boldsymbol {\nabla } T|/\|{\nabla }T\|$.
In figure 4(b) we also show that disk-like particles get strongly aligned with the temperature gradient,  $\boldsymbol {\nabla } T$, while rod-like particles stay weakly but preferentially orthogonal to it. This feature occurs equally well in the bulk and in near-wall and it is related to a similarity between the orientation equation for the particle and the evolution equation for the gradient of a scalar field advected by the fluid, as first proposed in Calzavarini et al. (Reference Calzavarini, Jiang and Sun2020). Indeed, (2.5) can be rewritten in terms of the evolution of an auxiliary non-unit vector,
  $\boldsymbol {q}(t)$, (Szeri Reference Szeri1993):
 \begin{equation} \boldsymbol{p}(t)=\frac{\boldsymbol{q}(t)}{\|\boldsymbol{q}(t)\|}, \quad \dot{\boldsymbol{q}}(t) = \left( \boldsymbol{\varOmega} + \frac{\alpha^{2}-1}{\alpha^{2}+1} \boldsymbol{\mathcal{S}} \right)\boldsymbol{q}. \end{equation}
The limit of a thin disk,  $\alpha \to 0$, in (3.1a,b) leads to an equation that apart from the diffusive term is formally identical to the one of the gradient of a scalar field,
  $T$, following the advection diffusion equation
 \begin{equation} \dot{\boldsymbol{q}}_{\alpha=0}(t) = - \boldsymbol{\nabla}\boldsymbol{u}^{T}\ \boldsymbol{q}_{\alpha=0},\quad \dot{\boldsymbol{\nabla}T} = - \boldsymbol{\nabla}\boldsymbol{u}^{T}\ \boldsymbol{\nabla}T + \kappa \Delta \boldsymbol{\nabla}T. \end{equation}
Similarly the opposite limit of a rod,  $\alpha \to \infty$, as first pointed out by Pumir & Wilkinson (Reference Pumir and Wilkinson2011), shares an analogous similarity with the vorticity (
 $\boldsymbol {\omega }$) equation of motion
 \begin{equation} \dot{\boldsymbol{q}}_{\alpha=\infty}(t) = \boldsymbol{\nabla}\boldsymbol{u}\ \boldsymbol{q}_{\alpha=\infty}, \quad \dot{\boldsymbol{\omega}} = \boldsymbol{\nabla}\boldsymbol{u}\ \boldsymbol{\omega} + \nu \Delta \boldsymbol{\omega}. \end{equation}
Note that while the former equivalence becomes exact in the limit of  $Pr \to \infty$, the latter one occurs in the opposite limit
  $Pr \to 0$. As a consequence one should expect a correlation between the rotational dynamics of the temperature gradient with the orientation of a disk; such a correlation is only approximate owing to the presence of thermal dissipation and to the different initial conditions for the particle and thermal gradient orientations. However, the correlation effect is particularly evident in the present flow due to the high value of
  $Pr$ which makes the decorrelating effect of thermal diffusivity negligible. We also observe that
  $\boldsymbol {q}_{\alpha =\infty }\boldsymbol {\cdot } \boldsymbol {q}_{\alpha =0} = const.$, suggesting that rod-like particles would be most likely not be in line with the thermal gradient direction. Appendix 2 reports complementary measurements on particle preferential alignment with the vorticity and rate-of-strain eigenvalues both in RB and HIT.
The measurements presented so far support the hypothesis that the global tumbling rate in RB is affected by a persistent background shear flow coexisting with turbulent fluctuations. In order to better study the effect of this superposition and the sensitivity of particle tumbling to the relative intensity of shear as compared with turbulence, we build a synthetic velocity gradient field as follows:
 \begin{equation} \boldsymbol{\nabla} \boldsymbol{u}_{s}(t) = \frac{1}{\sqrt{1+s^{2}}}\left( \boldsymbol{\nabla} \boldsymbol{u}(t) + \left( \begin{array}{ccc} 0 & s\ \tau_{\eta}^{-1} & 0 \\ 0 & 0 & 0\\ 0 & 0 & 0 \end{array}\right) \right). \end{equation}
Here  $\boldsymbol {\nabla } \boldsymbol {u}(t)$ comes from a DNS record of the evolution of the gradient tensor along Lagrangian trajectories in HIT, while
  $s$ is an adjustable shear intensity coefficient in
  $\tau _{\eta }$ units. Note that the overall normalisation is constructed in such a way that the mean dissipative time (
 $\tau _{\eta }$) of the resulting gradient field
  $\boldsymbol {\nabla } \boldsymbol {u}_{s}$ is the same as the one of the original HIT field
  $\boldsymbol {\nabla } \boldsymbol {u}(t)$. This allows us to compare the shear intensity with the amplitude of the global field. As a caveat, we note that (3.4) is a rough approximation of a realistic turbulent shear flow, where velocity gradient fluctuations have specific signatures (Pumir Reference Pumir2017), and obviously also as a simplistic approximation of an RB flow. The mean tumbling rate of an initially random uniformly oriented set of particles evolved along many of such gradient trajectories is reported in figure 5. The family of curves, corresponding to different values of
  $s$, show similar features to the ones of the quadratic tumbling rate measured in the RB cell. Interestingly, this model provides an estimate,
  $s^{*} = 2 \pm 0.3$, of the background shear-rate intensity as compared with the turbulent velocity gradient fluctuations. The estimated associated time scale (
 $\tau _{s}$ for shear) expressed in the dissipative time of the synthetic global field (
 $\tau _{\eta }$) turns out to be
  $\tau _{s} = \tau _{\eta } \sqrt {1+s^{*2}}/s^{*} \simeq 1.1 \pm 0.1 \tau _{\eta }$.

Figure 5. Mean quadratic tumbling rate versus the particle aspect ratio as obtained evolving a particle ensemble with (3.4) where the intensity of the background shear field is  $s$ times the average intensity of the HIT velocity gradient fluctuations. The pure HIT case
  $s=0$ (black line); the pure shear case, Jeffery orbits
  $s=\infty$ (violet line); and the measurements in RB from DNS (diamonds) are also drawn.
We note that this intensity is incompatible with a persistent shear-rate determined by the large-scale circulation turnover time, because here  $T=H/u_{rms} \simeq 24 \tau _{\eta }$, while it is much closer to the time scale associated with the kinetic BL
  $\tau _{BL} = \delta /u_{rms} = T Re^{-1/2} \simeq 1.6 \tau _{\eta }$.
Finally, it is tempting to ask what will be the fate of the mean quadratic tumbling intensity as a function of  $\alpha$ with varying Rayleigh number. This can be guessed dimensionally by considering (see Shraiman & Siggia (Reference Shraiman and Siggia1990) and Grossmann & Lohse (Reference Grossmann and Lohse2000) for the estimates) that
  $\langle \epsilon \rangle _{BL} \sim \nu (u_{rms}/\delta )^{2}$ and occupies a volume
  $V_{BL}=(H^{3} -(H-2\delta )^{3})$ while
  $\langle \epsilon \rangle _{bulk}\sim u_{rms}^{3}/(H-2\delta )$ occurs in a volume
  $V_{bulk}=(H-\delta )^{3}$ (where bulk denotes here the total volume minus the one occupied by BLs). With this we evaluate
  $s^{*} \sim \sqrt {\langle \epsilon \rangle _{BL} V_{BL}}/\sqrt {\langle \epsilon \rangle _{bulk} V_{bulk}} \sim Re^{-1/2}$, which is bound to decrease to zero as
  $Ra$ increases (because
  $Re\sim Ra^{1/2}$). Similarly,
  $(\tau _{s}/\tau _{\eta })^{2} \simeq (\overline {\epsilon } H^{3})/(\langle \epsilon \rangle _{BL} V_{BL})$ increases with
  $Ra$, meaning that the relative importance of the mean shear will reduce with respect to turbulence. However, we remark that the above dimensional argument is speculative and shall be put under scrutiny by future experimental/numerical studies capable of accessing higher
  $Ra$ number conditions.
4. Summary
In summary, the orientation dynamics of inertialess anisotropic particles advected by RB turbulent convection is studied by experiments and simulations. The heavy tail distributions of tumbling rate show that the flow possesses similar extreme small-scale fluctuations as in HIT, despite the difference in the Reynolds number. On the contrary, the mean tumbling rate dependence on the particle aspect-ratio displays a maximum for weakly oblate particles ( $\alpha \lesssim 1$), rather than the universal monotonic decreasing trend observed in homogeneous and isotropic turbulence. The mean tumbling rate is highly inhomogeneous across the system, larger in the outer regions, weaker in the bulk where remarkably the mean tumbling rate behaviour of HIT is fully recovered (both in magnitude and
  $\alpha$ dependence). We show that the peculiar trend observed in the RB system is due to the combined effect of turbulent fluctuations and a persistent mean shear flow component. This is supported by the observed parallel (orthogonal) alignment of prolate (oblate) particles with the local fluid velocity, a trait of Jeffery orbits in steady plane shear flows. By means of a synthetic shear turbulence model we estimate that the mean shear-rate intensity necessary to produce the observed tumbling dynamics in the RB cell in the present conditions is of the order of the inverse global Kolmogorov time scale.
We revealed that the rotation statistics of particles advected by a realistic wall-bounded thermally driven turbulent flow is on a global level fundamentally different from the one measured in unbounded turbulent flows, due to the effect of persistent torques induced by the wall boundary layers. These results have implications for the study of particle rotational dynamics in the wider class of turbulent flows with shear, where they can improve the interpretations of already available measurements. Future studies should focus on a more detailed quantification of rotation rates of anisotropic particles as a function of the distance from the wall in turbulent flow conditions. Such a characterisation demands for extremely long simulations/experiments in order to have converged statistics. Finally, the revealed preferential alignments with velocity and temperature gradient may be relevant for the modelling of the dynamics of aspherical organisms transported by shear dominated turbulence (Guasto, Rusconi & Stocker Reference Guasto, Rusconi and Stocker2012), with or without thermal effects (Borgnino et al. Reference Borgnino, Gustavsson, De Lillo, Boffetta, Cencini and Mehlig2019).
Acknowledgements
We gratefully acknowledge V. Mathai and X. Ma for their help with experiments, and Detlef Lohse for useful discussions. E.C. acknowledges useful discussions with B. Mehlig and G. Verhille. This work is financially supported by the Natural Science Foundation of China under grant no. 11988102, 91852202, 11861131005 and 11672156, and Tsinghua University Initiative Scientific Research Program (20193080058).
Appendix A. Additional measurements on particle alignment
A.1. Alignment with RB cell walls
In order to further support the hypothesis that a background shear flow affects the global tumbling rate in the RB cell we study the alignments of particle orientation with the wall directions. For this analysis we have further decomposed the near-wall domain in subregions localised either next to the horizontal or vertical boundaries (see cartoon on figure 6). We denote them as ‘top and bottom’ or ‘sides’ domains. Our DNS measurements provide evidence that prolate particles (here  $\alpha =6$) are preferentially parallel to walls, while oblate ones (
 $\alpha =1/6$) are mostly orthogonal to them, see figure 6. These observations are consistent with the preferential orientations detected close-to-wall in simulations of anisotropic particles in turbulent channel flows, see Marchioli et al. (Reference Marchioli, Fantoni and Soldati2010) for rods and Challabotla et al. (Reference Challabotla, Zhao and Andersson2015) for disks.

Figure 6. Decomposition of the near-wall domain (as defined in the main paper) in subregions localised either next to the horizontal or vertical boundaries. We denote them as ‘top and bottom’ or ‘sides’ domains (see cartoon on bottom of the figure). Alignment of particles with wall directions for ‘top and bottom’ wall (solid lines) and the ‘sides’ wall (dashed lines) for  $(a)$
$(a)$ $\alpha = 6$ and
  $(b)$
$(b)$ $\alpha = 1/6$. Note that the vertical direction in our system is along the
  $y$ axis.
A.2. Alignment with velocity, vorticity, rate-of-strain and thermal gradient
We look here at the mean alignment, more precisely at the absolute value of the cosine angle between the particle director  $\boldsymbol {p}$ and several physical quantities: the flow velocity
  $\boldsymbol {u}$, the vorticity
  $\boldsymbol {\omega }$, the eigenvectors of the rate-of-strain tensor
  $\boldsymbol {e}_1,\boldsymbol {e}_2,\boldsymbol {e}_3$ and the temperature gradient
  $\boldsymbol {\nabla }T$. Figure 7(a) shows the measurements for the RB system from DNS at
  $Ra=10^{9}$,
  $Pr=40$, while figure 7(b) shows the corresponding data for the HIT flow at
  $Re_{\lambda }=32$, i.e. at comparable Reynolds number as the one estimated for the bulk. In the RB system the strongest alignment is observed for oblate particles with the temperature gradient direction. Prolate particles maximally align with the velocity field. It appears that they are also correlated with
  $\boldsymbol {e}_1$ and to a lesser extent to the vorticity. This is contrasted by the measurements in isothermal HIT, where prolate particles maximally align with the vorticity orientation and to a lesser extent with
  $\boldsymbol {e}_2$ as first proposed in Pumir & Wilkinson (Reference Pumir and Wilkinson2011) and measured in Ni et al. (Reference Ni, Ouellette and Voth2014, Reference Ni, Kramel, Ouellette and Voth2015) and Byron et al. (Reference Byron, Einarsson, Gustavsson, Voth, Mehlig and Variano2015). We note, however, that also the alignment with the velocity is not negligible. This is to be attributed to the small turbulence level of the present conditions; we have verified that at higher
  $Re$ such a correlation vanishes.

Figure 7.  $(a)$ Alignments of particles with unit velocity vector
  $\boldsymbol {e}_u$, vorticity vector
  $\boldsymbol {e}_{\omega }$, rate-of-strain eigenvectors
  $\boldsymbol {e}_{1,2,3}$ and thermal gradient
  $\boldsymbol {e}_{\nabla T}$ in RB system as a function of aspect ratio
  $\alpha$.
  $(b)$ Alignments of particles with unit velocity vector
  $\boldsymbol {e}_u$, vorticity vector
  $\boldsymbol {e}_{\omega }$, rate-of-strain eigenvectors
  $\boldsymbol {e}_{1,2,3}$ in HIT (
 $Re_{\lambda }=32$) as a function of aspect ratio
  $\alpha$.


