


1 Introduction
The well-known actuator disc model was introduced by Lanchester, Betz and Joukowsky to estimate the performance of a wind turbine in laterally unbounded flow (van Kuik Reference van Kuik2007). The main feature of this model is that the complicated flow structures around the individual turbine blades are avoided by replacing the turbine with a permeable actuator disc that provides a uniform retarding force across its area. This simplification permits an analytical solution of the bulk flow velocity through the turbine and an estimate of the maximum power that can be extracted, referred to commonly as the Betz limit (Burton et al. Reference Burton, Sharpe, Jenkins and Bossanyi2001). However, despite these advantages, a well-known limitation of the classical actuator disc model is that it assumes that the flow is steady and spatially uniform upstream of the turbine. In practice this is rarely the case since turbines (both wind and tidal, for example) operate in turbulent flow that is sheared in the vertical and/or horizontal plane.
As a result of this limitation, detailed studies into the performance of turbines in turbulent shear flow have generally focussed on laboratory and field testing, as well as numerical modelling (see, for example, experimental work reviewed in Vermeer, Sørensen & Crespo (Reference Vermeer, Sørensen and Crespo2003) and reviews on numerical modelling by Sørensen (Reference Sørensen2011) and Sanderse, Pijl & Koren (Reference Sanderse, Pijl and Koren2011)). These more detailed approaches provide important insight into turbine performance in turbulent shear flow, including, for example, the description of blade force time histories (so as to estimate power generation and structural fatigue) and turbine wake characteristics (which may impact on downstream turbines in a farm and therefore farm efficiency). Nevertheless, the generation of experimental and numerical results is still much less efficient than using simple actuator disc models. Furthermore, most of these experimental and numerical results do not, in themselves, allow for straightforward interpretation of the relative contributions of shear and turbulence on the power performance of a turbine. Consequently, extrapolation of results obtained in one flow condition (with particular shear profile and turbulence characteristics) to a different flow condition is difficult. This is especially true for experimental and numerical results obtained in laterally bounded flows (as may be applicable for turbines in tunnels, flumes or shallow water flows) where it is known that geometric blockage effects will impact power performance (Garrett & Cummins Reference Garrett and Cummins2007; Houlsby, Draper & Oldfield Reference Houlsby, Draper and Oldfield2008; Whelan, Graham & Peiro Reference Whelan, Graham and Peiro2009) however, blockage in sheared flow, and therefore the ability to extrapolate model results to full-scale conditions, is not well understood.
In light of these limitations, the primary aim of this paper is to improve interpretation and extrapolation of experimental and numerical modelling results for turbines in turbulent shear flow by investigating and quantifying the effect of shear, alone, on the performance of an ideal turbine. To work towards this aim we extend the classical actuator disc model to incorporate a steady, inviscid shear flow. This extension builds on earlier work presented in Draper, Nishino & Adcock (Reference Draper, Nishino and Adcock2014) and considers both the problem of laterally unbounded flow, which may be most applicable to full-scale wind turbines, as well as laterally bounded flow, which allows for an investigation of blockage in sheared flow.
A second motivation for the work in this paper is to build on recent observations concerning the performance of turbines in shear flow. In particular, Wagner et al. (Reference Wagner, Courtney, Gottshall and Lindelöw-Marsden2011) and Fleming, McIntosh & Willden (Reference Fleming, McIntosh and Willden2013) have suggested that to properly compare the performance of turbines in different shear flows the traditional definition of the power coefficient should be altered. Specifically, they suggest that the average of the cube of the velocity passing through an upstream area equal to the turbine swept area should be used to calculate the coefficient, as opposed to the cube of another reference velocity (such as the velocity at the hub height of the turbine). Both Wagner et al. (Reference Wagner, Courtney, Gottshall and Lindelöw-Marsden2011) and Fleming et al. (Reference Fleming, McIntosh and Willden2013) provide support for this suggestion by demonstrating that the corrected power coefficient appears to explain variations in power performance observed in field measurements of wind turbines and blade-resolved numerical simulations of tidal turbines, respectively. However, although these comparisons are promising, they are for turbines having small geometric blockage of
 ${\sim}$
10 % or less (where geometric blockage is defined as the ratio of turbine swept area to cross-sectional area of the flow) and so it is not yet clear if the correction is also appropriate for larger blockage ratios, as may be experienced in experimental arrangements or in tidal turbine arrays where large blockage ratios are known to be potentially beneficial (see, for example, Vennell Reference Vennell2010). Furthermore, for laterally unbounded flow, the suggested correction of Wagner et al. (Reference Wagner, Courtney, Gottshall and Lindelöw-Marsden2011) and Fleming et al. (Reference Fleming, McIntosh and Willden2013) is not the same as a recent proposed correction derived theoretically by Chamorro & Arndt (Reference Chamorro and Arndt2013). Therefore it appears that further investigation is required to understand turbine performance in both laterally unbounded and laterally bounded shear flow.
${\sim}$
10 % or less (where geometric blockage is defined as the ratio of turbine swept area to cross-sectional area of the flow) and so it is not yet clear if the correction is also appropriate for larger blockage ratios, as may be experienced in experimental arrangements or in tidal turbine arrays where large blockage ratios are known to be potentially beneficial (see, for example, Vennell Reference Vennell2010). Furthermore, for laterally unbounded flow, the suggested correction of Wagner et al. (Reference Wagner, Courtney, Gottshall and Lindelöw-Marsden2011) and Fleming et al. (Reference Fleming, McIntosh and Willden2013) is not the same as a recent proposed correction derived theoretically by Chamorro & Arndt (Reference Chamorro and Arndt2013). Therefore it appears that further investigation is required to understand turbine performance in both laterally unbounded and laterally bounded shear flow.
To incorporate shear flow into the classical actuator disc model we introduce two main assumptions in this paper. Firstly, since the upstream velocity profile is generally non-uniform it is no longer appropriate to assume (as is typical in the classical model) that the disc applies a uniform streamwise force on the fluid. We will therefore assume instead that a turbine can be represented by an ideal disc with uniform local resistance (i.e. uniform local drag coefficient, as opposed to a uniform force). This alternative definition is convenient because, although the axial resistance of actual turbines may vary over their radius, uniform resistance is a useful reference case and will be a reasonable first approximation for some turbines. It is also likely to be representative of actual porous discs, which are often used to emulate arrays of turbines in experiments (e.g. Myers & Bahaj Reference Myers and Bahaj2012) and is of relevance to the estimation of drag on offshore structures generally (following the seminal work of Taylor (Reference Taylor1991), for example).
Secondly, to model the flow passing through the actuator disc analytically we will assume (as is common in blade element momentum theory; Burton et al. Reference Burton, Sharpe, Jenkins and Bossanyi2001) that there is negligible lateral (or spanwise) interaction across the flow passing through the disc; i.e. we will assume that, as outlined in more detail in § 2, the momentum balance in each annuli of fluid passing through the disc (or slab of fluid for a rectangular actuator strip) is not affected by streamwise flow expansion in neighbouring annuli. To validate this assumption we will compare the theoretical model with numerical simulations approximating the incompressible Euler equations in § 5.
Making use of these two assumptions we extend the classical model in stages in the remainder of the paper, beginning with laterally unbounded flow and then considering the more general problem of laterally bounded flow. Following this we present solutions for some example shear flows, before comparing with numerical simulations. Throughout the paper we choose to focus on two-dimensional flows, in which the disc becomes a strip with a spanwise dimension
 $l$
. This configuration is mathematically convenient and has application to practically important configurations of turbines (discussed further in § 6).
$l$
. This configuration is mathematically convenient and has application to practically important configurations of turbines (discussed further in § 6).
2 Laterally unbounded shear flow
To incorporate shear flow in the classical actuator disc model we start by considering an actuator strip operating in a symmetric shear flow with no lateral boundary and streamwise velocity
 $u(x_{1},z)=u(x_{1},|z|)=u_{1}(|z|)\geqslant 0$
; the coordinates being defined so that
$u(x_{1},z)=u(x_{1},|z|)=u_{1}(|z|)\geqslant 0$
; the coordinates being defined so that
 $x_{1}$
is a location far upstream of the strip where the flow is undisturbed by the strip’s presence and
$x_{1}$
is a location far upstream of the strip where the flow is undisturbed by the strip’s presence and
 $z$
is a spanwise coordinate which takes a value of zero at the strip centre (figure 1). As in the classical actuator disc analysis we also assume that the flow is steady, incompressible and inviscid.
$z$
is a spanwise coordinate which takes a value of zero at the strip centre (figure 1). As in the classical actuator disc analysis we also assume that the flow is steady, incompressible and inviscid.

Figure 1. Assumed flow through a strip. (a)
 $x{-}z$
plane; (b)
$x{-}z$
plane; (b)
 $x{-}{\it\psi}$
plane. The solid horizontal lines indicate lateral boundaries separated by the distance
$x{-}{\it\psi}$
plane. The solid horizontal lines indicate lateral boundaries separated by the distance
 $l/B$
, where
$l/B$
, where
 $B$
is the geometric blockage ratio (introduced in § 3). For laterally unbounded flow
$B$
is the geometric blockage ratio (introduced in § 3). For laterally unbounded flow
 $B=0$
. The translated
$B=0$
. The translated
 $x{-}z^{\prime }$
and
$x{-}z^{\prime }$
and
 $x{-}{\it\psi}^{\prime }$
coordinate systems are used in § 4.2.
$x{-}{\it\psi}^{\prime }$
coordinate systems are used in § 4.2.
To extract power the strip must offer a resistance to the flow. Focusing on an infinitesimal control volume bounded by two neighbouring streamlines (or stream surfaces) and intersecting an area of strip
 ${\it\delta}l$
(per unit width), we can introduce this resistance as a force
${\it\delta}l$
(per unit width), we can introduce this resistance as a force
 ${\it\delta}T$
on the fluid (figure 1). Because of this force, the fluid passing through the strip is reduced to
${\it\delta}T$
on the fluid (figure 1). Because of this force, the fluid passing through the strip is reduced to
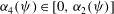
 $u(x_{2},{\it\psi})=u_{2}({\it\psi})={\it\alpha}_{2}({\it\psi})u_{1}({\it\psi})$
, where
$u(x_{2},{\it\psi})=u_{2}({\it\psi})={\it\alpha}_{2}({\it\psi})u_{1}({\it\psi})$
, where
 ${\it\alpha}_{2}({\it\psi})\in [0,1]$
,
${\it\alpha}_{2}({\it\psi})\in [0,1]$
,
 $u_{1}({\it\psi})$
is the upstream velocity entering the control volume and
$u_{1}({\it\psi})$
is the upstream velocity entering the control volume and
 ${\it\psi}$
is the average value of the stream function defining the streamlines bounding the control volume (see figure 1
b). Far downstream of the strip the pressure is assumed to be constant for any
${\it\psi}$
is the average value of the stream function defining the streamlines bounding the control volume (see figure 1
b). Far downstream of the strip the pressure is assumed to be constant for any
 ${\it\psi}$
, and the velocity in the control volume reduces further to
${\it\psi}$
, and the velocity in the control volume reduces further to
 $u(x_{4},{\it\psi})=u_{4}({\it\psi})={\it\alpha}_{4}({\it\psi})u_{1}({\it\psi})$
, with
$u(x_{4},{\it\psi})=u_{4}({\it\psi})={\it\alpha}_{4}({\it\psi})u_{1}({\it\psi})$
, with
 ${\it\alpha}_{4}({\it\psi})\in [0,{\it\alpha}_{2}({\it\psi})]$
.
${\it\alpha}_{4}({\it\psi})\in [0,{\it\alpha}_{2}({\it\psi})]$
.
With this problem definition we can now relate the velocity coefficients within the control volume to the force applied by the strip and, in turn, the power removed by the strip. This analysis proceeds in the same way as in the classical actuator disc theory, except that we will focus here on the differential fluid element within the control volume rather than the whole disc/strip. To do this we start by using an argument of mass conservation to deduce that
 $$\begin{eqnarray}{\it\delta}l_{1}={\it\alpha}_{2}({\it\psi}){\it\delta}l\quad \text{and}\quad {\it\delta}l_{4}=({\it\alpha}_{2}({\it\psi})/{\it\alpha}_{4}({\it\psi})){\it\delta}l,\end{eqnarray}$$
where
 ${\it\delta}l_{1}$
and
${\it\delta}l_{1}$
and
 ${\it\delta}l_{4}$
define the width of the control volume far upstream and far downstream of the strip, respectively. Next, we can apply the Bernoulli equation separately upstream and downstream of the strip to obtain an expression for the pressure difference across the strip
${\it\delta}l_{4}$
define the width of the control volume far upstream and far downstream of the strip, respectively. Next, we can apply the Bernoulli equation separately upstream and downstream of the strip to obtain an expression for the pressure difference across the strip
 $$\begin{eqnarray}{\rm\Delta}p({\it\psi})=p(x_{2},{\it\psi})-p(x_{3},{\it\psi})={\textstyle \frac{1}{2}}{\it\rho}[u_{1}({\it\psi})]^{2}(1-[{\it\alpha}_{4}({\it\psi})]^{2}),\end{eqnarray}$$
where
 $x_{2}$
and
$x_{2}$
and
 $x_{3}$
are locations immediately upstream and downstream of the strip,
$x_{3}$
are locations immediately upstream and downstream of the strip,
 $p$
represents pressure and
$p$
represents pressure and
 ${\it\rho}$
is fluid density. Finally, to complete the analysis, conservation of streamwise momentum (for the control volume) leads to
${\it\rho}$
is fluid density. Finally, to complete the analysis, conservation of streamwise momentum (for the control volume) leads to
 $$\begin{eqnarray}-{\it\delta}T={\it\rho}u_{1}({\it\psi}){\it\alpha}_{2}({\it\psi}){\it\delta}l[({\it\alpha}_{4}({\it\psi})-1)]u_{1}({\it\psi})-{\it\delta}X,\end{eqnarray}$$
where
 $$\begin{eqnarray}{\it\delta}X=\oint _{CV}p_{\boldsymbol{x}}\,\text{d}s,\end{eqnarray}$$
and
 $p_{x}$
is the streamwise component of pressure acting normal to the surface of the control volume.
$p_{x}$
is the streamwise component of pressure acting normal to the surface of the control volume.
Noting that
 ${\rm\Delta}p={\it\delta}T/{\it\delta}l$
(to satisfy static equilibrium across the strip) equations (2.1)–(2.3) can be combined to obtain a relationship between the velocity coefficient at the strip and the coefficient in the wake. This relationship is equivalent to that given by Sørensen (Reference Sørensen2011) (neglecting azimuthal velocity) and can be written as
${\rm\Delta}p={\it\delta}T/{\it\delta}l$
(to satisfy static equilibrium across the strip) equations (2.1)–(2.3) can be combined to obtain a relationship between the velocity coefficient at the strip and the coefficient in the wake. This relationship is equivalent to that given by Sørensen (Reference Sørensen2011) (neglecting azimuthal velocity) and can be written as
 $$\begin{eqnarray}{\it\alpha}_{2}({\it\psi})=\frac{1+{\it\alpha}_{4}({\it\psi})}{2}\left(1-\frac{{\it\delta}X}{{\it\delta}T}\right).\end{eqnarray}$$
Importantly, because we have focused on a differential fluid element, the result in (2.5) is applicable at any location on the strip and is therefore a more general result than that which may be obtained by enclosing the entire actuator strip within a control volume. Interpreted directly, (2.5) indicates that at any given location on the strip the velocity is equal to the average of the upstream and downstream velocity on the same streamline only if there is no net forcing due to the pressure acting on the surface of the control volume. Goorjian (Reference Goorjian1972) first outlined that this net forcing will not be zero in general, whilst more recently Sørensen (Reference Sørensen2011) has reported that
 ${\it\delta}X/{\it\delta}T$
can reach 5 % for a numerical actuator disc. Nevertheless, as mentioned in the Introduction, it is common in blade element momentum theory to assume that
${\it\delta}X/{\it\delta}T$
can reach 5 % for a numerical actuator disc. Nevertheless, as mentioned in the Introduction, it is common in blade element momentum theory to assume that
 ${\it\delta}X=0$
in (2.5) for all fluid elements passing through the disc (Sørensen Reference Sørensen2011). This is equivalent to assuming that the fluid within each control volume is able to expand independently of neighbouring control volumes as it passes through the strip. Partly due to simplicity, and partly due to the general success of blade element momentum theory in practice, we adopt this same assumption of lateral (or spanwise) independence in this paper. As noted in the Introduction, comparisons with numerical simulations are presented in § 5 to validate this assumption in the context of shear flow.
${\it\delta}X=0$
in (2.5) for all fluid elements passing through the disc (Sørensen Reference Sørensen2011). This is equivalent to assuming that the fluid within each control volume is able to expand independently of neighbouring control volumes as it passes through the strip. Partly due to simplicity, and partly due to the general success of blade element momentum theory in practice, we adopt this same assumption of lateral (or spanwise) independence in this paper. As noted in the Introduction, comparisons with numerical simulations are presented in § 5 to validate this assumption in the context of shear flow.
Taking
 ${\it\delta}X=0$
in (2.5) it is now straightforward to obtain an expression for the power removed by the entire strip (per unit width), which is
${\it\delta}X=0$
in (2.5) it is now straightforward to obtain an expression for the power removed by the entire strip (per unit width), which is
 $$\begin{eqnarray}\displaystyle P & = & \displaystyle \int _{-l/2}^{l/2}u_{2}(z){\rm\Delta}p(z)\,\text{d}z=\int _{-{\it\psi}_{1}/2}^{{\it\psi}_{1}/2}{\rm\Delta}p({\it\psi})\,\text{d}{\it\psi}\nonumber\\ \displaystyle & = & \displaystyle \frac{1}{2}{\it\rho}\int _{-{\it\psi}_{1}/2}^{{\it\psi}_{1}/2}4[u_{1}({\it\psi})]^{2}({\it\alpha}_{2}({\it\psi})-[{\it\alpha}_{2}({\it\psi})]^{2})\,\text{d}{\it\psi},\end{eqnarray}$$
where continuity has been used to write the result in terms of the stream function (i.e. we have converted to stream function coordinates by noting that
 $\partial {\it\psi}/\partial z=u$
) and the parameter
$\partial {\it\psi}/\partial z=u$
) and the parameter
 ${\it\psi}_{1}$
represents the total volume flux passing through the strip, which is given implicitly by
${\it\psi}_{1}$
represents the total volume flux passing through the strip, which is given implicitly by
 $$\begin{eqnarray}l=\int _{-l/2}^{l/2}\,\text{d}z=\int _{-{\it\psi}_{1}/2}^{{\it\psi}_{1}/2}\frac{\text{d}{\it\psi}}{{\it\alpha}_{2}({\it\psi})u_{1}({\it\psi})}.\end{eqnarray}$$
Presuming that
 ${\it\alpha}_{2}({\it\psi})$
is known at all points on the strip, (2.6) and (2.7) provide the general solution for the extracted power (assuming lateral independence) in a steady, inviscid shear flow. Alternatively, if a local disc resistance
${\it\alpha}_{2}({\it\psi})$
is known at all points on the strip, (2.6) and (2.7) provide the general solution for the extracted power (assuming lateral independence) in a steady, inviscid shear flow. Alternatively, if a local disc resistance
 $k({\it\psi})$
is defined such that
$k({\it\psi})$
is defined such that
 $$\begin{eqnarray}{\rm\Delta}p({\it\psi})={\textstyle \frac{1}{2}}{\it\rho}k({\it\psi})[u_{2}({\it\psi})]^{2}\end{eqnarray}$$
(i.e. for a space-frame structure
 $k$
is equivalent to the product of a local Morison-type quadratic drag coefficient and the ratio of hydrodynamic to frontal area of the obstacle; Taylor Reference Taylor1991; Santo et al.
Reference Santo, Taylor, Bai and Choo2014) the results in (2.6) and (2.7) can be rewritten in terms of the local resistance as
$k$
is equivalent to the product of a local Morison-type quadratic drag coefficient and the ratio of hydrodynamic to frontal area of the obstacle; Taylor Reference Taylor1991; Santo et al.
Reference Santo, Taylor, Bai and Choo2014) the results in (2.6) and (2.7) can be rewritten in terms of the local resistance as
 $$\begin{eqnarray}P=\frac{1}{2}{\it\rho}\int _{-{\it\psi}_{1}/2}^{{\it\psi}_{1}/2}\frac{16k({\it\psi})}{(k({\it\psi})+4)^{2}}[u_{1}({\it\psi})]^{2}\,\text{d}{\it\psi},\quad \text{with }l=\frac{1}{4}\int _{-{\it\psi}_{1}/2}^{{\it\psi}_{1}/2}\frac{k({\it\psi})+4}{u_{1}({\it\psi})}\,\text{d}{\it\psi}.\end{eqnarray}$$
In the remainder of this section we investigate the power removed by the strip by solving (2.9). To start, we consider our main scenario in which
 $k$
is assumed to be constant across the strip; i.e. the strip has uniform resistance. For this case it follows immediately from (2.5) (with
$k$
is assumed to be constant across the strip; i.e. the strip has uniform resistance. For this case it follows immediately from (2.5) (with
 ${\it\delta}X=0$
), and from comparing (2.2) with (2.8), that
${\it\delta}X=0$
), and from comparing (2.2) with (2.8), that
 ${\it\alpha}_{2}$
and
${\it\alpha}_{2}$
and
 ${\it\alpha}_{4}$
are also constant in the spanwise direction; i.e. the velocity profile is self-similar at locations upstream, downstream and at the turbine when the local resistance is uniform. It is therefore possible to convert (2.9) into an integral upstream of the strip, such that
${\it\alpha}_{4}$
are also constant in the spanwise direction; i.e. the velocity profile is self-similar at locations upstream, downstream and at the turbine when the local resistance is uniform. It is therefore possible to convert (2.9) into an integral upstream of the strip, such that
 $$\begin{eqnarray}P=\frac{1}{2}{\it\rho}\frac{16k}{(k+4)^{2}}\int _{-{\it\psi}_{1}/2}^{{\it\psi}_{1}/2}[u_{1}({\it\psi})]^{2}\,\text{d}{\it\psi}=\frac{1}{2}{\it\rho}\frac{16k}{(k+4)^{2}}\int _{-l_{1}/2}^{l_{1}/2}[u_{1}(z)]^{3}\,\text{d}z.\end{eqnarray}$$
Rearranging (2.10), noting that
 $l_{1}={\it\alpha}_{2}l=4l/(k+4)$
, gives the power coefficient:
$l_{1}={\it\alpha}_{2}l=4l/(k+4)$
, gives the power coefficient:
 $$\begin{eqnarray}C_{P}=\frac{P}{{\textstyle \frac{1}{2}}{\it\rho}l\overline{U_{\ast }^{3}}}=\frac{64k}{(k+4)^{3}},\quad \text{with }\overline{U_{\ast }^{3}}=\frac{1}{l_{1}}\int _{-l_{1}/2}^{l_{1}/2}[u_{1}(z)]^{3}\,\text{dz}.\end{eqnarray}$$
This power coefficient varies with strip resistance in exactly the same way as the power coefficient for a disc in uniform flow and is a maximum when
 $k=2$
so that
$k=2$
so that
 $C_{P,max}=16/27$
. Equation (2.11a
) therefore demonstrates that for a uniform actuator in an inviscid shear flow the power coefficient is identical to that in uniform flow, provided that the average of the cube of the upstream velocity of the fluid passing through the actuator is used in the normalisation (i.e.
$C_{P,max}=16/27$
. Equation (2.11a
) therefore demonstrates that for a uniform actuator in an inviscid shear flow the power coefficient is identical to that in uniform flow, provided that the average of the cube of the upstream velocity of the fluid passing through the actuator is used in the normalisation (i.e.
 $\overline{U_{\ast }^{3}}$
). This result is different to that introduced by Wagner et al. (Reference Wagner, Courtney, Gottshall and Lindelöw-Marsden2011) and Fleming et al. (Reference Fleming, McIntosh and Willden2013), who suggested the integral in (2.11b
) should be in terms of the upstream velocity evaluated over the full area of the strip (i.e.
$\overline{U_{\ast }^{3}}$
). This result is different to that introduced by Wagner et al. (Reference Wagner, Courtney, Gottshall and Lindelöw-Marsden2011) and Fleming et al. (Reference Fleming, McIntosh and Willden2013), who suggested the integral in (2.11b
) should be in terms of the upstream velocity evaluated over the full area of the strip (i.e.
 $l$
instead of
$l$
instead of
 $l_{1}$
). We note, though, that in most practical situations, performing the upstream integration over the full strip area
$l_{1}$
). We note, though, that in most practical situations, performing the upstream integration over the full strip area
 $l$
will give similar results to (2.11a
), especially for actuators with small local resistance or for shear flow that is close to uniform across the plane of the strip. The result in (2.11) is also different to that given by Chamorro & Arndt (Reference Chamorro and Arndt2013). This difference arises because here we focus on an actuator strip with uniform local resistance, whereas in Chamorro & Arndt (Reference Chamorro and Arndt2013) their analysis requires that the pressure difference
$l$
will give similar results to (2.11a
), especially for actuators with small local resistance or for shear flow that is close to uniform across the plane of the strip. The result in (2.11) is also different to that given by Chamorro & Arndt (Reference Chamorro and Arndt2013). This difference arises because here we focus on an actuator strip with uniform local resistance, whereas in Chamorro & Arndt (Reference Chamorro and Arndt2013) their analysis requires that the pressure difference
 ${\rm\Delta}p$
, and therefore the force per unit frontal area, is uniform across the actuator (see, for example, their equations (9) and (15)). Consequently, their result is intended for turbines or porous obstructions that provide a uniform force in non-uniform flow (which would be possible for a particular variation of flow resistance across the actuator).
${\rm\Delta}p$
, and therefore the force per unit frontal area, is uniform across the actuator (see, for example, their equations (9) and (15)). Consequently, their result is intended for turbines or porous obstructions that provide a uniform force in non-uniform flow (which would be possible for a particular variation of flow resistance across the actuator).
Returning to (2.9), it can be seen that for more complicated scenarios in which the local strip resistance is allowed to vary, the optimum distribution of local resistance is more difficult to determine in non-uniform flow. This is because although the momentum balance within each control volume is assumed to be independent, power can only be extracted across the finite area of the strip. This interdependence is captured in (2.9a
) in terms of the upper limit to the integration
 ${\it\psi}_{1}$
; i.e.
${\it\psi}_{1}$
; i.e.
 $k({\it\psi})$
should be chosen not only to maximise the integrand in the equation for power, but also to ensure a significant collective flow rate through the strip
$k({\it\psi})$
should be chosen not only to maximise the integrand in the equation for power, but also to ensure a significant collective flow rate through the strip
 ${\it\psi}_{1}$
. We do not attempt to solve (2.9) in this paper for a non-uniform resistance. However we do remark that the optimum resistance will be non-uniform in a non-uniform flow. We also remark that the assumption of lateral independence may become less plausible in some scenarios if the resistance is being altered to significantly manipulate the flow through the strip (rather than allowing free expansion).
${\it\psi}_{1}$
. We do not attempt to solve (2.9) in this paper for a non-uniform resistance. However we do remark that the optimum resistance will be non-uniform in a non-uniform flow. We also remark that the assumption of lateral independence may become less plausible in some scenarios if the resistance is being altered to significantly manipulate the flow through the strip (rather than allowing free expansion).
Before concluding this section we note that, up until now, our analysis has been restricted to a two-dimensional problem in symmetric shear flow. However, provided
 $\overline{U_{\ast }^{3}}$
is calculated by averaging over the area of flow passing through the actuator, (2.11) is valid for asymmetric and three-dimensional flow. This is because (2.11) is simply an integral across independent fluid elements passing through the strip/disc, and these elements may be defined regardless of flow symmetry or strip/disc geometry. The only complication in practice is that the application of (2.11) requires knowledge of the upstream location of the flow passing through the strip/disc. In general this location may not be concentric to the strip/disc in asymmetric flow, and so the upstream location is difficult to define without mapping the outermost streamlines based on a complete solution for the upstream velocity field. We return to this difficulty in §§ 4.2 and 5.
$\overline{U_{\ast }^{3}}$
is calculated by averaging over the area of flow passing through the actuator, (2.11) is valid for asymmetric and three-dimensional flow. This is because (2.11) is simply an integral across independent fluid elements passing through the strip/disc, and these elements may be defined regardless of flow symmetry or strip/disc geometry. The only complication in practice is that the application of (2.11) requires knowledge of the upstream location of the flow passing through the strip/disc. In general this location may not be concentric to the strip/disc in asymmetric flow, and so the upstream location is difficult to define without mapping the outermost streamlines based on a complete solution for the upstream velocity field. We return to this difficulty in §§ 4.2 and 5.
3 Laterally bounded shear flow
We now extend the analysis to consider the more general problem of an actuator strip in laterally bounded flow. To do this we adopt the same assumptions as in § 2, except that we confine the flow between two parallel walls separated by a distance
 $l/B$
; where
$l/B$
; where
 $B$
defines the geometric blockage ratio (figure 1). In addition to the velocity coefficients
$B$
defines the geometric blockage ratio (figure 1). In addition to the velocity coefficients
 ${\it\alpha}_{2}({\it\psi})$
and
${\it\alpha}_{2}({\it\psi})$
and
 ${\it\alpha}_{4}({\it\psi})$
we also introduce a third velocity coefficient
${\it\alpha}_{4}({\it\psi})$
we also introduce a third velocity coefficient
 ${\it\beta}_{4}({\it\psi})\geqslant 1$
to define the streamwise velocity of the fluid bypassing the strip. Finally, as in earlier actuator disc models, we will choose to neglect frictional forces acting on the parallel walls. In practice these forces would, of course, be responsible for establishing the shear in the flow. However the assumption inherent in our analysis is that inertia forces dominate these frictional forces over the length scale of streamwise flow diversion around the strip (i.e. over the distance
${\it\beta}_{4}({\it\psi})\geqslant 1$
to define the streamwise velocity of the fluid bypassing the strip. Finally, as in earlier actuator disc models, we will choose to neglect frictional forces acting on the parallel walls. In practice these forces would, of course, be responsible for establishing the shear in the flow. However the assumption inherent in our analysis is that inertia forces dominate these frictional forces over the length scale of streamwise flow diversion around the strip (i.e. over the distance
 $L=x_{4}-x_{1}$
).
$L=x_{4}-x_{1}$
).
With this problem definition it is again possible to establish a relationship between the local velocity coefficients and, in turn, the power removed by the strip. However, to make the analysis simpler, in the following sections we will restrict our attention to a scenario in which
 ${\it\alpha}_{2}$
and
${\it\alpha}_{2}$
and
 ${\it\alpha}_{4}$
are uniform across the strip and the wake respectively; i.e. we will assume the velocity profile passing through the strip is self-similar upstream, downstream and at the strip. As outlined in § 2 for unbounded flow, if we assume spanwise independence then setting both of these coefficients to be uniform implies a strip having a uniform local resistance. Similarly, for laterally bounded flow (i.e.
${\it\alpha}_{4}$
are uniform across the strip and the wake respectively; i.e. we will assume the velocity profile passing through the strip is self-similar upstream, downstream and at the strip. As outlined in § 2 for unbounded flow, if we assume spanwise independence then setting both of these coefficients to be uniform implies a strip having a uniform local resistance. Similarly, for laterally bounded flow (i.e.
 $B>0$
) we will see later in this section that although uniform
$B>0$
) we will see later in this section that although uniform
 ${\it\alpha}_{2}$
and
${\it\alpha}_{2}$
and
 ${\it\alpha}_{4}$
does not strictly imply that the local strip resistance is uniform, in most realistic scenarios it will be very close to uniform. This means that, as intended, the solutions to be derived below are appropriate for estimating the performance of an ideal turbine with uniform resistance.
${\it\alpha}_{4}$
does not strictly imply that the local strip resistance is uniform, in most realistic scenarios it will be very close to uniform. This means that, as intended, the solutions to be derived below are appropriate for estimating the performance of an ideal turbine with uniform resistance.
Having made this simplifying assumption we can begin the analysis by determining the geometry of the streamlines that enclose the flow passing through the strip. From continuity, the lateral distance between these streamlines upstream and downstream of the strip are
 $$\begin{eqnarray}l_{1}=\int _{-{\it\psi}_{1}/2}^{{\it\psi}_{1}/2}\frac{\text{d}{\it\psi}}{u_{1}({\it\psi})},\quad \text{and}\quad l_{4}=\frac{1}{{\it\alpha}_{4}}\int _{-{\it\psi}_{1}/2}^{{\it\psi}_{1}/2}\frac{\text{d}{\it\psi}}{u_{1}({\it\psi})}.\end{eqnarray}$$
At the strip we can also write
 $$\begin{eqnarray}l=\int _{-l/2}^{l/2}\,\text{d}z=\int _{-{\it\psi}_{1}/2}^{{\it\psi}_{1}/2}\frac{\text{d}{\it\psi}}{u_{2}({\it\psi})}=\frac{1}{{\it\alpha}_{2}}\int _{-{\it\psi}_{1}/2}^{{\it\psi}_{1}/2}\frac{\text{d}{\it\psi}}{u_{1}({\it\psi})},\end{eqnarray}$$
where, again,
 ${\it\psi}_{1}$
is the volume flux passing through the strip.
${\it\psi}_{1}$
is the volume flux passing through the strip.
With these results we can now integrate over the downstream cross-sectional area of the flow bypassing the strip to arrive at an expression to relate all of the velocity coefficients
 $$\begin{eqnarray}\frac{l}{B}-\frac{{\it\alpha}_{2}}{{\it\alpha}_{4}}l=\int _{-{\it\psi}_{2}/2}^{-{\it\psi}_{1}/2}\frac{\text{d}{\it\psi}}{{\it\beta}_{4}({\it\psi})u_{1}({\it\psi})}+\int _{{\it\psi}_{1}/2}^{{\it\psi}_{2}/2}\frac{\text{d}{\it\psi}}{{\it\beta}_{4}({\it\psi})u_{1}({\it\psi})},\end{eqnarray}$$
where
 ${\it\psi}_{2}$
is the volume flux for the entire confined flow; i.e.
${\it\psi}_{2}$
is the volume flux for the entire confined flow; i.e.
 $$\begin{eqnarray}{\it\psi}_{2}=\int _{-l/2B}^{l/2B}u_{1}(z)\,\text{d}z.\end{eqnarray}$$
To continue the analysis we now apply the Bernoulli equation separately upstream and downstream of the strip, which leads to the following expression for the pressure difference across the strip
 $$\begin{eqnarray}{\rm\Delta}p({\it\psi})=p(x_{2},{\it\psi})-p(x_{3},{\it\psi})={\rm\Delta}p^{\prime }+{\textstyle \frac{1}{2}}{\it\rho}[u_{1}({\it\psi})]^{2}\times (1-{\it\alpha}_{4}^{2}).\end{eqnarray}$$
This expression is the same as (2.2) for the unbounded case, except that it is augmented by the background pressure difference
 ${\rm\Delta}p^{\prime }$
. This background pressure difference is assumed to be uniform laterally across the flow and may be obtained by writing the Bernoulli equation along any streamline in the bypass flow, which leads to
${\rm\Delta}p^{\prime }$
. This background pressure difference is assumed to be uniform laterally across the flow and may be obtained by writing the Bernoulli equation along any streamline in the bypass flow, which leads to
 $$\begin{eqnarray}{\rm\Delta}p^{\prime }={\textstyle \frac{1}{2}}{\it\rho}[u_{1}({\it\psi})]^{2}([{\it\beta}_{4}({\it\psi})]^{2}-1),\quad \text{for }{\it\psi}_{2}\geqslant |2{\it\psi}|\geqslant {\it\psi}_{1}.\end{eqnarray}$$
Finally, to complete the analysis we can enforce conservation of streamwise momentum across the entire flow field, which leads to
 $$\begin{eqnarray}{\rm\Delta}p^{\prime }\frac{l}{B}-T={\it\rho}\int _{-l/2B}^{l/2B}[u_{4}(z)]^{2}\,\text{d}z-{\it\rho}\int _{-l/2B}^{l/2B}[u_{1}(z)]^{2}\,\text{d}z,\end{eqnarray}$$
where the force supplied by the strip is
 $$\begin{eqnarray}T=\int _{-l/2}^{l/2}{\rm\Delta}p(z)\,\text{d}z.\end{eqnarray}$$
Substituting (3.5) and (3.8) into (3.7), and separating the integrals on the right-hand side of (3.7), the momentum equation can be rewritten as
 $$\begin{eqnarray}\displaystyle & & \displaystyle {\rm\Delta}p^{\prime }\frac{l}{B}-{\rm\Delta}p^{\prime }l-\frac{{\it\rho}(1-{\it\alpha}_{4}^{2})}{2{\it\alpha}_{2}}\int _{-{\it\psi}_{1}/2}^{{\it\psi}_{1}/2}u_{1}({\it\psi})\,\text{d}{\it\psi}={\it\rho}({\it\alpha}_{4}-1)\int _{-{\it\psi}_{1}/2}^{{\it\psi}_{1}/2}u_{1}({\it\psi})\,\text{d}{\it\psi}\nonumber\\ \displaystyle & & \displaystyle \quad +\,{\it\rho}\int _{-{\it\psi}_{2}/2}^{-{\it\psi}_{1}/2}({\it\beta}_{4}({\it\psi})-1)u_{1}({\it\psi})\,\text{d}{\it\psi}+{\it\rho}\int _{{\it\psi}_{1}/2}^{{\it\psi}_{2}/2}({\it\beta}_{4}({\it\psi})-1)u_{1}({\it\psi})\,\text{d}{\it\psi}.\end{eqnarray}$$
If we now presume that the velocity coefficient
 ${\it\alpha}_{2}$
is known, together with the geometric blockage
${\it\alpha}_{2}$
is known, together with the geometric blockage
 $B$
and the upstream velocity profile
$B$
and the upstream velocity profile
 $u_{1}({\it\psi})$
, (3.3) and (3.9) define a set of two equations which may be solved together to determine the unknown coefficient
$u_{1}({\it\psi})$
, (3.3) and (3.9) define a set of two equations which may be solved together to determine the unknown coefficient
 ${\it\alpha}_{4}$
and the unknown function
${\it\alpha}_{4}$
and the unknown function
 ${\it\beta}_{4}({\it\psi})$
. To obtain this solution it is convenient to first reduce the function
${\it\beta}_{4}({\it\psi})$
. To obtain this solution it is convenient to first reduce the function
 ${\it\beta}_{4}({\it\psi})$
to a single parameter. This is possible due to the fact that the background pressure difference has been assumed to be the same along all streamlines in the bypass flow. Hence, from (3.6)
${\it\beta}_{4}({\it\psi})$
to a single parameter. This is possible due to the fact that the background pressure difference has been assumed to be the same along all streamlines in the bypass flow. Hence, from (3.6)
 $$\begin{eqnarray}{\it\beta}_{4}({\it\psi})=\left[1+\frac{u_{1}^{\prime 2}}{[u_{1}({\it\psi})]^{2}}({\it\beta}_{4}^{\prime 2}-1)\right]^{1/2},\quad \text{for }{\it\psi}_{2}\geqslant |2{\it\psi}|\geqslant {\it\psi}_{1},\end{eqnarray}$$
where
 ${\it\beta}_{4}^{\prime }={\it\beta}_{4}({\it\psi}_{b})$
and
${\it\beta}_{4}^{\prime }={\it\beta}_{4}({\it\psi}_{b})$
and
 $u_{1}^{\prime }=u_{1}({\it\psi}_{b})$
have been introduced to represent the bypass velocity coefficient and upstream velocity, respectively, along an arbitrary streamline
$u_{1}^{\prime }=u_{1}({\it\psi}_{b})$
have been introduced to represent the bypass velocity coefficient and upstream velocity, respectively, along an arbitrary streamline
 ${\it\psi}={\it\psi}_{b}$
in the bypass flow. Since
${\it\psi}={\it\psi}_{b}$
in the bypass flow. Since
 ${\it\psi}_{b}$
can be prescribed, it follows that
${\it\psi}_{b}$
can be prescribed, it follows that
 $u_{1}^{\prime }$
is a known parameter. Hence the function
$u_{1}^{\prime }$
is a known parameter. Hence the function
 ${\it\beta}_{4}({\it\psi})$
is defined, via (3.10), in terms of only the single unknown parameter
${\it\beta}_{4}({\it\psi})$
is defined, via (3.10), in terms of only the single unknown parameter
 ${\it\beta}_{4}^{\prime }$
.
${\it\beta}_{4}^{\prime }$
.
Rewriting (3.3) and (3.9), using (3.10), now leads to the following two equations
 $$\begin{eqnarray}{\it\alpha}_{4}=\frac{{\it\alpha}_{2}{\it\beta}_{4}^{\prime }B}{{\it\alpha}_{2}BI_{0}+{\it\beta}_{4}^{\prime }-I_{0}}\end{eqnarray}$$
and
 $$\begin{eqnarray}\displaystyle & & \displaystyle (1-B){\it\beta}_{4}^{\prime 2}-2\left(I_{2}-{\it\alpha}_{4}\left[\frac{I_{1}({\it\alpha}_{4}-1)-I_{2}({\it\beta}_{4}^{\prime }-1)}{I_{0}{\it\alpha}_{4}-{\it\beta}_{4}^{\prime }}\right]\right){\it\beta}_{4}^{\prime }\nonumber\\ \displaystyle & & \displaystyle \quad +\left(1+2(I_{2}-1)+B(1-I_{1})-2{\it\alpha}_{4}\left[\frac{I_{1}({\it\alpha}_{4}-1)-I_{2}({\it\beta}_{4}^{\prime }-1)}{{\it\alpha}_{4}-{\it\beta}_{4}^{\prime }/I_{0}}\right]+B{\it\alpha}_{4}^{2}I_{1}\right)=0,\nonumber\\ \displaystyle & & \displaystyle\end{eqnarray}$$
in which
 $I_{0}$
,
$I_{0}$
,
 $I_{1}$
and
$I_{1}$
and
 $I_{2}$
are given by
$I_{2}$
are given by
 $$\begin{eqnarray}\displaystyle I_{0} & = & \displaystyle \frac{B{\it\beta}_{4}^{\prime }}{(1-B{\it\alpha}_{2})l}\int _{-{\it\psi}_{2}/2}^{-{\it\psi}_{1}/2}([u_{1}({\it\psi})]^{2}+u_{1}^{\prime 2}({\it\beta}_{4}^{\prime 2}-1))^{-1/2}\,\text{d}{\it\psi}\nonumber\\ \displaystyle & & \displaystyle +\,\frac{B{\it\beta}_{4}^{\prime }}{(1-B{\it\alpha}_{2})l}\int _{{\it\psi}_{1}/2}^{{\it\psi}_{2}/2}([u_{1}({\it\psi})]^{2}+u_{1}^{\prime 2}({\it\beta}_{4}^{\prime 2}-1))^{-1/2}\,\text{d}{\it\psi},\end{eqnarray}$$
 $$\begin{eqnarray}I_{1}=\frac{1}{u_{1}^{\prime 2}{\it\alpha}_{2}l}\int _{-{\it\psi}_{1}/2}^{{\it\psi}_{1}/2}u_{1}({\it\psi})\,\text{d}{\it\psi},\end{eqnarray}$$
and
 $$\begin{eqnarray}\displaystyle I_{2} & = & \displaystyle \frac{B}{(1-B{\it\alpha}_{2})lu_{1}^{\prime 2}}\int _{-{\it\psi}_{2}/2}^{-{\it\psi}_{1}/2}\frac{u_{1}({\it\psi})}{({\it\beta}_{4}^{\prime }-1)}\left[\left(1+\frac{u_{1}^{\prime 2}}{[u_{1}({\it\psi})]^{2}}({\it\beta}_{4}^{\prime 2}-1)\right)^{1/2}-1\right]\,\text{d}{\it\psi}\nonumber\\ \displaystyle & & \displaystyle +\,\frac{B}{(1-B{\it\alpha}_{2})lu_{1}^{\prime 2}}\int _{{\it\psi}_{1}/2}^{{\it\psi}_{2}/2}\frac{u_{1}({\it\psi})}{({\it\beta}_{4}^{\prime }-1)}\left[\left(1+\frac{u_{1}^{\prime 2}}{[u_{1}({\it\psi})]^{2}}({\it\beta}_{4}^{\prime 2}-1)\right)^{1/2}-1\right]\,\text{d}{\it\psi}.\qquad\end{eqnarray}$$
It is easy to demonstrate that each of the functions
 $I_{0}$
,
$I_{0}$
,
 $I_{1}$
and
$I_{1}$
and
 $I_{2}$
limit to unity when the upstream flow is uniform; i.e. when
$I_{2}$
limit to unity when the upstream flow is uniform; i.e. when
 $u_{1}({\it\psi})\rightarrow U$
and
$u_{1}({\it\psi})\rightarrow U$
and
 $u_{1}^{\prime }\rightarrow U$
for any choice of
$u_{1}^{\prime }\rightarrow U$
for any choice of
 ${\it\psi}_{b}$
. In that case, the bypass flow is uniform and (3.12) becomes a simple quadratic function in
${\it\psi}_{b}$
. In that case, the bypass flow is uniform and (3.12) becomes a simple quadratic function in
 ${\it\beta}_{4}^{\prime }$
that is identical (accounting for differences in notation) to the solution given by Garrett & Cummins (Reference Garrett and Cummins2007) for a disc in uniform flow (see also (2.6) given in Draper & Nishino (Reference Draper and Nishino2014)). Alternatively, for the more general scenario involving a non-uniform velocity profile,
${\it\beta}_{4}^{\prime }$
that is identical (accounting for differences in notation) to the solution given by Garrett & Cummins (Reference Garrett and Cummins2007) for a disc in uniform flow (see also (2.6) given in Draper & Nishino (Reference Draper and Nishino2014)). Alternatively, for the more general scenario involving a non-uniform velocity profile,
 $I_{0}$
and
$I_{0}$
and
 $I_{2}$
become functions of the parameter
$I_{2}$
become functions of the parameter
 ${\it\beta}_{4}^{\prime }$
, whilst
${\it\beta}_{4}^{\prime }$
, whilst
 $I_{1}$
may be evaluated directly. It is therefore possible to use numerical methods to solve both (3.11) and (3.12) to obtain
$I_{1}$
may be evaluated directly. It is therefore possible to use numerical methods to solve both (3.11) and (3.12) to obtain
 ${\it\beta}_{4}^{\prime }$
and
${\it\beta}_{4}^{\prime }$
and
 ${\it\alpha}_{4}$
. In this paper we have found this numerical solution for a given velocity profile, geometric blockage ratio and velocity coefficient
${\it\alpha}_{4}$
. In this paper we have found this numerical solution for a given velocity profile, geometric blockage ratio and velocity coefficient
 ${\it\alpha}_{2}$
by selecting a range of values for
${\it\alpha}_{2}$
by selecting a range of values for
 ${\it\beta}_{4}^{\prime }$
and computing the corresponding range in values of
${\it\beta}_{4}^{\prime }$
and computing the corresponding range in values of
 ${\it\alpha}_{4}$
via (3.11). For this range of values the functions
${\it\alpha}_{4}$
via (3.11). For this range of values the functions
 $I_{0}$
,
$I_{0}$
,
 $I_{1}$
and
$I_{1}$
and
 $I_{2}$
and, in turn, the left-hand side of (3.12) are then evaluated and the relevant root on the interval
$I_{2}$
and, in turn, the left-hand side of (3.12) are then evaluated and the relevant root on the interval
 $[1,\infty )$
is located. A bisection method is used to ensure this root is evaluated to within
$[1,\infty )$
is located. A bisection method is used to ensure this root is evaluated to within
 ${\sim}10^{-6}$
.
${\sim}10^{-6}$
.
Following solution of the velocity coefficients, the power extracted by the strip can be evaluated as
 $$\begin{eqnarray}P=\int _{-l/2}^{l/2}{\rm\Delta}p(z)u_{2}(z)\,\text{d}z=\int _{-{\it\psi}_{1}/2}^{{\it\psi}_{1}/2}{\rm\Delta}p({\it\psi})\,\text{d}{\it\psi},\end{eqnarray}$$
which can be expanded to give
 $$\begin{eqnarray}P=\frac{1}{2}{\it\rho}(1-{\it\alpha}_{4}^{2})\int _{-{\it\psi}_{1}/2}^{{\it\psi}_{1}/2}[u_{1}({\it\psi})]^{2}\,\text{d}{\it\psi}+\frac{1}{2}{\it\rho}u_{1}^{\prime 2}({\it\beta}_{4}^{\prime 2}-1)\int _{-{\it\psi}_{1}/2}^{{\it\psi}_{1}/2}\,\text{d}{\it\psi}.\end{eqnarray}$$
This may also be expressed in terms of a power coefficient such that
 $$\begin{eqnarray}C_{P}=\frac{P}{1/2{\it\rho}l\overline{U_{\ast }^{3}}}=\frac{(1-{\it\alpha}_{4}^{2})}{l\overline{U_{\ast }^{3}}}\int _{-{\it\psi}_{1}/2}^{{\it\psi}_{1}/2}[u_{1}({\it\psi})]^{2}\,\text{d}{\it\psi}+\frac{({\it\beta}_{4}^{\prime 2}-1)u_{1}^{\prime 2}}{l\overline{U_{\ast }^{3}}}\int _{-{\it\psi}_{1}/2}^{{\it\psi}_{1}/2}\,\text{d}{\it\psi},\end{eqnarray}$$
where
 $\overline{U_{\ast }^{3}}$
is defined in (2.11).
$\overline{U_{\ast }^{3}}$
is defined in (2.11).
In § 4 we present example solutions using (3.18) for the power removed by a strip for a variety of different velocity profiles. However, before exploring these solutions, we return briefly to the simplification introduced at the start of this section; namely that both
 ${\it\alpha}_{2}$
and
${\it\alpha}_{2}$
and
 ${\it\alpha}_{4}$
were assumed to be constant across the area of the strip. As a result of this constraint we can now see from (3.6) and (3.10) that (3.5) can be rewritten as:
${\it\alpha}_{4}$
were assumed to be constant across the area of the strip. As a result of this constraint we can now see from (3.6) and (3.10) that (3.5) can be rewritten as:
 $$\begin{eqnarray}{\rm\Delta}p({\it\psi})=\frac{1}{2}{\it\rho}[u_{1}({\it\psi})]^{2}\left(1-{\it\alpha}_{4}^{2}+\frac{u_{1}^{\prime 2}}{[u_{1}({\it\psi})]^{2}}({\it\beta}_{4}^{\prime 2}-1)\right),\quad \text{for }|2{\it\psi}|\leqslant {\it\psi}_{1}.\end{eqnarray}$$
Comparing this with (2.8), which defines the pressure difference in terms of the strip resistance, implies that the strip resistance required to ensure a self-similar velocity profile is:
 $$\begin{eqnarray}k({\it\psi})=\frac{1}{{\it\alpha}_{2}^{2}}\left(1-{\it\alpha}_{4}^{2}+\frac{u_{1}^{\prime 2}}{[u_{1}({\it\psi})]^{2}}({\it\beta}_{4}^{\prime 2}-1)\right),\quad \text{for }|2{\it\psi}|\leqslant {\it\psi}_{1}.\end{eqnarray}$$
This resistance is not constant across the strip, but varies by an amount that is dependent on (i) the shear in the upstream profile intercepting the actuator (defined by
 $1/[u_{1}({\it\psi})]^{2}$
) and (ii) the multiplier
$1/[u_{1}({\it\psi})]^{2}$
) and (ii) the multiplier
 $u_{1}^{\prime 2}({\it\beta}_{4}^{\prime 2}-1)$
which, from (3.6), is proportional to the pressure difference across the flow and is significant only for highly blocked flow conditions. The main point to note, therefore, is that when
$u_{1}^{\prime 2}({\it\beta}_{4}^{\prime 2}-1)$
which, from (3.6), is proportional to the pressure difference across the flow and is significant only for highly blocked flow conditions. The main point to note, therefore, is that when
 ${\it\alpha}_{2}$
and
${\it\alpha}_{2}$
and
 ${\it\alpha}_{4}$
are uniform, the resistance will be close to uniform when there is minimal shear in the flow intercepting the strip and/or when the geometric blockage is not excessive. In § 5 we present example solutions to demonstrate this.
${\it\alpha}_{4}$
are uniform, the resistance will be close to uniform when there is minimal shear in the flow intercepting the strip and/or when the geometric blockage is not excessive. In § 5 we present example solutions to demonstrate this.
4 Solutions for some specific velocity profiles
4.1 Symmetric shear flow
To explore the model presented in § 3, we start by computing the power coefficient for a strip centred at
 $z=0$
and subjected to a symmetric velocity profile of the form
$z=0$
and subjected to a symmetric velocity profile of the form
 $$\begin{eqnarray}u_{1}(z)=U\left(1-2\frac{|z|B}{l}\right)^{n},\end{eqnarray}$$
where
 $n$
is a shape parameter. Exploiting symmetry, it is sufficient to consider this velocity profile in just the lower half of the flow field (i.e. for
$n$
is a shape parameter. Exploiting symmetry, it is sufficient to consider this velocity profile in just the lower half of the flow field (i.e. for
 $z<0$
). In this half of the flow field (4.1) can be transformed into the
$z<0$
). In this half of the flow field (4.1) can be transformed into the
 $x{-}{\it\psi}$
plane by noting that
$x{-}{\it\psi}$
plane by noting that
 $$\begin{eqnarray}{\it\psi}(z)+\frac{{\it\psi}_{2}}{2}=\int _{-l/2B}^{z}u_{1}(z)\,\text{d}z=\frac{Ul}{2B(n+1)}\left(1-2\frac{zB}{l}\right)^{n+1},\quad \text{for }-\frac{l}{2B}\leqslant z\leqslant 0,\end{eqnarray}$$
where
 ${\it\psi}_{2}=Ul/B(n+1)$
is the total volume flux passing between the lateral boundaries. Using (4.2), (4.1) therefore becomes
${\it\psi}_{2}=Ul/B(n+1)$
is the total volume flux passing between the lateral boundaries. Using (4.2), (4.1) therefore becomes
 $$\begin{eqnarray}u_{1}({\it\psi})=\left(\frac{2B(n+1)}{l}U^{1/n}\right)^{n/(n+1)}\left(\frac{{\it\psi}_{2}}{2}+{\it\psi}\right)^{n/(n+1)},\quad \text{for }-\frac{{\it\psi}_{2}}{2}\leqslant {\it\psi}\leqslant 0.\end{eqnarray}$$
We can now substitute this result into (3.13)–(3.15) to obtain expressions for the functions
 $I_{0}$
,
$I_{0}$
,
 $I_{1}$
and
$I_{1}$
and
 $I_{2}$
in (3.11) and (3.12). Starting with
$I_{2}$
in (3.11) and (3.12). Starting with
 $I_{0}$
we can write
$I_{0}$
we can write
 $$\begin{eqnarray}I_{0}=\frac{2B{\it\beta}_{4}^{\prime }}{(1-B{\it\alpha}_{2})l}\int _{-{\it\psi}_{2}/2}^{-{\it\psi}_{1}/2}([u_{1}({\it\psi})]^{2}+u_{1}^{\prime 2}({\it\beta}_{4}^{\prime 2}-1))^{-1/2}\,\text{d}{\it\psi},\end{eqnarray}$$
where the factor of 2 has been introduced due to symmetry and
 ${\it\psi}_{1}$
is the volume flux passing through the strip. This flux can be evaluated by noting that the streamline with
${\it\psi}_{1}$
is the volume flux passing through the strip. This flux can be evaluated by noting that the streamline with
 ${\it\psi}=-{\it\psi}_{1}/2$
passes through the upstream location
${\it\psi}=-{\it\psi}_{1}/2$
passes through the upstream location
 $z=-{\it\alpha}_{2}l/2$
. Consequently, from (4.2) we can write
$z=-{\it\alpha}_{2}l/2$
. Consequently, from (4.2) we can write
 $$\begin{eqnarray}\frac{{\it\psi}_{1}}{2}=\frac{{\it\psi}_{2}}{2}-\frac{Ul}{2B(n+1)}(1-{\it\alpha}_{2}B)^{n+1}.\end{eqnarray}$$
To define
 $u_{1}^{\prime }$
in (4.4) we are free to choose
$u_{1}^{\prime }$
in (4.4) we are free to choose
 ${\it\psi}_{b}$
at any point in the bypass flow. For example, if we take
${\it\psi}_{b}$
at any point in the bypass flow. For example, if we take
 ${\it\psi}_{b}=-{\it\psi}_{1}/2$
(i.e. the edge of the bypass flow) then from (4.3) and (4.5) it follows that
${\it\psi}_{b}=-{\it\psi}_{1}/2$
(i.e. the edge of the bypass flow) then from (4.3) and (4.5) it follows that
 $u_{1}^{\prime }=u_{1}(-{\it\psi}_{1}/2)=U(1-{\it\alpha}_{2}B)^{n}$
. Substituting this result and (4.3) into (4.4) now gives
$u_{1}^{\prime }=u_{1}(-{\it\psi}_{1}/2)=U(1-{\it\alpha}_{2}B)^{n}$
. Substituting this result and (4.3) into (4.4) now gives
 $$\begin{eqnarray}I_{0}=\frac{{\it\beta}_{4}^{\prime }}{(1-B{\it\alpha}_{2})^{n+1}}\left(\frac{2B}{Ul}\right)\int _{-{\it\psi}_{2}/2}^{-{\it\psi}_{1}/2}\left[\left(\frac{{\it\psi}_{2}+2{\it\psi}}{{\it\psi}_{2}-{\it\psi}_{1}}\right)^{2n/(n+1)}+({\it\beta}_{4}^{\prime 2}-1)\right]^{-1/2}\,\text{d}{\it\psi}.\end{eqnarray}$$
Finally, if we introduce a non-dimensional stream function
 $\tilde{{\it\psi}}={\it\psi}(B/Ul)$
, we can write
$\tilde{{\it\psi}}={\it\psi}(B/Ul)$
, we can write
 $$\begin{eqnarray}I_{0}=\frac{2{\it\beta}_{4}^{\prime }}{(1-B{\it\alpha}_{2})^{n+1}}\int _{-\tilde{{\it\psi}}_{2}/2}^{-\tilde{{\it\psi}}_{1}/2}\left[\left(\frac{\tilde{{\it\psi}}_{2}+2\tilde{{\it\psi}}}{{\tilde{{\it\psi}}_{2}-\tilde{{\it\psi}}}_{1}}\right)^{2n/(n+1)}+\left({\it\beta}_{4}^{\prime 2}-1\right)\right]^{-1/2}\,\text{d}\tilde{{\it\psi}}.\end{eqnarray}$$
The integral in this expression does not have an analytical solution for all values of
 $n$
, however it can be evaluated easily numerically for a chosen value of
$n$
, however it can be evaluated easily numerically for a chosen value of
 ${\it\beta}_{4}^{\prime }$
.
${\it\beta}_{4}^{\prime }$
.
Next we can evaluate the two functions
 $I_{1}$
and
$I_{1}$
and
 $I_{2}$
. Firstly, substituting (4.3) into (3.14) and exploiting symmetry leads to
$I_{2}$
. Firstly, substituting (4.3) into (3.14) and exploiting symmetry leads to
 $$\begin{eqnarray}I_{1}=\frac{2}{u_{1}^{\prime 2}{\it\alpha}_{2}l}\int _{-{\it\psi}_{1}/2}^{0}u_{1}({\it\psi})\,\text{d}{\it\psi}=\frac{1-{\it\alpha}_{2}B}{(2n+1){\it\alpha}_{2}B}\left[\left(\frac{\tilde{{\it\psi}}_{2}}{{\tilde{{\it\psi}}_{2}-\tilde{{\it\psi}}}_{1}}\right)^{(2n+1)/(n+1)}-1\right].\end{eqnarray}$$
Secondly, substituting (4.3) into (3.15) leads, after some manipulation, to
 $$\begin{eqnarray}\displaystyle I_{2} & = & \displaystyle \frac{1}{(1-{\it\alpha}_{2}B)^{n+1}}\frac{2}{{\it\beta}_{4}^{\prime }-1}\nonumber\\ \displaystyle & & \displaystyle \times \,\int _{-\tilde{{\it\psi}}_{2}/2}^{-\tilde{{\it\psi}}_{1}/2}\left[\left(\left(\frac{\tilde{{\it\psi}}_{2}+2\tilde{{\it\psi}}}{{\tilde{{\it\psi}}_{2}-\tilde{{\it\psi}}}_{1}}\right)^{2n/(n+1)}+({\it\beta}_{4}^{\prime 2}-1)\right)^{1/2}-\left(\frac{\tilde{{\it\psi}}_{2}+2\tilde{{\it\psi}}}{{\tilde{{\it\psi}}_{2}-\tilde{{\it\psi}}}_{1}}\right)^{n/(n+1)}\right]\,\text{d}\tilde{{\it\psi}}.\nonumber\\ \displaystyle & & \displaystyle\end{eqnarray}$$
Similarly to (4.7), this last function must be evaluated numerically.
For a particular geometric blockage
 $B$
, velocity coefficient
$B$
, velocity coefficient
 ${\it\alpha}_{2}$
and shape parameter
${\it\alpha}_{2}$
and shape parameter
 $n$
, it is now straightforward to calculate the unknown coefficients
$n$
, it is now straightforward to calculate the unknown coefficients
 ${\it\beta}_{4}^{\prime }$
and
${\it\beta}_{4}^{\prime }$
and
 ${\it\alpha}_{4}$
via (3.11) and (3.12). To do this we adopt the numerical approach outlined in § 3; i.e. we compute
${\it\alpha}_{4}$
via (3.11) and (3.12). To do this we adopt the numerical approach outlined in § 3; i.e. we compute
 $I_{0}$
,
$I_{0}$
,
 $I_{1}$
and
$I_{1}$
and
 $I_{2}$
via (4.7)–(4.9) for trial values of
$I_{2}$
via (4.7)–(4.9) for trial values of
 ${\it\beta}_{4}^{\prime }$
and
${\it\beta}_{4}^{\prime }$
and
 ${\it\alpha}_{4}$
. We then use these values to evaluate the left-hand side of (3.12), and repeat the process until obtaining the root.
${\it\alpha}_{4}$
. We then use these values to evaluate the left-hand side of (3.12), and repeat the process until obtaining the root.
Having obtained these unknown coefficients we then evaluate the power coefficient. To do this we first note that
 $$\begin{eqnarray}\overline{U_{\ast }^{3}}=\frac{2}{{\it\alpha}_{2}l}\int _{-{\it\psi}_{1}/2}^{0}[u_{1}({\it\psi})]^{2}\,\text{d}{\it\psi}=\frac{U^{3}}{{\it\alpha}_{2}B}\frac{(1-(1-{\it\alpha}_{2}B)^{3n+1})}{(3n+1)},\end{eqnarray}$$
so that (3.18) can be simplified to
 $$\begin{eqnarray}C_{P}={\it\alpha}_{2}(1-{\it\alpha}_{4}^{2})+{\it\alpha}_{2}({\it\beta}_{4}^{\prime 2}-1)\frac{(3n+1)}{(n+1)}\frac{(1-{\it\alpha}_{2}B)^{2n}(1-(1-{\it\alpha}_{2}B)^{n+1})}{1-(1-{\it\alpha}_{2}B)^{3n+1}}.\end{eqnarray}$$
Figure 2 presents solutions to (4.11) for two different geometric blockage ratios (
 $B=1/2$
and
$B=1/2$
and
 $1/6$
) and for a variety of shape parameters. In this figure the results for
$1/6$
) and for a variety of shape parameters. In this figure the results for
 $n=0$
correspond to the solution of Garrett & Cummins (Reference Garrett and Cummins2007) for uniform flow. In comparison to these results, it can be seen that the shape of the upstream velocity profile has a significant effect on the power extracted by the strip, with the power coefficient reducing as the flow becomes increasingly sheared (i.e. as
$n=0$
correspond to the solution of Garrett & Cummins (Reference Garrett and Cummins2007) for uniform flow. In comparison to these results, it can be seen that the shape of the upstream velocity profile has a significant effect on the power extracted by the strip, with the power coefficient reducing as the flow becomes increasingly sheared (i.e. as
 $n$
increases). For example, for a linear shear profile (
$n$
increases). For example, for a linear shear profile (
 $n=1$
), the peak power coefficient is reduced by 61 % and 28 %, respectively, compared to the uniform flow solution for
$n=1$
), the peak power coefficient is reduced by 61 % and 28 %, respectively, compared to the uniform flow solution for
 $B=1/2$
and
$B=1/2$
and
 $1/6$
.
$1/6$
.

Figure 2. Power coefficient
 $C_{P}$
for (a) geometric blockage
$C_{P}$
for (a) geometric blockage
 $B=1/6$
and (b) geometric blockage
$B=1/6$
and (b) geometric blockage
 $B=1/2$
. The parameter
$B=1/2$
. The parameter
 $n$
defines the shape of the velocity profile given in (4.1).
$n$
defines the shape of the velocity profile given in (4.1).
The reduction in power observed in figure 2 can be understood by realising that the power removed by the strip can increase when there is a large background pressure gradient
 ${\rm\Delta}p^{\prime }$
, since the product of this gradient and the flow through the channel provides an additional source of power in excess of the upstream kinetic flux (Garrett & Cummins Reference Garrett and Cummins2007). However, in a non-uniform flow, it can be seen from (3.6) that a particular background pressure gradient is achieved when the bypass velocity increases by an amount
${\rm\Delta}p^{\prime }$
, since the product of this gradient and the flow through the channel provides an additional source of power in excess of the upstream kinetic flux (Garrett & Cummins Reference Garrett and Cummins2007). However, in a non-uniform flow, it can be seen from (3.6) that a particular background pressure gradient is achieved when the bypass velocity increases by an amount
 ${\it\beta}_{4}({\it\psi})=[2{\rm\Delta}p^{\prime }/{\it\rho}[u_{1}({\it\psi})]^{2}+1]^{1/2}$
. Hence, when the upstream bypass flow velocity is relatively small, a large fractional increase in the bypass flow velocity is needed to establish a given pressure gradient. Since this increase in velocity requires (from continuity) that a large fraction of the flow must bypass the strip, it is not possible to achieve a large background pressure gradient without a large fraction of the flow bypassing the strip; and this limits the power that can be extracted. Following the same logic, we can also conclude that when the bypass flow velocity is relatively large, only a small fractional increase in velocity is needed to achieve a given background pressure gradient. Consequently a large background pressure gradient can be achieved without a large fraction of the flow bypassing the strip, resulting in increased power extraction (as will be seen in § 4.2).
${\it\beta}_{4}({\it\psi})=[2{\rm\Delta}p^{\prime }/{\it\rho}[u_{1}({\it\psi})]^{2}+1]^{1/2}$
. Hence, when the upstream bypass flow velocity is relatively small, a large fractional increase in the bypass flow velocity is needed to establish a given pressure gradient. Since this increase in velocity requires (from continuity) that a large fraction of the flow must bypass the strip, it is not possible to achieve a large background pressure gradient without a large fraction of the flow bypassing the strip; and this limits the power that can be extracted. Following the same logic, we can also conclude that when the bypass flow velocity is relatively large, only a small fractional increase in velocity is needed to achieve a given background pressure gradient. Consequently a large background pressure gradient can be achieved without a large fraction of the flow bypassing the strip, resulting in increased power extraction (as will be seen in § 4.2).
A useful way to quantify the differences in maximum power coefficient observed in figure 2 is to introduce the concept of an effective blockage ratio, which is defined here as the equivalent geometric blockage ratio that would give the same maximum power coefficient in uniform flow. For example, noting that the maximum power coefficient in uniform flow (
 $C_{P,max}^{U}$
) is given by Garrett & Cummins (Reference Garrett and Cummins2007)
$C_{P,max}^{U}$
) is given by Garrett & Cummins (Reference Garrett and Cummins2007)
 $$\begin{eqnarray}C_{P,max}^{U}=\frac{16}{27}\frac{1}{(1-B)^{2}},\end{eqnarray}$$
it follows that the maximum power coefficient calculated for a non-uniform flow (
 $C_{P,max}$
) can be converted into an effective blockage ratio according to
$C_{P,max}$
) can be converted into an effective blockage ratio according to
 $$\begin{eqnarray}B_{eff}=1-\left(\frac{16}{27C_{P,max}}\right)^{1/2}.\end{eqnarray}$$
To explore this concept, the effective blockage ratio is plotted against the geometric blockage ratio for a range of different shape parameters in figure 3. In this figure it can be seen that the effective blockage is always less than the geometric blockage, except in the limits
 $B\rightarrow 0$
and
$B\rightarrow 0$
and
 $B\rightarrow 1$
, where
$B\rightarrow 1$
, where
 $B_{eff}\rightarrow B$
. The difference between the effective and geometric blockage is most significant for
$B_{eff}\rightarrow B$
. The difference between the effective and geometric blockage is most significant for
 $n=1$
, but even for
$n=1$
, but even for
 $n=1/7$
the effective blockage is more than 10 % lower than the geometric blockage when
$n=1/7$
the effective blockage is more than 10 % lower than the geometric blockage when
 $B\sim 0.25$
to
$B\sim 0.25$
to
 $B\sim 0.7$
.
$B\sim 0.7$
.

Figure 3. Effective blockage ratio for a strip placed in the centre of a symmetric non-uniform velocity profile. The parameter
 $n$
defines the shape of the velocity profile given in (4.1).
$n$
defines the shape of the velocity profile given in (4.1).
4.2 Asymmetric shear flow
We now investigate power performance for an asymmetric velocity profile defined by
 $$\begin{eqnarray}u_{1}(z^{\prime })=U\left(\frac{z^{\prime }B}{l}\right)^{n},\end{eqnarray}$$
where
 $z^{\prime }=z+l/2B$
. Introducing a new stream function coordinate
$z^{\prime }=z+l/2B$
. Introducing a new stream function coordinate
 ${\it\psi}^{\prime }={\it\psi}+{\it\psi}_{2}/2$
, this velocity profile can be transformed into the
${\it\psi}^{\prime }={\it\psi}+{\it\psi}_{2}/2$
, this velocity profile can be transformed into the
 $x{-}{\it\psi}^{\prime }$
plane by noting that
$x{-}{\it\psi}^{\prime }$
plane by noting that
 $$\begin{eqnarray}{\it\psi}^{\prime }(z^{\prime })=\int _{0}^{z^{\prime }}u_{1}(z^{\prime })\,\text{d}z^{\prime }=\frac{Ul}{(n+1)B}\left(\frac{z^{\prime }B}{l}\right)^{(n+1)},\end{eqnarray}$$
so that combining (4.14) and (4.15) gives
 $$\begin{eqnarray}u_{1}({\it\psi}^{\prime })={\it\psi}^{\prime n/(n+1)}\left(\frac{B(n+1)}{l}U^{1/n}\right)^{n/(n+1)}.\end{eqnarray}$$
In this example we will also allow the centre of the strip to be placed at different lateral locations
 $z^{\prime }=z_{d}^{\prime }$
, where
$z^{\prime }=z_{d}^{\prime }$
, where
 $1/2<z_{d}^{\prime }/l<(1-B/2)/B$
so that the strip remains entirely within the lateral boundaries.
$1/2<z_{d}^{\prime }/l<(1-B/2)/B$
so that the strip remains entirely within the lateral boundaries.
With these input conditions the first step in obtaining a solution is to realise that (3.11) and (3.12) are still valid for an asymmetric flow, provided that the integrals in
 $I_{0}$
and
$I_{0}$
and
 $I_{2}$
are evaluated over the bypass flow and the integral in
$I_{2}$
are evaluated over the bypass flow and the integral in
 $I_{1}$
is evaluated over flow passing through the strip. However, having made this realisation, it is immediately evident that (as outlined in § 2) the evaluation of these integrals is difficult in practice because the upstream locations of the bypass and core flow are not easy to define in an asymmetric flow. To circumvent this problem we will assume in this example that, to first approximation, the streamlines are not skewed. Consequently, if we define
$I_{1}$
is evaluated over flow passing through the strip. However, having made this realisation, it is immediately evident that (as outlined in § 2) the evaluation of these integrals is difficult in practice because the upstream locations of the bypass and core flow are not easy to define in an asymmetric flow. To circumvent this problem we will assume in this example that, to first approximation, the streamlines are not skewed. Consequently, if we define
 ${\it\psi}_{1}^{\prime }$
as the volume flux passing below the strip, and
${\it\psi}_{1}^{\prime }$
as the volume flux passing below the strip, and
 ${\it\psi}_{2}^{\prime }-{\it\psi}_{1}^{\prime }$
and
${\it\psi}_{2}^{\prime }-{\it\psi}_{1}^{\prime }$
and
 ${\it\psi}_{3}^{\prime }-{\it\psi}_{2}^{\prime }$
, respectively, as the volume fluxes passing through the strip and above the strip, we can use (4.15) to write
${\it\psi}_{3}^{\prime }-{\it\psi}_{2}^{\prime }$
, respectively, as the volume fluxes passing through the strip and above the strip, we can use (4.15) to write
 $$\begin{eqnarray}\left.\begin{array}{@{}c@{}}{\it\psi}_{1}^{\prime }=\displaystyle \frac{Ul}{(n+1)B}\left(\frac{z_{d}^{\prime }B}{l}-\frac{{\it\alpha}_{2}B}{2}\right)^{n+1},\\ {\it\psi}_{2}^{\prime }=\displaystyle \frac{Ul}{(n+1)B}\left(\frac{z_{d}^{\prime }B}{l}+\frac{{\it\alpha}_{2}B}{2}\right)^{n+1}\quad \text{and}\quad {\it\psi}_{3}^{\prime }=\displaystyle \frac{Ul}{(n+1)B}.\end{array}\right\}\end{eqnarray}$$
Choosing
 $u_{1}^{\prime }=u_{1}({\it\psi}_{1}^{\prime })$
it is now possible to evaluate the integrals in (3.13)–(3.15). To do this we again introduce a non-dimensional stream function
$u_{1}^{\prime }=u_{1}({\it\psi}_{1}^{\prime })$
it is now possible to evaluate the integrals in (3.13)–(3.15). To do this we again introduce a non-dimensional stream function
 $\tilde{{\it\psi}}_{1}^{\prime }={\it\psi}^{\prime }(B/Ul)$
so that, after some manipulation, we can write
$\tilde{{\it\psi}}_{1}^{\prime }={\it\psi}^{\prime }(B/Ul)$
so that, after some manipulation, we can write
 $$\begin{eqnarray}\displaystyle I_{0} & = & \displaystyle \frac{{\it\beta}_{4}^{\prime }}{(z_{1}^{\prime }/l)^{n}(1-{\it\alpha}_{2}B)}\left\{\int _{0}^{\tilde{{\it\psi}}_{1}^{\prime }}\left(\left(\frac{\tilde{{\it\psi}}^{\prime }}{\tilde{{\it\psi}}_{1}^{\prime }}\right)^{2n/(n+1)}+{\it\beta}_{4}^{\prime 2}-1\right)^{-1/2}\,\text{d}\tilde{{\it\psi}}^{\prime }\right.\nonumber\\ \displaystyle & & \displaystyle +\,\left.\int _{\tilde{{\it\psi}}_{2}^{\prime }}^{\tilde{{\it\psi}}_{3}^{\prime }}\left(\left(\frac{\tilde{{\it\psi}}^{\prime }}{\tilde{{\it\psi}}_{1}^{\prime }}\right)^{2n/(n+1)}+{\it\beta}_{4}^{\prime 2}-1\right)^{-1/2}\,\text{d}\tilde{{\it\psi}}^{\prime }\right\}.\end{eqnarray}$$
 $$\begin{eqnarray}I_{1}=\frac{1}{(2n+1)}\frac{z_{1}^{\prime }}{{\it\alpha}_{2}Bl}\left(\left(\frac{z_{2}^{\prime }}{z_{1}^{\prime }}\right)^{2n+1}-1\right),\end{eqnarray}$$
and
 $$\begin{eqnarray}\displaystyle I_{2}\! & = & \displaystyle \!\frac{1}{(z_{1}^{\prime }/l)^{n}}\frac{1}{(1-B{\it\alpha}_{2})}\frac{1}{{\it\beta}_{4}^{\prime }-1}\!\left\{\!\int _{0}^{\tilde{{\it\psi}}_{1}^{\prime }}\!\left[\!\left(\!\!\left(\frac{\tilde{{\it\psi}}^{\prime }}{\tilde{{\it\psi}}_{1}^{\prime }}\right)^{2n/(n+1)}+{\it\beta}_{4}^{\prime 2}-1\right)^{1/2}\!-\left(\frac{\tilde{{\it\psi}}^{\prime }}{\tilde{{\it\psi}}_{1}^{\prime }}\right)^{n/(n+1)}\right]\,\text{d}\tilde{{\it\psi}}^{\prime }\right.\nonumber\\ \displaystyle & & \displaystyle +\,\left.\int _{\tilde{{\it\psi}}_{2}^{\prime }}^{\tilde{{\it\psi}}_{3}^{\prime }}\left[\left(\left(\frac{\tilde{{\it\psi}}^{\prime }}{\tilde{{\it\psi}}_{1}^{\prime }}\right)^{2n/(n+1)}+{\it\beta}_{4}^{\prime 2}-1\right)^{1/2}-\left(\frac{\tilde{{\it\psi}}^{\prime }}{\tilde{{\it\psi}}_{1}^{\prime }}\right)^{n/(n+1)}\right]\,\text{d}\tilde{{\it\psi}}^{\prime }\right\},\end{eqnarray}$$
where
 $z_{1}^{\prime }/l=z_{d}^{\prime }B/l-{\it\alpha}_{2}B/2$
and
$z_{1}^{\prime }/l=z_{d}^{\prime }B/l-{\it\alpha}_{2}B/2$
and
 $z_{2}^{\prime }/l=z_{d}^{\prime }B/l+{\it\alpha}_{2}B/2$
.
$z_{2}^{\prime }/l=z_{d}^{\prime }B/l+{\it\alpha}_{2}B/2$
.
By computing
 $I_{0}$
,
$I_{0}$
,
 $I_{1}$
and
$I_{1}$
and
 $I_{2}$
using (4.18)–(4.20), the unknown parameters
$I_{2}$
using (4.18)–(4.20), the unknown parameters
 ${\it\beta}_{4}^{\prime }$
and
${\it\beta}_{4}^{\prime }$
and
 ${\it\alpha}_{4}$
can now be obtained in the same way as that outlined in § 3. After solving for these parameters it is then possible to evaluate the power coefficient via (3.18). To do this we first note that
${\it\alpha}_{4}$
can now be obtained in the same way as that outlined in § 3. After solving for these parameters it is then possible to evaluate the power coefficient via (3.18). To do this we first note that
 $$\begin{eqnarray}\overline{U_{\ast }^{3}}=\frac{1}{(3n+1)}\frac{U^{3}}{{\it\alpha}_{2}B}((z_{2}^{\prime }/l)^{3n+1}-(z_{1}^{\prime }/l)^{3n+1}).\end{eqnarray}$$
Hence, (3.18) can be written as
 $$\begin{eqnarray}C_{P}={\it\alpha}_{2}(1-{\it\alpha}_{4}^{2})+{\it\alpha}_{2}({\it\beta}_{4}^{\prime 2}-1)\frac{3n+1}{n+1}\frac{(z_{1}^{\prime }/l)^{2n}((z_{2}^{\prime }/l)^{n+1}-(z_{1}^{\prime }/l)^{n+1})}{((z_{2}^{\prime }/l)^{3n+1}-(z_{1}^{\prime }/l)^{3n+1})}.\end{eqnarray}$$
In figure 4 we present the maximum power coefficient based on (4.22) as a function of geometric blockage ratio and strip location for two different shape parameters (
 $n=1$
and
$n=1$
and
 $n=1/7$
). In this figure we also plot solutions over the same parameter space for the effective blockage ratio and
$n=1/7$
). In this figure we also plot solutions over the same parameter space for the effective blockage ratio and
 $C_{p,max}^{\prime }$
, which is the maximum of a power coefficient
$C_{p,max}^{\prime }$
, which is the maximum of a power coefficient
 $$\begin{eqnarray}C_{P}^{\prime }=\frac{P}{\frac{1}{2}{\it\rho}lU^{3}}=\frac{\overline{U_{\ast }^{3}}}{U^{3}}C_{P}=\frac{1}{(3n+1)}\frac{1}{{\it\alpha}_{2}B}((z_{2}^{\prime }/l)^{3n+1}-(z_{1}^{\prime }/l)^{3n+1})C_{P}.\end{eqnarray}$$
Hence, unlike (4.22), the power coefficient
 $C_{P}^{\prime }$
is not normalised relative to the upstream velocity of the flow passing through the strip and therefore provides a measure of relative power extracted by the strip at different locations in the flow.
$C_{P}^{\prime }$
is not normalised relative to the upstream velocity of the flow passing through the strip and therefore provides a measure of relative power extracted by the strip at different locations in the flow.

Figure 4. Results for a strip operating in an asymmetric shear flow. (a,b) Maximum power coefficient, normalised by the cube of maximum upstream velocity; (c,d) maximum power coefficient, normalised by the average of the cube of the upstream velocity passing through the strip; (e,f) effective blockage ratio. Left-hand panels (a,c,e) are for
 $n=1$
. Right-hand panels (b,d,f) for
$n=1$
. Right-hand panels (b,d,f) for
 $n=1/7$
.
$n=1/7$
.
Focusing firstly on
 $C_{P,max}^{\prime }$
in figure 4, it is clear that more power is extracted as
$C_{P,max}^{\prime }$
in figure 4, it is clear that more power is extracted as
 $z_{d}^{\prime }$
increases; i.e. as the strip is moved to locations where the upstream velocity is largest. In contrast, the normalised power coefficient
$z_{d}^{\prime }$
increases; i.e. as the strip is moved to locations where the upstream velocity is largest. In contrast, the normalised power coefficient
 $C_{P,max}$
displays the opposite trend, implying a reduction in performance efficiency and a reduction in the effective blockage ratio as the strip is moved to locations where the upstream velocity is fastest. This trend in the normalised power coefficient and effective blockage ratio is such that, for both shape parameters, the effective blockage ratio is less than the geometric blockage ratio when the strip is placed higher than a particular location
$C_{P,max}$
displays the opposite trend, implying a reduction in performance efficiency and a reduction in the effective blockage ratio as the strip is moved to locations where the upstream velocity is fastest. This trend in the normalised power coefficient and effective blockage ratio is such that, for both shape parameters, the effective blockage ratio is less than the geometric blockage ratio when the strip is placed higher than a particular location
 $z_{d,0}^{\prime }$
(which is indicated by the thick dashed lines in figure 4). Based on the discussion in § 4.1, the trend can be explained by the fact that, when the strip is placed at
$z_{d,0}^{\prime }$
(which is indicated by the thick dashed lines in figure 4). Based on the discussion in § 4.1, the trend can be explained by the fact that, when the strip is placed at
 $z_{d}^{\prime }<z_{d,0}^{\prime }$
, the net bypass flow is relatively faster and so comparatively more power can be extracted by the strip than would be predicted using the geometric blockage and assuming a uniform flow. Alternatively, when
$z_{d}^{\prime }<z_{d,0}^{\prime }$
, the net bypass flow is relatively faster and so comparatively more power can be extracted by the strip than would be predicted using the geometric blockage and assuming a uniform flow. Alternatively, when
 $z_{d}^{\prime }>z_{d,0}^{\prime }$
, the net bypass flow is relatively slower and power extraction is reduced in the same way as in § 4.1.
$z_{d}^{\prime }>z_{d,0}^{\prime }$
, the net bypass flow is relatively slower and power extraction is reduced in the same way as in § 4.1.
For the velocity profiles examined in figure 4 the location
 $z_{d,0}^{\prime }$
is generally lower than the solid white lines in figure 4, which coincide with a location half way between both flow boundaries. This implies that a strip placed in the middle of the flow will have an effective blockage lower than the geometric blockage; the difference being 40 % and 5 % for
$z_{d,0}^{\prime }$
is generally lower than the solid white lines in figure 4, which coincide with a location half way between both flow boundaries. This implies that a strip placed in the middle of the flow will have an effective blockage lower than the geometric blockage; the difference being 40 % and 5 % for
 $n=1$
and
$n=1$
and
 $1/7$
, respectively, when
$1/7$
, respectively, when
 $B=1/3$
. This has some obvious implications for turbines operating at different locations across highly sheared flows, as discussed further in § 6.
$B=1/3$
. This has some obvious implications for turbines operating at different locations across highly sheared flows, as discussed further in § 6.
5 Numerical modelling
5.1 Model background
To validate the extended actuator disc model we now present numerical simulations of an inviscid shear flow incident on an actuator strip. The numerical code used is outlined in Draper (Reference Draper2011) and solves the shallow water equations (SWEs)
 $$\begin{eqnarray}\displaystyle & \displaystyle \frac{\partial h}{\partial t}+\boldsymbol{{\rm\nabla}}\boldsymbol{\cdot }(h\boldsymbol{u})=0, & \displaystyle\end{eqnarray}$$
 $$\begin{eqnarray}\displaystyle & \displaystyle \frac{\partial uh}{\partial t}+\frac{\partial u^{2}h}{\partial x}+\frac{\partial uvh}{\partial y}=-gh\frac{\partial h}{\partial x}, & \displaystyle\end{eqnarray}$$
 $$\begin{eqnarray}\displaystyle & \displaystyle \frac{\partial vh}{\partial t}+\frac{\partial uvh}{\partial x}+\frac{\partial v^{2}h}{\partial y}=-gh\frac{\partial h}{\partial y}, & \displaystyle\end{eqnarray}$$

Figure 5. Numerical simulation (markers) and actuator disc solution of Garrett & Cummins (Reference Garrett and Cummins2007) (solid lines). Circles are for standard numerical set-up. The marker resembling a 5-point star is for
 $s/l=1/4$
; and the marker resembling a 7-point star is for
$s/l=1/4$
; and the marker resembling a 7-point star is for
 $s/l=1$
.
$s/l=1$
.
where
 $\boldsymbol{u}=(u,v)$
defines the velocity components,
$\boldsymbol{u}=(u,v)$
defines the velocity components,
 $g$
is acceleration due to gravity and
$g$
is acceleration due to gravity and
 $h$
is water depth. Although (5.1)–(5.3) represent the SWEs, it is well known that if we set
$h$
is water depth. Although (5.1)–(5.3) represent the SWEs, it is well known that if we set
 $h(\boldsymbol{x},t)=h_{0}+{\it\xi}(\boldsymbol{x},t)$
, in which
$h(\boldsymbol{x},t)=h_{0}+{\it\xi}(\boldsymbol{x},t)$
, in which
 ${\it\xi}(\boldsymbol{x},t)$
captures the variation in water depth, and we introduce non-dimensional parameters
${\it\xi}(\boldsymbol{x},t)$
captures the variation in water depth, and we introduce non-dimensional parameters
 $h^{\prime }=h/h_{0}$
,
$h^{\prime }=h/h_{0}$
,
 $\boldsymbol{u}^{\prime }=\boldsymbol{u}/U$
,
$\boldsymbol{u}^{\prime }=\boldsymbol{u}/U$
,
 $\boldsymbol{x}^{\prime }=\boldsymbol{x}/l$
and
$\boldsymbol{x}^{\prime }=\boldsymbol{x}/l$
and
 $t^{\prime }=t(U/l)$
for a characteristic length
$t^{\prime }=t(U/l)$
for a characteristic length
 $l$
and velocity
$l$
and velocity
 $U$
, (5.2) and (5.3) can be written as
$U$
, (5.2) and (5.3) can be written as
 $$\begin{eqnarray}\displaystyle & \displaystyle h^{\prime }\frac{\partial h^{\prime }}{\partial x^{\prime }}=-\frac{U^{2}}{gh_{0}}\left(\frac{\partial u^{\prime }h^{\prime }}{\partial t^{\prime }}+\frac{\partial u^{\prime 2}h^{\prime }}{\partial x^{\prime }}+\frac{\partial u^{\prime }v^{\prime }h^{\prime }}{\partial y^{\prime }}\right),\quad \text{and}\quad & \displaystyle\end{eqnarray}$$
 $$\begin{eqnarray}\displaystyle & \displaystyle h^{\prime }\frac{\partial h^{\prime }}{\partial y^{\prime }}=-\frac{U^{2}}{gh_{0}}\left(\frac{\partial {v^{\prime }h}^{\prime }}{\partial t^{\prime }}+\frac{\partial {v^{\prime }u}^{\prime }h^{\prime }}{\partial x^{\prime }}+\frac{\partial v^{\prime 2}h^{\prime }}{\partial y^{\prime }}\right). & \displaystyle\end{eqnarray}$$
This result indicates that spatial variations in water depth will be negligible when
 $Fr=U/\sqrt{gh_{0}}\ll 1$
. Hence, in this limit the depth-averaged flow is effectively non-divergent and, since (5.2) and (5.3) can be written collectively as
$Fr=U/\sqrt{gh_{0}}\ll 1$
. Hence, in this limit the depth-averaged flow is effectively non-divergent and, since (5.2) and (5.3) can be written collectively as
 $$\begin{eqnarray}\frac{\partial \boldsymbol{u}}{\partial t}+(\boldsymbol{u}\boldsymbol{\cdot }\boldsymbol{{\rm\nabla}})\boldsymbol{u}=-g\boldsymbol{{\rm\nabla}}{\it\xi}+O\left(\frac{{\it\xi}}{h_{0}}\right),\end{eqnarray}$$
it can be seen that the SWEs become analogous to the incompressible Euler equations (with
 ${\it\rho}g{\it\xi}$
representing pressure). Based on this logic we have used the numerical model with
${\it\rho}g{\it\xi}$
representing pressure). Based on this logic we have used the numerical model with
 $Fr\leqslant 5\times 10^{-3}$
in this work to approximate the incompressible Euler equations. This has ensured
$Fr\leqslant 5\times 10^{-3}$
in this work to approximate the incompressible Euler equations. This has ensured
 ${\it\xi}/h_{0}<0.1\,\%$
across the numerical domain in all simulations.
${\it\xi}/h_{0}<0.1\,\%$
across the numerical domain in all simulations.
To represent the strip we introduce
 $Cu|u|$
to the right-hand side of (5.2) and apply it across a rectangular patch with lateral dimension
$Cu|u|$
to the right-hand side of (5.2) and apply it across a rectangular patch with lateral dimension
 $l$
and streamwise dimension
$l$
and streamwise dimension
 $s$
. The parameter
$s$
. The parameter
 $C$
is set equal to
$C$
is set equal to
 $kh_{0}/(2s)$
, where
$kh_{0}/(2s)$
, where
 $k$
is the (uniform) local strip resistance. In ‘base case’ simulations
$k$
is the (uniform) local strip resistance. In ‘base case’ simulations
 $s=l/2$
(although near this value the power is not very sensitive to aspect ratio; see figure 5). The patch is placed
$s=l/2$
(although near this value the power is not very sensitive to aspect ratio; see figure 5). The patch is placed
 $10l$
from the upstream boundary of a channel having streamwise length
$10l$
from the upstream boundary of a channel having streamwise length
 $25l$
and lateral width that varies according to geometric blockage ratio. The numerical mesh comprises right angled isosceles triangles (with short dimension
$25l$
and lateral width that varies according to geometric blockage ratio. The numerical mesh comprises right angled isosceles triangles (with short dimension
 $l/2$
) and fourth-order interpolating polynomial basis functions are used (increasing the polynomial order to five, or doubling the mesh, led to differences in power coefficient of less than 2 %). For all simulations velocity is specified at the upstream boundary, uniform depth is specified at the downstream boundary and symmetry conditions are imposed along the side walls. Initial conditions are
$l/2$
) and fourth-order interpolating polynomial basis functions are used (increasing the polynomial order to five, or doubling the mesh, led to differences in power coefficient of less than 2 %). For all simulations velocity is specified at the upstream boundary, uniform depth is specified at the downstream boundary and symmetry conditions are imposed along the side walls. Initial conditions are
 $u(x,z)=u_{1}(z)$
and
$u(x,z)=u_{1}(z)$
and
 $h(x,z)=h_{0}$
. The patch is introduced at
$h(x,z)=h_{0}$
. The patch is introduced at
 $t=0$
and the simulation runs until the power removed by the patch has reached a (near) steady value. This power is calculated by integrating
$t=0$
and the simulation runs until the power removed by the patch has reached a (near) steady value. This power is calculated by integrating
 ${\it\rho}C|u(x,z)|^{3}$
over the patch area. At the end of the simulation
${\it\rho}C|u(x,z)|^{3}$
over the patch area. At the end of the simulation
 ${\it\alpha}_{2}$
is calculated at a given point in the patch based on the streamwise velocity at the point and the upstream velocity on the same streamline. An average coefficient
${\it\alpha}_{2}$
is calculated at a given point in the patch based on the streamwise velocity at the point and the upstream velocity on the same streamline. An average coefficient
 $\overline{{\it\alpha}}_{2}$
was obtained for the line running in the spanwise direction through the middle of the patch. In all simulations instability of the wake occurred far downstream (
$\overline{{\it\alpha}}_{2}$
was obtained for the line running in the spanwise direction through the middle of the patch. In all simulations instability of the wake occurred far downstream (
 ${>}5l$
) of the strip, leading to vortex shedding and a wake qualitatively similar to that for a bluff body with base bleed (Wood Reference Wood1964) or a porous obstruction in shallow water (Ball, Stansby & Allison Reference Ball, Stansby and Allison1996). The downstream vortex shedding coincided with small, regular fluctuations in power at the strip (typically
${>}5l$
) of the strip, leading to vortex shedding and a wake qualitatively similar to that for a bluff body with base bleed (Wood Reference Wood1964) or a porous obstruction in shallow water (Ball, Stansby & Allison Reference Ball, Stansby and Allison1996). The downstream vortex shedding coincided with small, regular fluctuations in power at the strip (typically
 ${<}$
1 %), indicating that the downstream wake does affect the flow at the strip, but not significantly.
${<}$
1 %), indicating that the downstream wake does affect the flow at the strip, but not significantly.
To investigate performance of the numerical model, figure 5 presents numerical solutions for the power coefficient in uniform flow with
 $B=1/6$
and
$B=1/6$
and
 $B=1/4$
, and figure 6(a) presents an example solution for the flow field. The results in figure 5 are in excellent agreement with the actuator disc solution of Garrett & Cummins (Reference Garrett and Cummins2007).
$B=1/4$
, and figure 6(a) presents an example solution for the flow field. The results in figure 5 are in excellent agreement with the actuator disc solution of Garrett & Cummins (Reference Garrett and Cummins2007).

Figure 6. Streamlines and contours of
 $u(x,z)$
for each type of velocity profile simulated using the numerical model. All strips have
$u(x,z)$
for each type of velocity profile simulated using the numerical model. All strips have
 $k=3.5$
, which corresponds to (a)
$k=3.5$
, which corresponds to (a)
 $\overline{{\it\alpha}}_{2}=0.63$
; (b)
$\overline{{\it\alpha}}_{2}=0.63$
; (b)
 $\overline{{\it\alpha}}_{2}=0.53$
; and (c)
$\overline{{\it\alpha}}_{2}=0.53$
; and (c)
 $\overline{{\it\alpha}}_{2}=0.57$
. Vertical (red) line indicates centre of strip.
$\overline{{\it\alpha}}_{2}=0.57$
. Vertical (red) line indicates centre of strip.
5.2 Symmetric shear flow
We start by comparing the extended actuator disc model to numerical simulations having upstream velocity equal to (4.1) with
 $n=1$
(i.e. linear symmetric velocity profile, representative of a more extreme shear flow). For this scenario simulations have been performed for various strip resistances and three geometric blockage ratios (
$n=1$
(i.e. linear symmetric velocity profile, representative of a more extreme shear flow). For this scenario simulations have been performed for various strip resistances and three geometric blockage ratios (
 $B=1/3$
,
$B=1/3$
,
 $1/6$
and
$1/6$
and
 $1/10$
). Computed power coefficients are shown in figure 7 together with predictions from the extended model. It can be seen that the numerical results clearly differ from what might be expected in uniform bounded or unbounded flow, but are in very good agreement with the extended model in all cases.
$1/10$
). Computed power coefficients are shown in figure 7 together with predictions from the extended model. It can be seen that the numerical results clearly differ from what might be expected in uniform bounded or unbounded flow, but are in very good agreement with the extended model in all cases.

Figure 7. Power coefficient for (a)
 $B=1/3$
, (b)
$B=1/3$
, (b)
 $B=1/6$
and (c)
$B=1/6$
and (c)
 $B=1/10$
. Results from extended actuator strip model (solid lines); numerical simulation results (dots). Actuator model solution also shown for bounded uniform flow (dash dot line) and unbounded uniform flow (dashed line).
$B=1/10$
. Results from extended actuator strip model (solid lines); numerical simulation results (dots). Actuator model solution also shown for bounded uniform flow (dash dot line) and unbounded uniform flow (dashed line).
Figure 6(b) presents an example solution for a strip with resistance
 $k=3.5$
. This figure illustrates substantial changes to the streamwise velocity profile as the flow encounters the strip. To understand if these changes are captured by the extended actuator disc model, figure 8 presents the spanwise variation in the streamwise velocity for different strip resistances at
$k=3.5$
. This figure illustrates substantial changes to the streamwise velocity profile as the flow encounters the strip. To understand if these changes are captured by the extended actuator disc model, figure 8 presents the spanwise variation in the streamwise velocity for different strip resistances at
 $4l$
downstream of the strip (where the streamlines were observed to be almost parallel; indicating pressure has equalised across the flow). Also shown on this figure is the result from the extended actuator disc model at
$4l$
downstream of the strip (where the streamlines were observed to be almost parallel; indicating pressure has equalised across the flow). Also shown on this figure is the result from the extended actuator disc model at
 $x=x_{4}$
, which has been calculated according to the parametric equations
$x=x_{4}$
, which has been calculated according to the parametric equations
 $$\begin{eqnarray}u(x_{4},{\it\psi})=u_{4}({\it\psi})\quad \text{and}\quad z(x_{4},{\it\psi})=\int _{0}^{{\it\psi}}\frac{\text{d}{\it\psi}}{u_{4}({\it\psi})}.\end{eqnarray}$$
The agreement between the model result and the numerical simulation in figure 8 is excellent, both in terms of the velocity deficit directly in the wake of the strip and in the bypass flow. The only region of disagreement between both results is at the transition from the wake to the bypass flow at
 $z/(l/2B)\sim 0.2$
to 0.3, where the velocity is discontinuous in the actuator disc model.
$z/(l/2B)\sim 0.2$
to 0.3, where the velocity is discontinuous in the actuator disc model.

Figure 8. Model profile (solid lines) and simulated profile
 $4l$
downstream of strip (dashed lines) for linear symmetric shear flow with
$4l$
downstream of strip (dashed lines) for linear symmetric shear flow with
 $B=1/6$
. (a)
$B=1/6$
. (a)
 $\overline{{\it\alpha}}_{2}=0.80$
,
$\overline{{\it\alpha}}_{2}=0.80$
,
 $k=1$
; (b)
$k=1$
; (b)
 $\overline{{\it\alpha}}_{2}=0.66$
,
$\overline{{\it\alpha}}_{2}=0.66$
,
 $k=2$
. Only
$k=2$
. Only
 $z>0$
is shown due to symmetry.
$z>0$
is shown due to symmetry.
In combination, the comparisons above suggest that the assumption of lateral independence (used in the actuator disc model) is appropriate. However, to provide more direct justification we interrogate the numerical results further in two ways. First, we investigate if the numerical model shows a uniform local velocity coefficient
 ${\it\alpha}_{2}$
across the strip, since this was predicted in § 2 for a strip with uniform resistance in laterally unbounded flow. With this in mind, figure 9 presents
${\it\alpha}_{2}$
across the strip, since this was predicted in § 2 for a strip with uniform resistance in laterally unbounded flow. With this in mind, figure 9 presents
 ${\it\alpha}_{2}$
and the spanwise variation in the streamwise velocity at the centre of the strip for
${\it\alpha}_{2}$
and the spanwise variation in the streamwise velocity at the centre of the strip for
 $B=1/10$
and
$B=1/10$
and
 $n=1$
(which is a good approximation to a laterally unbounded flow since it has an effective blockage of
$n=1$
(which is a good approximation to a laterally unbounded flow since it has an effective blockage of
 ${\sim}$
0.5 % at optimum power extraction; see figure 3). It can be seen in figure 9 that
${\sim}$
0.5 % at optimum power extraction; see figure 3). It can be seen in figure 9 that
 ${\it\alpha}_{2}$
is indeed close to uniform, with only minor deviations observed at the edge of the strip as
${\it\alpha}_{2}$
is indeed close to uniform, with only minor deviations observed at the edge of the strip as
 $k$
increases.
$k$
increases.

Figure 9. (a) Streamwise velocity at the centre of the strip (normalised by
 $U$
) for
$U$
) for
 $B=1/10$
and
$B=1/10$
and
 $n=1$
. (b) Velocity coefficient
$n=1$
. (b) Velocity coefficient
 ${\it\alpha}_{2}$
at the centre of the strip. Extended actuator model (solid lines); numerical simulation (dashed lines).
${\it\alpha}_{2}$
at the centre of the strip. Extended actuator model (solid lines); numerical simulation (dashed lines).
Second, we can directly compute
 $X$
, and its density
$X$
, and its density
 ${\it\delta}X$
, using the numerical model. To do this we note that for a strip in unbounded flow we can write, using (2.2) and (2.8), that
${\it\delta}X$
, using the numerical model. To do this we note that for a strip in unbounded flow we can write, using (2.2) and (2.8), that
 $$\begin{eqnarray}[{\it\alpha}_{2}({\it\psi})]^{2}k=(1-[{\it\alpha}_{4}({\it\psi})]^{2}).\end{eqnarray}$$
Combining this with (2.5) therefore gives:
 $$\begin{eqnarray}\frac{{\it\delta}X}{{\it\delta}T}=1-\frac{2}{{\it\alpha}_{2}({\it\psi})k}\left(1-\sqrt{1-k[{\it\alpha}_{2}({\it\psi})]^{2}}\right).\end{eqnarray}$$
Hence, noting that by definition
 ${\it\delta}T=(1/2){\it\rho}k[u_{2}({\it\psi})]^{2}{\it\delta}l=(1/2){\it\rho}ku_{2}({\it\psi}){\it\delta}{\it\psi}$
, it follows that
${\it\delta}T=(1/2){\it\rho}k[u_{2}({\it\psi})]^{2}{\it\delta}l=(1/2){\it\rho}ku_{2}({\it\psi}){\it\delta}{\it\psi}$
, it follows that
 $$\begin{eqnarray}X=\int {\it\delta}X=\frac{{\it\rho}}{2}\int _{-{\it\psi}_{1}/2}^{{\it\psi}_{1}/2}u_{1}({\it\psi})\left({\it\alpha}_{2}({\it\psi})k-2\left(1-\sqrt{1-k[{\it\alpha}_{2}({\it\psi})]^{2}}\right)\right)\,\text{d}{\it\psi}.\end{eqnarray}$$
Calculating (5.9) and (5.10) for
 $n=1$
,
$n=1$
,
 $k=2$
and
$k=2$
and
 $B=1/10$
we find that
$B=1/10$
we find that
 ${\it\delta}X/{\it\delta}T$
is less than 10 % at all locations across the strip at optimum power extraction, whilst
${\it\delta}X/{\it\delta}T$
is less than 10 % at all locations across the strip at optimum power extraction, whilst
 $X/T$
is less than 5 %. Thus, lateral independence appears to be an appropriate assumption for a strip operating at optimum power coefficient in a flow with a linear (i.e. highly sheared) velocity profile.
$X/T$
is less than 5 %. Thus, lateral independence appears to be an appropriate assumption for a strip operating at optimum power coefficient in a flow with a linear (i.e. highly sheared) velocity profile.
Finally, to conclude this section we recall from § 3 that the extended model does not exactly represent a strip with uniform resistance when the blockage is finite and the flow upstream of the strip is non-uniform. To investigate how close to uniform the resistance in the extended model is for the cases presented in this section, figure 10 presents the relevant strip resistances due to (3.20). It can be seen that the resistance is very close to uniform in all cases, and this partly explains the good agreement observed between the actuator model and numerical simulations (especially for
 $B=1/6$
and
$B=1/6$
and
 $1/10$
).
$1/10$
).

Figure 10. Variation in resistance
 $k$
across the strip in the extended model, computed from (3.20). Only
$k$
across the strip in the extended model, computed from (3.20). Only
 $z>0$
is shown due to symmetry: (a)
$z>0$
is shown due to symmetry: (a)
 $B=1/3$
, (b)
$B=1/3$
, (b)
 $B=1/6$
, (c)
$B=1/6$
, (c)
 $B=1/10$
.
$B=1/10$
.
5.3 Asymmetric shear flow
We now consider an asymmetric velocity profile based on (4.14). Again we choose
 $n=1$
. Numerical simulations are performed for three different strip locations (corresponding to
$n=1$
. Numerical simulations are performed for three different strip locations (corresponding to
 $z_{d}^{\prime }/l=1.5$
, 3 and 4.5) with geometric blockage
$z_{d}^{\prime }/l=1.5$
, 3 and 4.5) with geometric blockage
 $B=1/6$
.
$B=1/6$
.
For these scenarios, simulated power coefficients are presented in figure 11 together with the extended actuator disc model results. It can be seen in this figure that the extended actuator disc model under predicts the power compared to the numerical simulations. Figures 6(c) and 12 show that the reason for this under prediction is that the streamlines are skewed, with the flow through the strip originating from a faster region of the upstream flow than that directly upstream of the strip and assumed in § 4.2. The reason for the skewing of the streamlines is due to the fact that the bypass flow on the side with slower upstream velocity must accelerate by a larger fraction (and therefore, due to continuity, a larger upstream region of the flow must bypass on this side) so as to achieve the same background pressure gradient as that realised by the faster flow bypassing on the other side of the strip. Consequently, the degree of skewing increases when the strip is placed at smaller values of
 $z_{d}^{\prime }$
(because then the bypass below the strip is relatively slower) and when
$z_{d}^{\prime }$
(because then the bypass below the strip is relatively slower) and when
 $k$
is increased (because then the pressure gradient is larger).
$k$
is increased (because then the pressure gradient is larger).

Figure 11. Variation in power coefficient
 $C_{P}^{\prime }$
for a linear shear flow having
$C_{P}^{\prime }$
for a linear shear flow having
 $B=1/6$
. Solid line is prediction based on extended model. Markers show simulation results. Dashed lines are corrected predictions. The strip is located at (a)
$B=1/6$
. Solid line is prediction based on extended model. Markers show simulation results. Dashed lines are corrected predictions. The strip is located at (a)
 $z_{d}^{\prime }=4.5l$
; (b)
$z_{d}^{\prime }=4.5l$
; (b)
 $z_{d}^{\prime }=3l$
; (c)
$z_{d}^{\prime }=3l$
; (c)
 $z_{d}^{\prime }=1.5l$
.
$z_{d}^{\prime }=1.5l$
.

Figure 12. Streamlines passing through the centre of the strip for a linear shear flow, with geometric blockage
 $B=1/6$
and
$B=1/6$
and
 $k=3.5$
. The strip is located at (a)
$k=3.5$
. The strip is located at (a)
 $z_{d}^{\prime }=4.5l$
(
$z_{d}^{\prime }=4.5l$
(
 $\overline{{\it\alpha}}_{2}=0.56$
); (b)
$\overline{{\it\alpha}}_{2}=0.56$
); (b)
 $z_{d}^{\prime }=3l$
(
$z_{d}^{\prime }=3l$
(
 $\overline{{\it\alpha}}_{2}=0.57$
); (c)
$\overline{{\it\alpha}}_{2}=0.57$
); (c)
 $z_{d}^{\prime }=1.5l$
(
$z_{d}^{\prime }=1.5l$
(
 $\overline{{\it\alpha}}_{2}=0.59$
).
$\overline{{\it\alpha}}_{2}=0.59$
).
A simple way to correct the actuator model predictions to account for skew in the streamlines is to update the location of the strip based on the observed streamline pattern in the numerical simulation (i.e. to increase
 $z_{d}^{\prime }$
to match the location of the upstream flow). Figure 11 presents a portion of the predicted power curves for each scenario following this correction. It can be seen that the model now does a much better job of matching the numerical simulations, with the agreement within 5–10 % in all cases.
$z_{d}^{\prime }$
to match the location of the upstream flow). Figure 11 presents a portion of the predicted power curves for each scenario following this correction. It can be seen that the model now does a much better job of matching the numerical simulations, with the agreement within 5–10 % in all cases.
Of course, in practice it would not normally be possible to iterate the theoretical prediction in the way shown in figure 11, because this requires output from a numerical simulation. Hence an assumption of no skew would normally be required in the theoretical model, and this will lead to under prediction of the power coefficient. For the reasonably extreme case of a linear shear flow this error exceeded 20–30 % for the locations considered in figure 11. However, in more practical scenarios, the error is likely to be lower than this because (i) as noted above, the skewing of the streamlines reduces when the difference in the upstream velocity of the flow bypassing either side of the strip reduces, and so less extreme shear profiles (i.e.
 $n<1$
) will lead to less skewing of the streamlines; and (ii) skewing is less prominent when the strip is placed in the faster region of the flow, where power generation is largest.
$n<1$
) will lead to less skewing of the streamlines; and (ii) skewing is less prominent when the strip is placed in the faster region of the flow, where power generation is largest.
To complete the comparison between the simulations and the extended model in asymmetric shear flow, figure 13 presents the normalised maximum power coefficient and effective blockage ratio as a function of strip location. In this figure the location
 $z_{d}^{\prime }/l$
for the numerical results have been adjusted to match the upstream location of the core flow. With this correction it can be seen that there is reasonable agreement with the theoretical model. Additionally, the trends shown in these figures are the same as those in figure 4; i.e. as the strip is moved to small values of
$z_{d}^{\prime }/l$
for the numerical results have been adjusted to match the upstream location of the core flow. With this correction it can be seen that there is reasonable agreement with the theoretical model. Additionally, the trends shown in these figures are the same as those in figure 4; i.e. as the strip is moved to small values of
 $z_{d}^{\prime }$
, the normalised power and the effective blockage ratio increase by an amount which is dependent on the shape parameter.
$z_{d}^{\prime }$
, the normalised power and the effective blockage ratio increase by an amount which is dependent on the shape parameter.

Figure 13. (a) Maximum power coefficient and (b) effective blockage ratio, as a function of strip location in different asymmetric velocity profiles. Lines represent different shape parameters. Markers indicate numerical simulation results for
 $n=1$
(plotted with
$n=1$
(plotted with
 $z_{d}^{\prime }/l$
equal to the upstream location of the core flow observed in the simulations). Shaded region in (b) indicates locations with
$z_{d}^{\prime }/l$
equal to the upstream location of the core flow observed in the simulations). Shaded region in (b) indicates locations with
 $B>B_{eff}$
.
$B>B_{eff}$
.
 $B=1/6$
.
$B=1/6$
.
6 Discussion and conclusions
In this paper we have extended the classical actuator disc model to investigate the performance of an actuator strip with uniform resistance in laterally unbounded and laterally bounded inviscid shear flow. This model has been compared favourably with numerical simulations approximating the incompressible Euler equations.
For convenience the model has been presented for two-dimensional scenarios. Nevertheless, as noted in § 2, the main results obtained herein for laterally unbounded flow may be applied directly to three-dimensional configurations (as may be most applicable for wind turbines). Additionally, the analysis presented for laterally bounded flows may also be extended to three-dimensional configurations, provided that the integrations across the individual fluid elements extend over the relevant three-dimensional turbine and bypass flows. In general, however, this will make the analysis more complex than that presented in this paper. For this reason it is therefore relevant to point out that the two-dimensional solutions presented in § 5 for laterally bounded flow may be directly useful as approximate solutions for some relevant three-dimensional scenarios. Two practical arrangements for which this may be the case are: (i) a long lateral row of closely spaced wind or tidal turbines, in which the shear flow (around each turbine) is confined to the vertical plane, and (ii) a fence of tidal turbines in a wide tidal channel, for which the shear flow (around the entire fence) is confined to the horizontal plane.
With these applications in mind, solution of the extended actuator model has suggested two key results. Firstly, for laterally unbounded flow, the model indicates that the power coefficient obtained in different shear flows should collapse to the classical result obtained for uniform flow, provided that the average of the cube of the velocity of the upstream fluid that subsequently passes through the strip is used in the normalisation. This first result is slightly different to that presented in existing literature, and is applicable provided that (i) the local resistance offered by the turbine is uniform and (ii) the upstream location of the flow passing through the turbine(s) can be identified (or estimated). As noted by Fleming et al. (Reference Fleming, McIntosh and Willden2013), a useful implication of this result is that if the performance of an ideal turbine is known in one particular velocity profile (or location within the velocity profile), the performance of the same turbine in a different shear flow (or location) may be predicted.
Secondly, for an actuator placed in a laterally bounded shear flow, it has been shown that the effective blockage realised by the ideal turbine is dependent on the particular shape of the velocity profile and the relative placement of the turbine. This is because when the upstream velocity of the bypass flow is relatively slow, the background pressure gradient induced due to the blockage is reduced and the power potential is reduced. In the context of a row of tidal turbines in vertically sheared flow, this result suggests that placing turbines towards the top of the water column may result in an effective blockage that is significantly less than the geometric blockage. For a
 $1/7$
th power law velocity profile, for example, the results in § 4.2 suggest that placing a row of turbines close to the top of the water column can lead to an effective blockage as low as
$1/7$
th power law velocity profile, for example, the results in § 4.2 suggest that placing a row of turbines close to the top of the water column can lead to an effective blockage as low as
 ${\sim}$
0.25 when the geometric blockage is 0.3 (figure 4). Ignoring this reduction in effective blockage (but correcting for the variation in the upstream flow velocity by using
${\sim}$
0.25 when the geometric blockage is 0.3 (figure 4). Ignoring this reduction in effective blockage (but correcting for the variation in the upstream flow velocity by using
 $\overline{U_{\ast }^{3}}$
in the normalisation) would lead to an overestimate of the maximum power coefficient by
$\overline{U_{\ast }^{3}}$
in the normalisation) would lead to an overestimate of the maximum power coefficient by
 ${\sim}$
13 %.
${\sim}$
13 %.
Both of the results above are focused on the power performance of an ideal turbine in an inviscid shear flow. An equally important output for understanding turbine performance in shear flow is the variation in force across the turbine, since variations in force introduce fatigue associated with blade rotation. To this end, the extended model presented herein indicates that the force at any location on the actuator in shear flow is
 $(1/2){\it\rho}k({\it\psi}){\it\alpha}_{2}^{2}[u_{1}({\it\psi})]^{2}$
, for an ideal turbine with uniform velocity coefficient
$(1/2){\it\rho}k({\it\psi}){\it\alpha}_{2}^{2}[u_{1}({\it\psi})]^{2}$
, for an ideal turbine with uniform velocity coefficient
 ${\it\alpha}_{2}$
. This result may be evaluated by solving (3.11) and (3.12), and subsequently (3.20), for a given geometric blockage ratio, upstream velocity profile and velocity coefficient
${\it\alpha}_{2}$
. This result may be evaluated by solving (3.11) and (3.12), and subsequently (3.20), for a given geometric blockage ratio, upstream velocity profile and velocity coefficient
 ${\it\alpha}_{2}$
, and may be used as a first estimate of the mean variation in force across the turbine (or a uniformly porous structure) in shear flow.
${\it\alpha}_{2}$
, and may be used as a first estimate of the mean variation in force across the turbine (or a uniformly porous structure) in shear flow.
Thinking practically, it is also of interest to understand how changes in power performance due to shear effects might compare with effects due to free stream turbulence. At present it is difficult to make this comparison directly for a real turbine rotor; however, for ideal turbines represented as actuator discs Nishino & Willden (Reference Nishino and Willden2012b
) have recently shown using three-dimensional Reynolds-averaged Navier–Stokes computations that free stream turbulence can enhance near-wake mixing and lead to an increase in power of up to
 ${\sim}$
10 % across a realistic range of turbulence intensity. Hence it appears that this increase in power may be of a similar order of magnitude to the shear effect investigated in this paper. Interestingly, however, the positive effect of free stream turbulence on power performance may oppose the effects of velocity shear in laterally bounded flows (in which the effective blockage ratio is often likely to be lower than the geometric blockage when the turbine is placed in a location with relatively faster flow; see figure 4).
${\sim}$
10 % across a realistic range of turbulence intensity. Hence it appears that this increase in power may be of a similar order of magnitude to the shear effect investigated in this paper. Interestingly, however, the positive effect of free stream turbulence on power performance may oppose the effects of velocity shear in laterally bounded flows (in which the effective blockage ratio is often likely to be lower than the geometric blockage when the turbine is placed in a location with relatively faster flow; see figure 4).
With respect to this comparison between shear effects and free stream turbulence, it is also important to note that the theory presented in this paper ignores the effects of wall friction. When applying the present model to wind or tidal turbine(s) in a vertically sheared flow, for example, bottom friction will act to inhibit bypass flow beneath the turbine. This will lead to less skew in the streamlines passing through the turbine and will act to increase the effective blockage ratio. The importance of these corrections will, however, be negligible if the force due to bed friction is small compared with the force applied by the actuator.
Several extensions to the analysis presented in this paper are possible. For instance, different velocity profiles to those modelled in this paper may be considered. Extending the analysis in this way could build on the work presented here and in Draper et al. (Reference Draper, Nishino and Adcock2014) who modelled a piecewise-constant velocity profile that was interpreted as a simplified representation of an ocean current. Secondly, it would be worthwhile to extend the analysis in this paper to account for actuator strips with non-uniform resistance in uniform or sheared flows. These strips may be more representative of offshore structures with variable porosity or realistic turbines modelled using blade element theory. A third extension could take into account wake mixing downstream of the turbine so as to estimate turbine efficiency (or wake loss) in a similar way to Garrett & Cummins (Reference Garrett and Cummins2007) for uniform flow. In a shear flow this particular extension would require some assumption about the downstream velocity profile after mixing, as well as the frictional losses at the lateral boundaries required to establish this profile. Alternatively, if it is assumed that the far downstream velocity profile is the same as that far upstream, and that frictional losses on the lateral boundaries are negligible, control volume arguments may be used directly to provide an upper bound estimate of turbine efficiency.
Finally, we remark that a useful aspect of the extended actuator model presented herein is that it may be used to develop simple corrections on earlier actuator disc models. For instance, the extended model suggests a new refined power coefficient (to directly replace the power coefficient for uniform flow) and the model may be used to calculate an effective blockage ratio (to directly replace the geometric blockage ratio). The extended model may also be used to update existing theoretical models of partial fences and arrays of tidal turbines, such as those developed in Nishino & Willden (Reference Nishino and Willden2012a
, Reference Nishino and Willden2013) and Draper & Nishino (Reference Draper and Nishino2014), which make use of actuator disc models, but presently assume uniform flow. To do this, the model presented in this paper could be used to determine the relationship between
 ${\it\alpha}_{2}$
and
${\it\alpha}_{2}$
and
 $k$
for an actuator strip representing a local turbine and/or an array of turbines in these earlier models.
$k$
for an actuator strip representing a local turbine and/or an array of turbines in these earlier models.
Acknowledgement
The first author would like to acknowledge the support of the Lloyd’s Register Foundation. Lloyd’s Register Foundation invests in science, engineering and technology for public benefit, worldwide.


